



Foresight AI Dashboards
Foresight AI can create reports and dashboards based on natural language prompts, letting you see your reliability data in new and fully customized ways. You can create reusable dashboards, drill down into specific areas of your environment, collate data from across your Gremlin team in one place, and extend the built-in reporting capabilities.
Creating and managing dashboards
You can find dashboards under the Dashboards tab in Foresight.
Foresight lists each dashboard you’ve created in chronological order. To view a dashboard, click on its title bar to expand its view, then click Refresh to populate it. If your dashboard has a date range field, enter the start and end dates before pressing refresh. You can see the last time the dashboard was refreshed in the bottom-right corner.
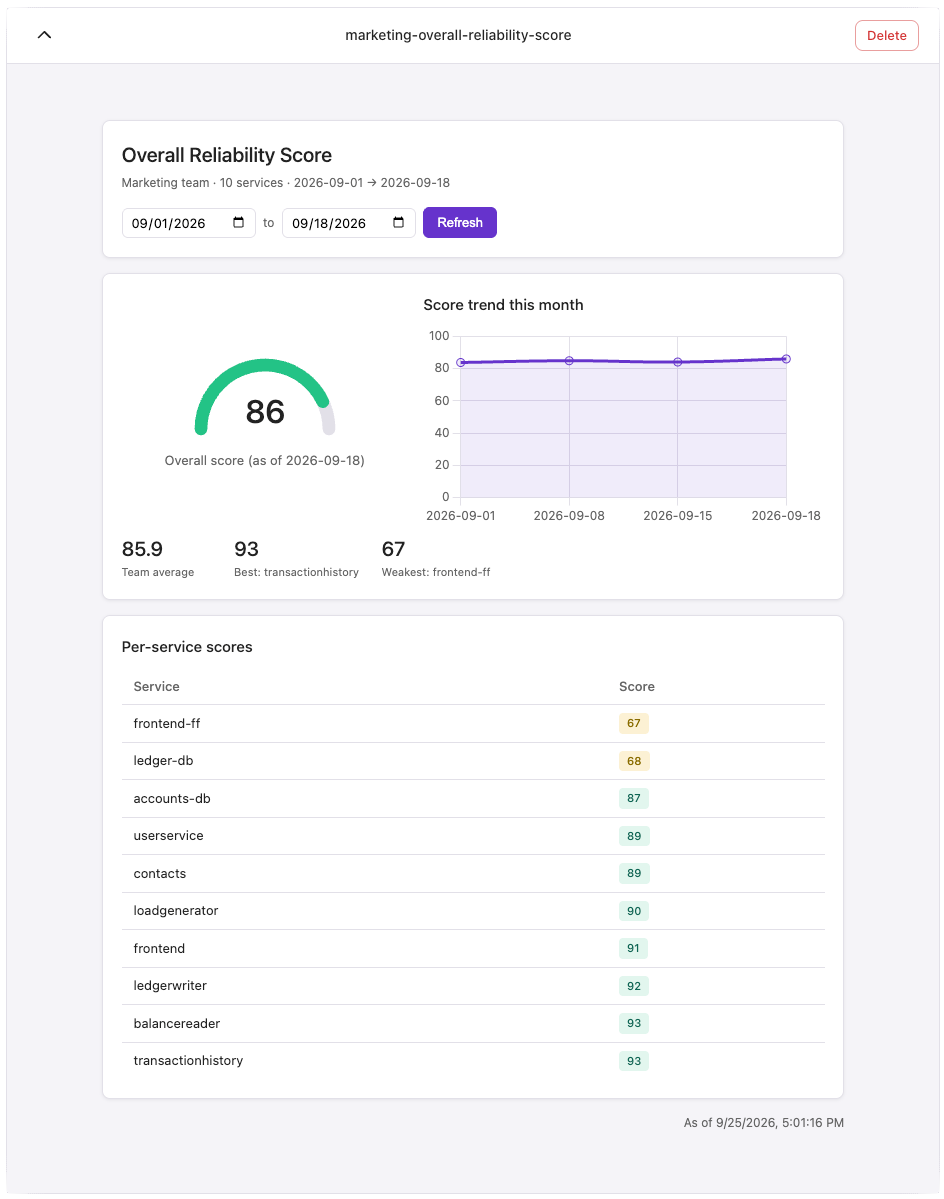
Creating a new dashboard
To create a new dashboard:
- Log into Foresight and open the Chat view.
- Enter a prompt asking Foresight to present data in your preferred layout. For example, you can ask:
- Create a dashboard of our reliability scores and Detected Risks over the past month.
- Create a dashboard showing failed experiments and Reliability Intelligence diagnoses.
- Create a dashboard showing each of my services and the status of each test run for the past week.
- After Foresight has created the dashboard, click Save to team dashboard at the bottom of the dashboard. The dashboard will be available to all members of your Gremlin team.
Deleting a dashboard
To delete a dashboard, find the dashboard you want to delete in the Dashboards view, then click the Delete button in its title bar.