


Running Failure Flags experiments
Supported platforms:
This document will walk you through running your first Failure Flags experiments. You can find examples in our example GitHub repository.
Example: the HTTPHandler service
Throughout this document, we'll demonstrate examples using Failure Flags by proxy and a simple web application called "HTTPHandler" deployed on AWS Lambda. This application takes incoming web requests and returns the time taken to process each request.
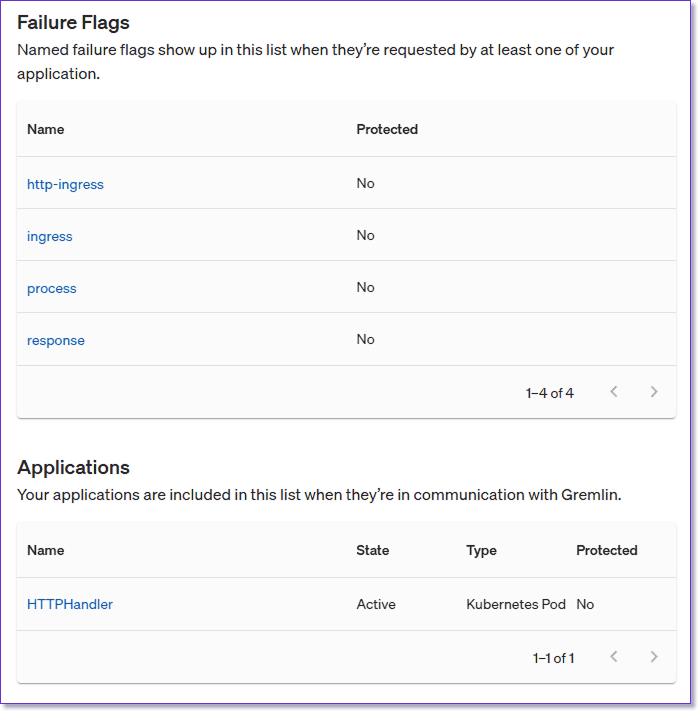
We'll use both methods of running Failure Flags: using proxy mode and using the SDK. The http-ingress, ingress, process, and response flags are added by their respective proxies. This example also includes a custom flag created using the SDK, called http-request. http-request has two labels: one tracks the request method, and the other tracks the URL path. Here is how this flag is configured using the Failure Flags SDK:
Node.js example
Go example
Creating a new Failure Flags experiment
To create a new experiment:
- Open the Gremlin web app and select Failure Flags in the left-hand nav menu.
- Click + Experiment.
- Under Application Selector, use the drop-down menu to select the application you want to target. This menu will only list actively detected application. You can see a list of active applications in the Gremlin web app.
- By default, any new instances of the application that Gremlin detects will be automatically included in the experiment. To prevent this, click the Prevent new application instances from joining at runtime checkbox.
- To limit which applications the Failure Flag will impact, use the Attributes drop-down. This drop-down lists labels detected in the application, including automatically-detected labels (such as availability zone or region for cloud applications). Select the attribute name from the drop-down, then in the Value field, enter the value(s) that the attribute must match in order to be impacted.
- You can enter additional attributes by clicking the + icon, or remove an attribute by clicking the delete icon.
- Click Next.
- Under Failure Flag Selector, use the drop-down menu to select the Failure Flag you want to target.
- To limit the code executions that the Failure Flag will impact, use the Attributes drop-down. This drop-down lists labels attached to the Failure Flag, such as the HTTP request method and URL. Select the attribute name from the drop-down, then in the Value field, enter the value(s) that the attribute must match in order to be impacted.
- You can enter additional attributes by clicking the + icon, or remove an attribute by clicking the delete icon.
- Click Next.
- Enter an experiment name. This can be anything you wish.
- When naming your experiments, use only alphanumeric characters, hyphens, underscores, and periods. Names can be up to 64 characters long.
- Under Effects, use the drop-down menu to select the type of experiment (the “effect”) to run. Then, use the Attributes fields to specify the parameters for the experiment. For example, selecting a latency experiment shows two attribute fields: one for the amount of latency to add (
ms), and one for the amount of jitter to add (jitter). - Select the percentage of matching Failure Flags instances to impact using the Impact Probability boxes. For example, if you choose 1%, then only 1% of the total Failure Flag instances matching your selectors will be impacted by the experiment. This does not apply to code executions—the Failure Flag selector name determines that.
- Specify how long the experiment will run for using Experiment Duration.
- If you want to enter a custom experiment duration, click Custom and type in the desired duration. The duration must follow the syntax
[0-9]+[mdh], e.g.,7mfor seven minutes or2hfor two hours.
- If you want to enter a custom experiment duration, click Custom and type in the desired duration. The duration must follow the syntax
- Click Save to save the experiment, or Save & Run to save and immediately execute the experiment.
Experiment options
Selectors
Selectors are JSON objects consisting of key-object pairs that tell Gremlin which application and Failure Flags to target for an experiment, as well as what effects to apply.
As an example, our HTTPHandler contains the following Node.js code:
This means that the the Failure Flag name is http-request, and the application name is HTTPHandler. With Failure Flags by proxy, the corresponding Failure Flag would be http-ingress.
Application Attributes
Application attributes identify specific instances of an application to run experiments on. For example, the HTTPHandler application runs in AWS Lambda in several different regions. We can use the following application attribute to only impact instances in us-west-1:
Gremlin automatically identifies some selectors where applicable (such as region and availability-zone), but you can add your own when configuring Failure Flags (or by using the Failure Flags SDK).
Flag Attributes
Flag attributes are selectors for targeting specific executions of the application's code. For example, this flag exposes the HTTP method and path for each request to Gremlin, letting us selectively impact requests based on their values:
We could, for example, only impact POST requests using the following attribute:
Gremlin also supports URL path-style wildcard matching on label values. For example, the Gremlin REST API provides an endpoint for viewing team details at /teams/{teamID}/profile. The following effect would impact all GET requests to this endpoint for all teams:
Effects
The Effect parameter is where you define the details of the experiment and the impact it will have on your application. The Effect parameter is a simple JSON map that gets passed to Failure Flags when an application is targeted by a running experiment.
Latency
Latency introduces a constant delay into each invocation of the application. Specify latency for the key, and the number of milliseconds you want to delay as the value. For example, this effect introduces a 2000 millisecond delay:
Minimum latency with jitter
Alternatively, you can add latency where the amount varies. For example, this effect introduces between 2000 and 2200 milliseconds of latency, where there is a pseudo-random uniform probability of the SDK applying any value within the jitter amount:
Errors
The Error effect throws an error with the provided message. This is useful for triggering specific error-handling methods or simulating errors you might find in production. For example, this effect triggers an error with the message "Failure Flag error triggered":
If your application uses custom error types or other error condition metadata, you can add this metadata to the error effect:
Errors in .NET
In .NET, the format of the exception impacts the type of exception thrown:
- Using
{"exception": "TestException"}will throw aTestExceptionexception with no message. - Using
{"exception": { "message": "TestException" } }will throw aFailureFlagsExceptionwith the messageTestException.
Combining Latency and Error effects
You can combine the latency and error effect to cause a delay before throwing an exception. This is useful for recreating conditions like network connection failures, degraded connections, or timeouts.
For example, this effect will cause the Failure Flag to pause for 2 full seconds before throwing an exception with a custom message:
Modifying HTTP responses
When using Failure Flags by proxy and the http-ingress, ingress, or response flags, you can inject custom responses using the httpResponse attribute. This attribute lets you modify the response's HTTP status code, Content-Type header, and body.
To provide a modified response, add the following to the Effects field with the following values:
Customizing an experiment's impact
When using the Failure Flags SDK, you can customize the impact of the experiment by adding a behavior function. For example, the following snippet writes data about the experiment to the console instead of applying the experiment to your code:
Node.js example
Go example
For even greater control, the SDK can detect whether an experiment is currently active. For example, during an experiment, you might want to prevent making certain API calls, or rollback a transaction. In most cases the Errors effect can help, but you can also create branches in your code. For example:
Node.js example
Go example
Language-specific features
This section is for features unique to specific SDKs.
Go
Panic
The Go SDK offers a unique fault called panic. This causes Failure Flags to panic with the provided message. This is useful when validating that either your application handles Go panics correctly, or when assessing the impact to other parts of the system when your code panics:
More information and examples are available on the project's GitHub repo.
Node.js
Changing application data
Failure Flags are also capable of modifying data, such as variables. In your application's call to invokeFailureFlag, add a new dataPrototype property and assign it a variable like a network request or response. You can also pass in object literals.
Once the dataPrototype property is set, you can add a data object to the effect statement. Any properties in the data object will be copied into a new object created from the prototype you provided.
While this experiment is active, myData will be changed to the following: