


Reports
Supported platforms:
Gremlin provides several reports to help teams get a comprehensive view of their services, experiments, and risks. This page explains how each one works.
Filtering and exporting reports
All Company reports can be filtered by team, service tag, or service. To filter a report:
- Type your search query into the bar, or simply click on the bar to show the filter list.
- Select your preferred team(s), service tag(s), or service name(s) from the popup. You can select multiple filters to refine your results. For example, selecting a team and a service tag will only show services with that tag belonging to the selected team.
- Click Filter.
You can export any report to a PDF by clicking Generate Report at the top of the page.
Company Reports
Reliability Report
The Reliability Report provides an overview of your entire Gremlin company’s reliability score, Detected Risks, and services. All charts show weekly data points over a six-month period.
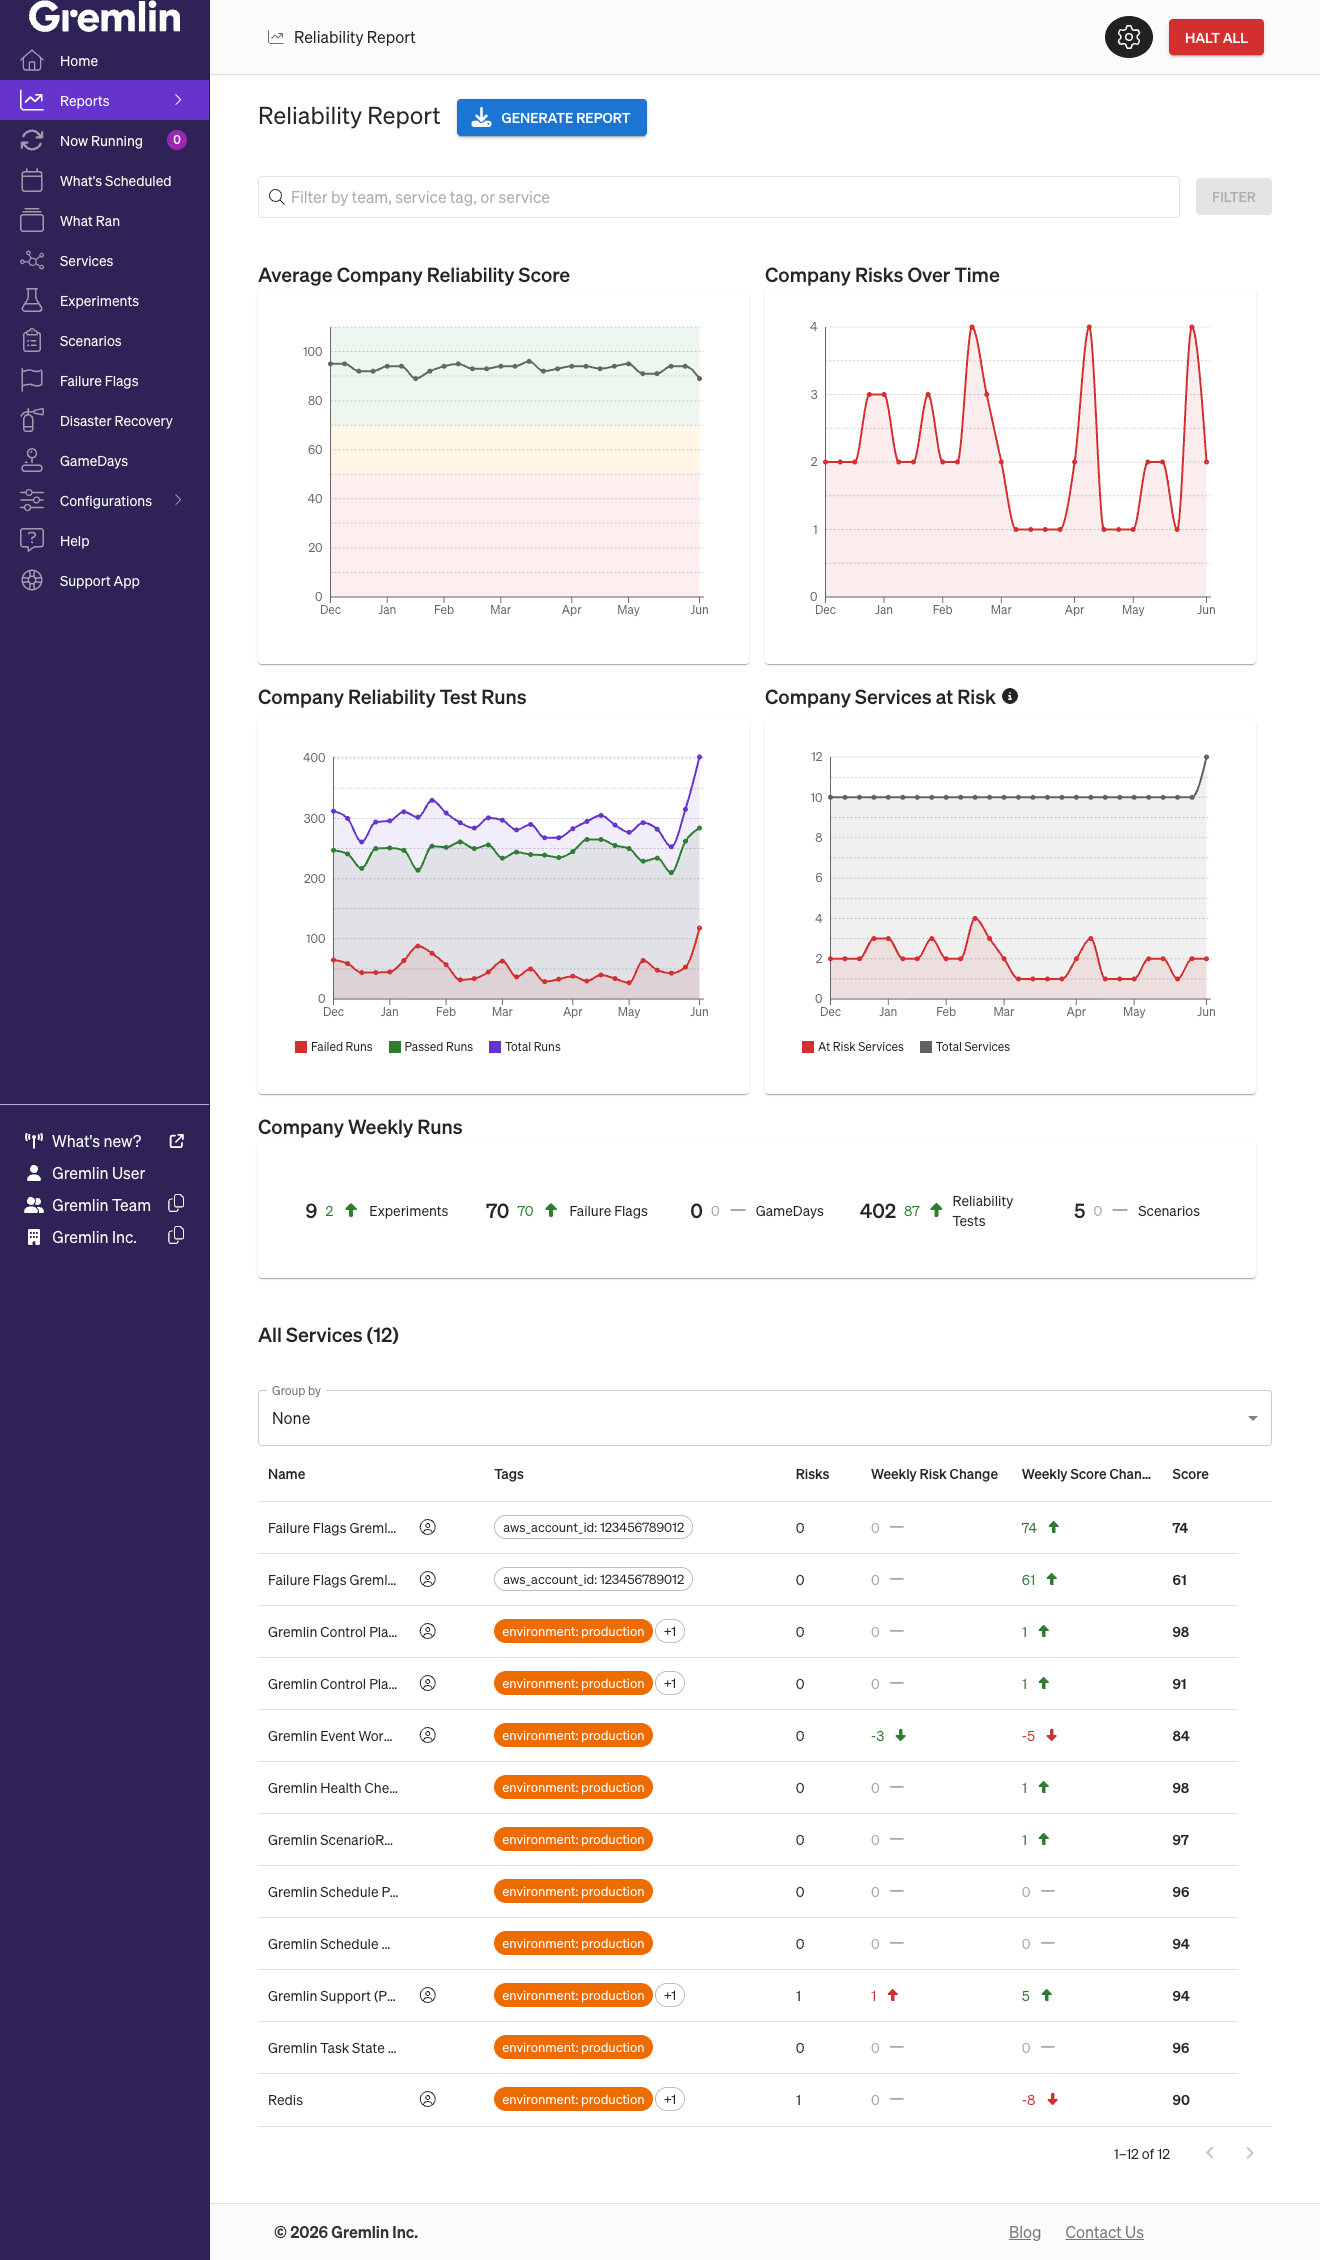
- Average Company Reliability Score shows the average reliability score across all services in your Gremlin company. The chart is divided into three sections: scores above 70 are considered good; scores between 70 and 50 are fair; and scores below 50 are poor.
- Company Risks Over Time shows the total number of “At Risk” Detected Risks across all services. “At Risk” means the risk is currently present in your systems and hasn’t been addressed.
- Company Reliability Test Runs shows the number of reliability tests performed, with separate lines for failed test runs, passed test runs, and total test runs.
- Company Services at Risk shows the number of services that currently have at least one “At Risk” Detected Risk, with separate lines for at-risk services and the total number of services in the company.
- Company Weekly Runs shows the number of experiments, Failure Flags experiments, GameDays, reliability tests, and Scenarios ran in the past week compared to the previous week.
The All Services ("Matching Services" if the report is filtered) table lists every service in your Gremlin company, along with their name, the number of Detected Risks, and its reliability score. Each service also shows its change in reliability score and Detected Risk count since the previous week, so you can easily see if there have been any improvements or regressions in the service’s reliability. You can also group the list by team, filter by service tag(s), and sort the list.
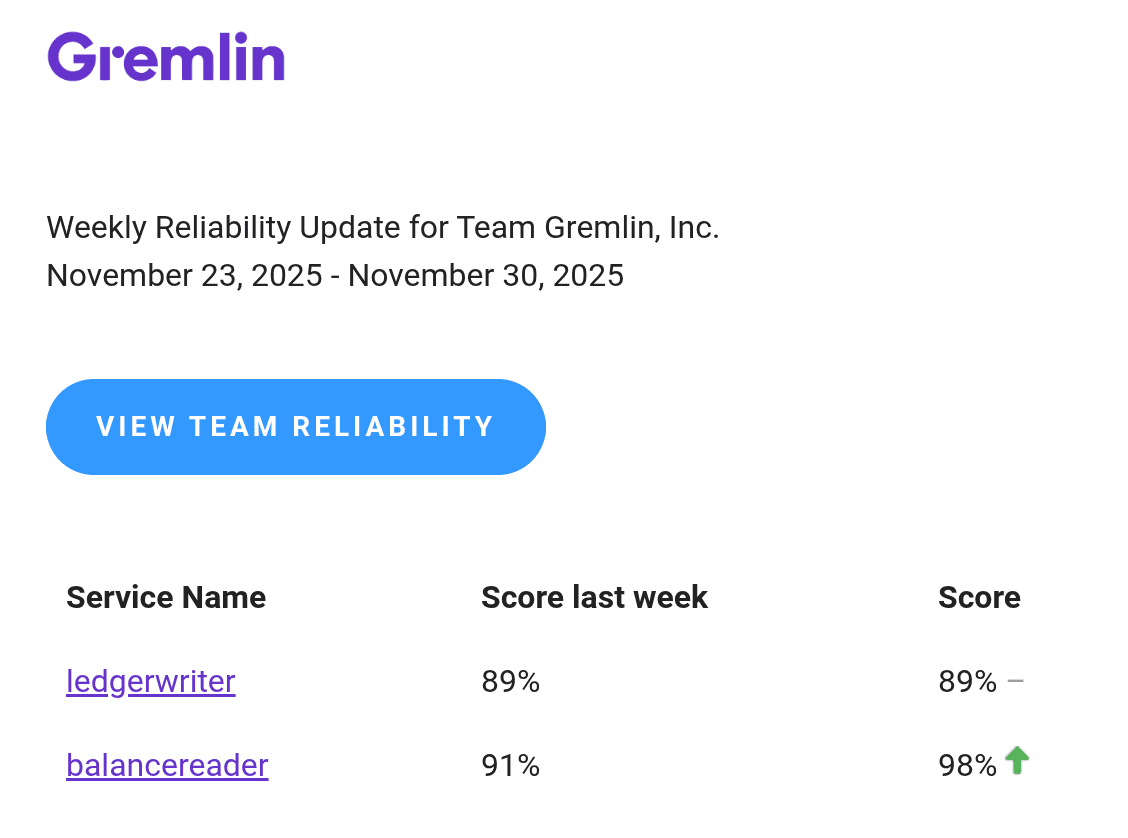
Scheduled report emails
Gremlin sends weekly email summaries of the Reliability Report.
- Company-level reports are sent to the Company Owner(s).
- Team-level reports are sent to team members with the
TEAM_SECURITY_WRITEprivilege (this includes the "Team Manager" and "Team Credential Manager" default roles), as well as the service owner.
Emails are sent on Sundays between 00:00 and 04:00 UTC.
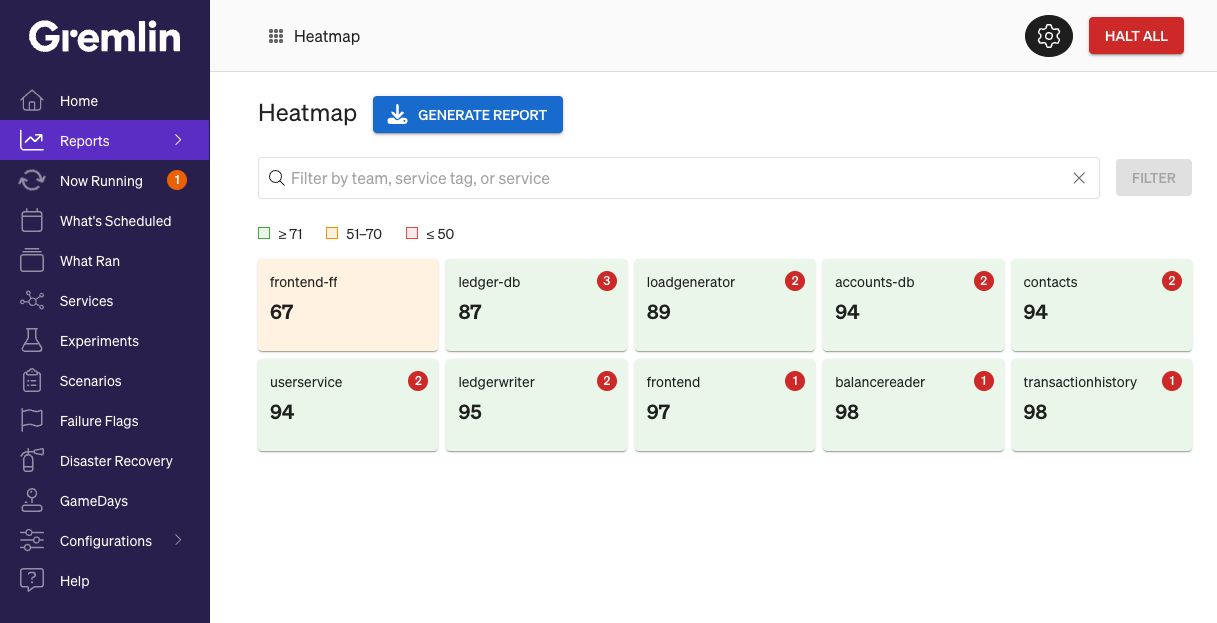
Heatmap
Heatmap shows a grid of every service in your Gremlin company with their name, current reliability score, and current Detected Risk count. Each service is color-coded according to its score: green for 75% or higher, yellow for 50–74%, and red for below 50%. If a service has Detected Risks, the risk count will appear in the top-right corner.
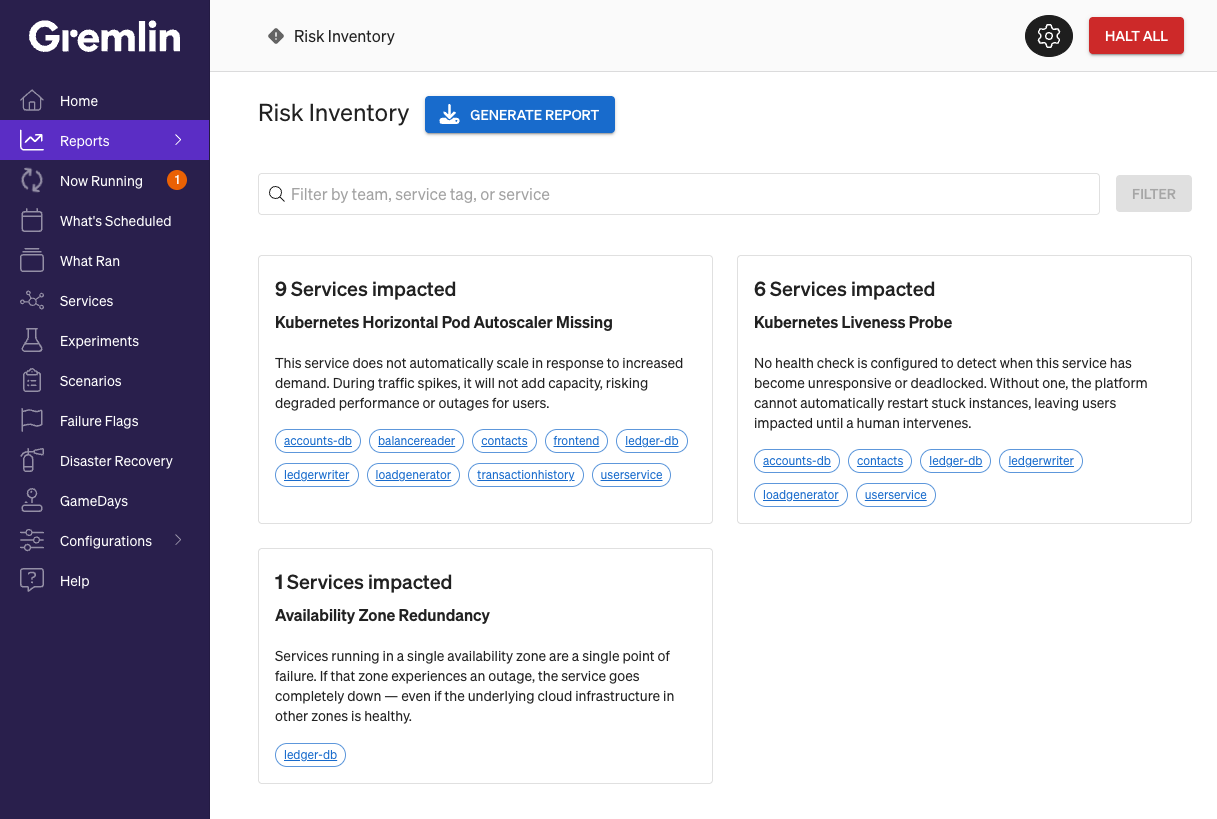
Risk Inventory
Risk Inventory groups the services in your company by Detected Risk. Gremlin lists each Detected Risk in order of the number of services impacted by it, from the greatest to least. Each card includes the risk name, description, and links to each affected service.
Team Reports
Team Reliability Report
The Team Reliability report is the default screen shown after logging into Gremlin. This report shows a week-over-week comparison of your reliability scores and test runs.
- Team Service Score Changes lists each service in your team by name next to last week’s reliability score and this week’s reliability score.
- Team Weekly Runs sums the number of reliability tests, experiments, Scenarios, Failure Flag tests, and GameDays performed this week compared to last week.
- Average Team Score charts your team’s average score on a bi-weekly basis.
Total Reliability Tests Run charts the total number of reliability tests your team ran on a bi-weekly basis.
Team Risk report
The Team Risk report shows Detected Risks for a single team.

Select the team you want to view from the drop-down list. The Total Risks Over Time chart shows the number of “At Risk” Detected Risks across all services in your team. Below, the table lists all of your team’s services, all Detected Risks, and the status of the risk (At Risk, Mitigated, or N/A). You can use the arrows at the bottom of the table to paginate through the table.
Team Score Report
The Team Score report is similar to the Team Risk report, only it shows a single team’s reliability score.

Select the team you want to view from the drop-down list. The Average Reliability Score Over Time chart shows the average reliability score for the team’s services over a three-month period. The chart is divided into three sections: scores above 70 are considered good; scores between 70 and 50 are fair; and scores below 50 are poor.
Next to the chart is the Average Reliability Score, which shows the average for each test category. These may change depending on which Test Suite your team is currently using.
Below, the table lists all of your team’s services, its reliability score, and the status for each reliability test (passed, failed, not run, or expired). You can use the arrows at the bottom of the table to paginate through the table.