


Health Checks
Supported platforms:
A Health Check checks the state of systems before, during, and after an experiment, Scenario, or reliability test. They're used to monitor the state of your systems to ensure they're still operating within your expectations. Health Checks also provide a level of safety when running tests: if your systems become unstable, unresponsive, or unhealthy, Health Checks will automatically halt ongoing tests and return your systems to normal operation.
Health Checks work by sending REST API requests to an endpoint that you specify: typically this is a monitor or alert in your observability tool. Gremlin sends a request to the monitor and checks the response time, response status code, and optionally a JSON payload against your success criteria. If any field fails to meet the criteria, the Health Check identifies the failure and signals the active test to stop. We strongly recommend using monitors and/or alerts as endpoints for Health Checks, since your team likely already uses these to measure the health of your service.
Gremlin natively supports Datadog, New Relic, PagerDuty, and several other tools listed below. Gremlin also supports custom endpoints so you can integrate any tool of your choice.
Managing Health Checks
You can view your Health Checks in the Gremlin web app by clicking on Configurations in the left-hand navigation menu and then clicking Health Checks. This page shows every Health Check available to your Gremlin team and lets you create, edit, or delete Health Checks.
Health Check authentication
When you authenticate with an observability tool for the first time, Gremlin saves the authentication details. This way, you can reuse the same authentication details instead of having to redefine them for every new health check you create. These authentication details are also available to other members of your Gremlin team.
You can view and edit all saved authentication details by first navigating to the Health Checks list, then clicking the Authentication tab.
Creating Health Checks
To create a new Health Check, click on Configurations in the left-hand navigation menu, then click Health Checks. From here, click the+ Health Check button in the top-right corner of the page.
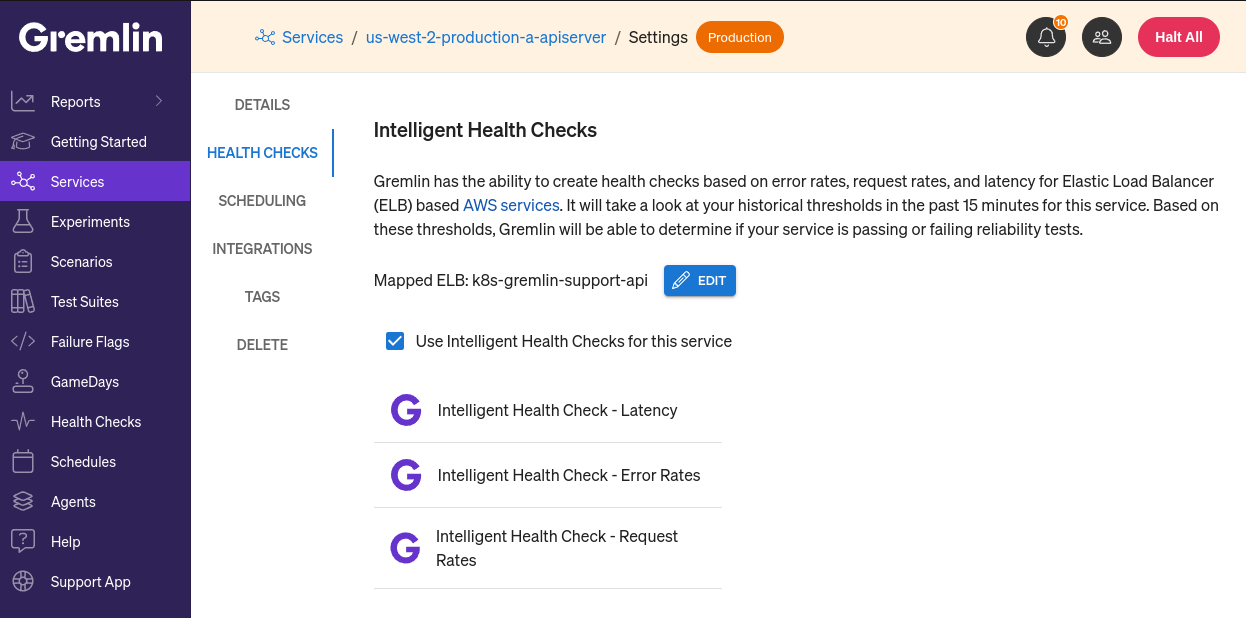
Intelligent Health Checks
Under certain conditions, Gremlin can automatically create Health Checks for you. In this case, you would need to enable Intelligent Health Checks by first navigating to a service, selecting Settings, selecting Health Checks, then clicking the checkbox next to "Use Intelligent Health Checks for this service." Click the checkbox, and Gremlin will generate a set of Health Checks for your service. These can be used instead of—or in tandem with—regular Health Checks. However, they can't be used in Scenarios.
For AWS users, you'll first need to specify which Elastic Load Balancer (ELB) is mapped to this service. The Intelligent Health Checks will query CloudWatch for metrics based on the ELB, so mapping the correct ELB is critical for accurate test results.
Choosing an observability tool
First, you must select the observability tool you wish to use. Click on the Observability Tool drop-down menu to see the list of available options. Click on the link for your tool in the list below for instructions on how to use that tool. Note that the options may change depending on which tool you select, and whether someone else in your Gremlin Team has already authenticated with that tool:
- Amazon CloudWatch
- AppDynamics
- Datadog
- Dynatrace
- Grafana
- Honeycomb
- New Relic
- PagerDuty
- Prometheus
- Custom / Other
Once you've entered authentication details for an observability tool, you can reuse the same authentication for other monitors. After you've followed the instructions for your specific tool, continue with the following instructions.
Accessing observability tools on a private network
By default, Health Checks require your endpoint to be accessible by Gremlin's servers. If your endpoint is hosted internally (i.e., behind a firewall) or you have strict network security policies that prevent exposing your systems to the Internet, you can use the Private Network Integration (PNI) agent. The PNI agent proxies requests to and from the Gremlin API, letting you use Health Checks and other integrations from within a private network. You can enable this by selecting Yes under Is this observability tool behind a firewall or on-prem?
Naming your Health Checks
Enter a name for the Health Check in the Name text box. As a best practice, we recommend naming your Health Checks after their respective monitors or endpoints. This makes it easier to mentally connect a Health Check to a monitor, and to know which Health Checks to use when creating new services in Gremlin.
Once you create a Health Check, it will appear in your team's health check list. All members of your Gremlin team will be able to use these Health Checks in their experiments, Scenarios, or reliability tests. Saved Health Checks also include success evaluation criteria.

Adding tags to a Health Check
Health Checks support the use of tags. This is mainly so you can specify which Private Network Integration (PNI) agent the Health Check is proxied through, if you have them deployed. Tags can also be used to organize Health Checks by adding more detailed information.
To add tags to a Health Check:
Log in to the Gremlin web app and navigate to Configurations > Health Checks.
- Search for the Health Check you wish to edit and click Edit.
- Look for the Tags field beneath the Health Check name, then click Edit.
- Enter the name of the tag you want to add.
- Enter the value(s) that this tag will contain. You can enter a single value or a comma-separated list of values.
- Click Add Tag to add the tag and value(s). You can add more tags by repeating these steps.
- To remove a tag, click the X next to the tag.
- When you’ve added all your desired tags, click Save.
Routing Health Checks to specific PNI agents
If you have multiple Private Network Integration (PNI) agents deployed, you can use tags to determine which agent your Health Checks get routed to. Gremlin will match your Health Check to a PNI agent using the following behavior:
- If both the Health Check and agent share a tag with the same name, Gremlin compares their values. If at least one value matches, Gremlin will route the Health Check through the agent.
- If the Health Check has tags, but an agent doesn’t, the Health Check won’t route to that agent.
- If the Health Check has no tags, Gremlin will fall back to its default behavior of routing it to a random PNI agent.
To learn how to add tags to a PNI agent, see the PNI agent documentation.
Editing Health Checks
To edit a health check, click the Edit button next to the health check you want to modify. You can change its name, URL, success evaluation criteria (for custom tools), and the headers used for authentication.
Copying Health Checks
To copy a health check, click the Clone button next to the health check you want to copy. This opens the health check creation form with the details of the cloned health check already entered. This is useful for quickly adding a new health check without having to re-enter authentication details, custom URLs, or custom headers.
Deleting Health Checks
To delete a health check, click the Delete button next to the health check you want to delete. Click Delete again to confirm.
Health Checks IP ranges
If your firewall is blocking the utilization of the Health Check feature, and you are unable to use Private Network Endpoints, you will need to add the following IP address to your allow list.