Dashboard
Platform

Amazon CloudWatch Health Check

Gremlin offers several ways of creating AWS Health Checks: either adding an Amazon CloudWatch monitor or alarm, or by automatically creating Health Checks using Intelligent Health Checks. In both cases, the first step is to grant Gremlin permission to access your CloudWatch environment if you haven't already done so.

Authenticating Gremlin to AWS

Before creating an AWS Health Check, you’ll need to grant Gremlin permission to read your CloudWatch environment. Gremlin supports two methods of authenticating to AWS: using an IAM role, or using a service account. IAM roles are the recommended method, as they allow you to grant access without sharing your AWS credentials. We’ll explain both methods below, starting with IAM.

Note
Gremlin requires the cloudwatch::DescribeAlarms permission in order to use CloudWatch alarms as Health Checks.

Authenticating Gremlin to AWS using an IAM role

Gremlin can authenticate using IAM in one of two ways:

  • Automatically by deploying a Cloud Formation template. This is the easiest and fastest way to create the necessary permissions.
  • Manually creating IAM policies and roles for Gremlin. This is slower, but gives you greater control over the created resources.

To authenticate Gremlin using an IAM role:

  1. Log into the AWS Console and navigate to IAM (or click on this link). Keep this screen open in a separate browser window or tab.
  2. In a different browser window or tab, open the Health Checks page in the Gremlin web app, click + Health Check, then select AWS from the Integrations drop-down.
  3. Under Authentication, select IAM Role.
  4. Choose the method you want to use to grant Gremlin permissions.
    1. If you want to let Gremlin create the permissions for you using Cloud Formation, select Cloud Formation, then click Launch Stack. Follow the instructions, then continue after the "configure the IAM role manually" section.
  5. If you want to configure the IAM role manually, select Manual.
    1. In the AWS Console, click on Policies in the left-hand navigation menu.
    2. Click Create policy.
    3. Change the Policy editor type from Visual to JSON.
    4. Enter the JSON shown under the "Policy JSON" heading below, then click Next:
    5. Give the policy a name, such as “gremlin-policy”. Review the changes, then click Create policy.
    6. After creating the policy, click Roles in the left-hand navigation menu, then click Create role.
    7. Select Custom trust policy, then enter the text shown under the "Custom trust policy JSON" heading below.
    8. Click Next.
    9. On the Permissions policies screen, search for the policy you just created. Click on the checkbox next to its name to select it, then click Next.
    10. Click Next.
    11. Enter a name for your role, such as “gremlin-role”. Review the changes, then click Create role.
  6. Select your newly created IAM role from the list and look for the ARN field. You’ll see an alphanumeric string starting with “arn:aws:iam”. Copy this string and paste it into the AWS IAM Role ARN field in the Gremlin web app.
  7. In the Gremlin web app, click Save to finish creating your authentication.
Adding permissions to a new IAM policy
Retrieving the IAM role ARN

Policy JSON

JSON

{
    "Version": "2012-10-17",
    "Statement": [
        {
            "Effect": "Allow",
            "Action": [
                "cloudwatch:Describe*",
                "cloudwatch:Get*",
                "cloudwatch:List*",
                "route53:GetAccountLimit",
                "route53:GetChange",
                "route53:GetCheckerIpRanges",
                "route53:GetDNSSEC",
                "route53:GetGeoLocation",
                "route53:GetHealthCheck",
                "route53:GetHealthCheckCount",
                "route53:GetHealthCheckLastFailureReason",
                "route53:GetHealthCheckStatus",
                "route53:GetHostedZone",
                "route53:GetHostedZoneCount",
                "route53:GetHostedZoneLimit",
                "route53:GetQueryLoggingConfig",
                "route53:GetReusableDelegationSet",
                "route53:GetReusableDelegationSetLimit",
                "route53:GetTrafficPolicy",
                "route53:GetTrafficPolicyInstance",
                "route53:GetTrafficPolicyInstanceCount",
                "route53:ListCidrBlocks",
                "route53:ListCidrCollections",
                "route53:ListCidrLocations",
                "route53:ListGeoLocations",
                "route53:ListHealthChecks",
                "route53:ListHostedZones",
                "route53:ListHostedZonesByName",
                "route53:ListHostedZonesByVPC",
                "route53:ListQueryLoggingConfigs",
                "route53:ListResourceRecordSets",
                "route53:ListReusableDelegationSets",
                "route53:ListTagsForResource",
                "route53:ListTagsForResources",
                "route53:ListTrafficPolicies",
                "route53:ListTrafficPolicyInstances",
                "route53:ListTrafficPolicyInstancesByHostedZone",
                "route53:ListTrafficPolicyInstancesByPolicy",
                "route53:ListTrafficPolicyVersions",
                "route53:ListVPCAssociationAuthorizations",
                "route53:TestDNSAnswer",
                "elasticloadbalancing:DescribeListeners",
                "elasticloadbalancing:DescribeLoadBalancerAttributes",
                "elasticloadbalancing:DescribeLoadBalancers",
                "elasticloadbalancing:DescribeRules",
                "elasticloadbalancing:DescribeSSLPolicies",
                "elasticloadbalancing:DescribeTags",
                "elasticloadbalancing:DescribeTargetGroupAttributes",
                "elasticloadbalancing:DescribeTargetGroups",
                "elasticloadbalancing:DescribeTargetHealth",
                "elasticloadbalancing:DescribeLoadBalancerPolicies",
                "elasticloadbalancing:DescribeLoadBalancerPolicyTypes",
                "elasticloadbalancing:DescribeInstanceHealth"
            ],
            "Resource": "*"
        }
    ]
}

Custom trust policy JSON

JSON

{
    "Version": "2012-10-17",
    "Statement": [
        {
            "Effect": "Allow",
            "Principal": {
                "AWS": [
                    "arn:aws:iam::157733958145:role/GremlinReliabilityAnalyzer"
                ]
            },
            "Condition": {
                "StringEquals": {
                    "sts:ExternalId": "386d63a1-d0b5-5686-a7df-a20694ba0e6b"
                }
            },
            "Action": "sts:AssumeRole"
        }
    ]
}

Authenticating Gremlin to AWS using a Service Account

To authenticate Gremlin using a service account:

  1. Open the AWS Console and log into your AWS account.
  2. Navigate to Identity and Access Management (IAM), or click this link.
  3. Select Users from the left-hand navigation menu.
  4. Select the user you want to use as the service account, or create a new user. This user must have access to read CloudWatch alarms.
  5. On the user’s account page, select the Security credentials tab.
  6. Under Access keys, click Create access key.
    1. Select Third-party service as the use case.
    2. Read the Confirmation, then check the box and click Next.
    3. Enter a Description for the key, such as “Gremlin service account”.
    4. Click Create access key. Keep this screen open.
  7. In the Gremlin web app, enter your AWS account ID in the AWS Account ID field. You can find this by clicking on your organization name in the top-right corner of the AWS console.
  8. Copy the value from the Access key field in AWS to the AWS Access Key ID field in Gremlin.
  9. Copy the value from the Secret access key field in AWS to the AWS Secret Access Key field in Gremlin.
  10. Click Save to validate and save your new AWS authentication.

Using Intelligent Health Checks

For AWS services that are mapped to an Elastic Load Balancer (ELB), Gremlin can automatically create Health Checks for you. To enable Intelligent Health Checks:

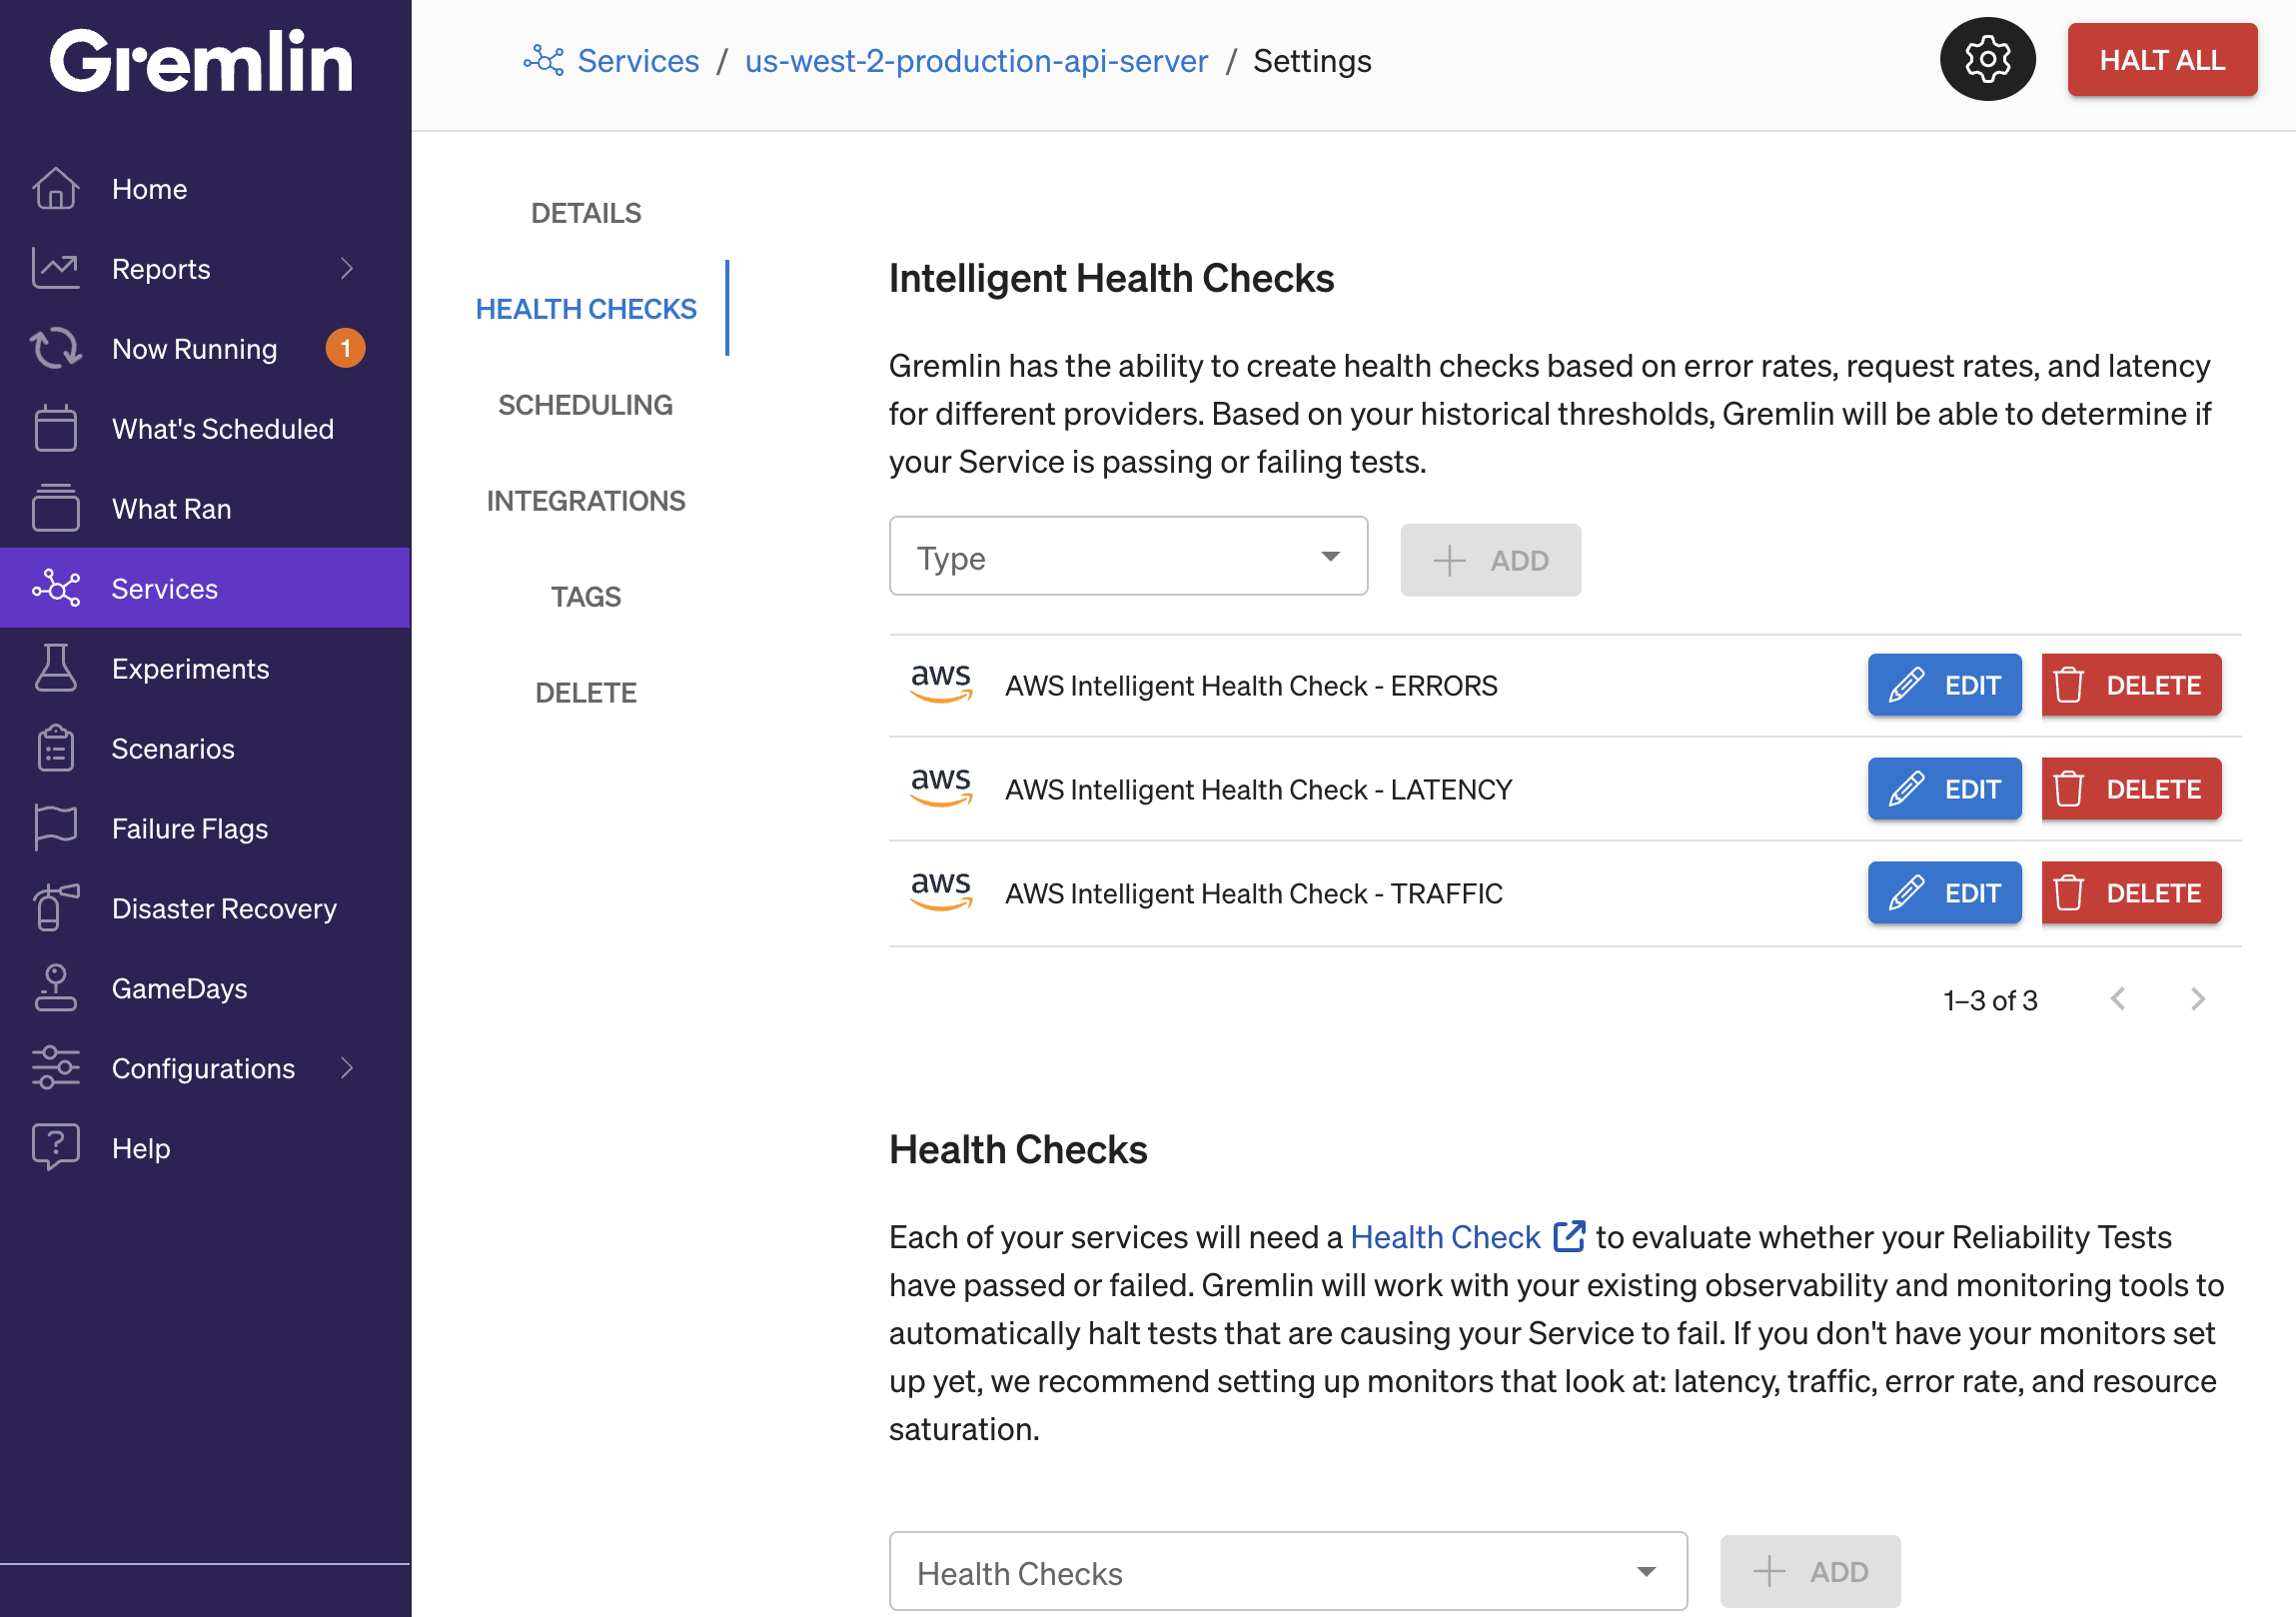
  1. Open the service's Settings page and navigate to Health Checks.
  2. Double-check the Mapped ELB field to ensure the correct ELB is mapped to this service. Using the wrong ELB will result in inaccurate testing scores.
  3. Click on the checkbox labeled Use Intelligent Health Checks for this service. Gremlin will generate a set of Health Checks for your service.

These Health Checks can be used instead of—or in tandem with—regular Health Checks, but they can't be used in Scenarios.

Enabling Intelligent Health Checks in Gremlin.

Adding an AWS CloudWatch alarm as a Health Check

Instead of using Intelligent Health Checks, you can also use any CloudWatch alarm as a Health Check. To add a CloudWatch alarm as a Health Check:

  1. Open the Gremlin web app and navigate to Health Checks, or click this link.
  2. Click + Health Check.
  3. From the Observability Tool drop-down, select AWS. If you’ve already authenticated Gremlin to your AWS account, select your account ID from the AWS Account ID box. Otherwise, follow the instructions above. Click Next.
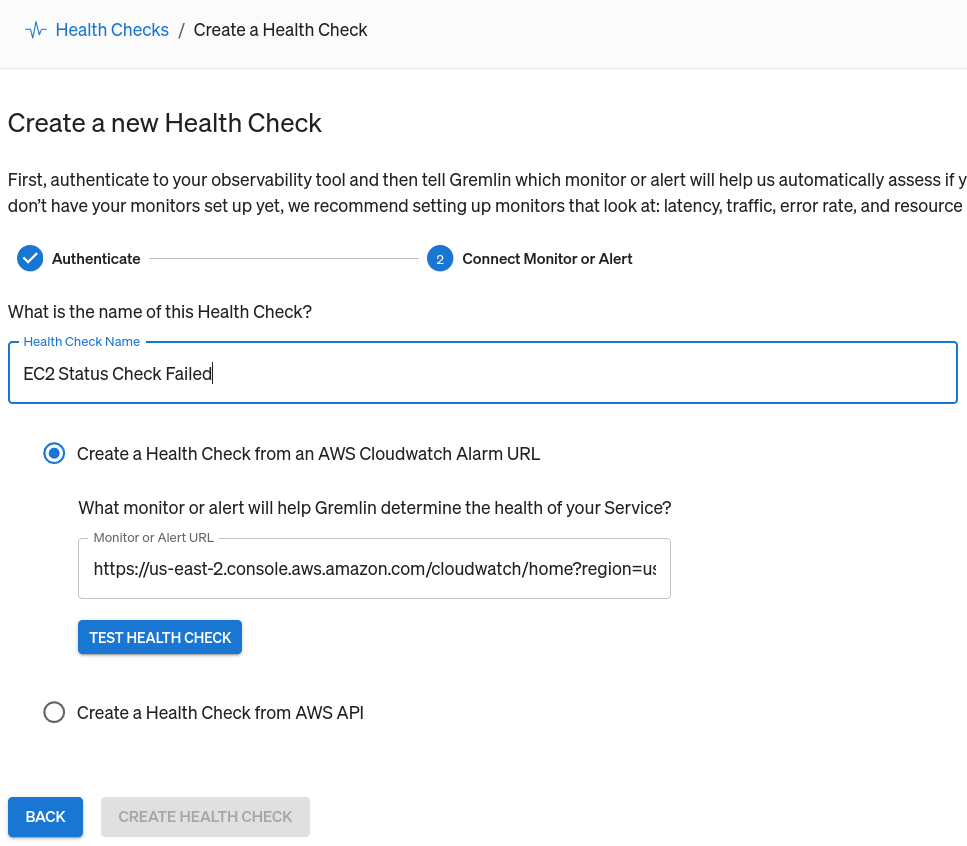
  4. Enter a Name for the Health Check. We recommend using the same name that you use in CloudWatch.
  5. Select Create a Health Check from an AWS CloudWatch Alarm URL.
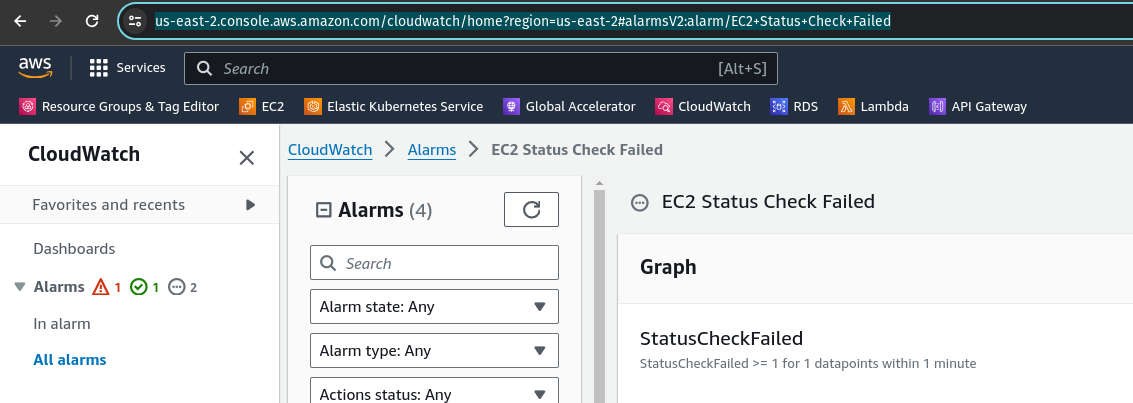
  6. Open the alarm you wish to use in the AWS Console, then copy its URL from your browser window.
  7. Go back to the Gremlin web app and paste the URL into the Monitor or Alert URL box.
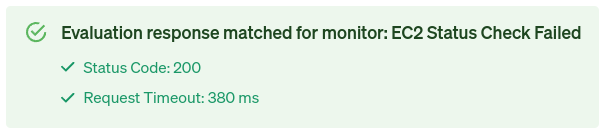
  8. Click Test Health Check to confirm that Gremlin can access your monitor, and that it’s reporting back as healthy.
  9. Click Create Health Check.

Alternatively, you can define custom success criteria for your Health Check by using the AWS API directly.

  1. After entering the name of your Health Check, select Create a Health Check from AWS API.
  2. Copy and paste the URL of your CloudWatch alert into the Monitor or Alert URL box.
  3. Click Test Connection to confirm that Gremlin can access your monitor. Gremlin will also show the HTTP response code and the JSON body of the response.
  4. Set the Success Evaluation Criteria. This is the criteria Gremlin will use to determine whether the alert is healthy, or if it’s in an alarm state. By default, Gremlin checks the value of `.DescribeAlarmsResponse.DescribeAlarmsResult.MetricAlarms[0].StateValue` to see if it equals OK. You can use any field here and compare it to any value. You can also specify the HTTP status code to look for, and set a maximum response timeout.
  5. Click Create Health Check.
Retrieving the URL for a CloudWatch Health Check
Creating a new CloudWatch Health Check in Gremlin
Confirming the validity of a CloudWatch alarm

No items found.
Previous
Next
Previous
This is some text inside of a div block.
Compatibility
Installing the Gremlin Agent
Authenticating the Gremlin Agent
Configuring the Gremlin Agent
Managing the Gremlin Agent
Integrations
Health Checks
Notifications
Command Line Interface
Updating Gremlin
Reliability Management (RM) Quick Start Guide
Services and Dependencies
Detected Risks
Reliability Tests
Reliability Score
Targets
Experiments
Scenarios
GameDays
Failure Flags Overview
Deploying Failure Flags on AWS Lambda
Deploying Failure Flags on AWS ECS
Deploying Failure Flags on Kubernetes
Classes, methods, & attributes
API Keys
Examples
Container security
General
Linux
Windows
Chao
Helm
Glossary
Additional Configuration for Helm
Amazon CloudWatch Health Check
AppDynamics Health Check
Blackhole Experiment
CPU Experiment
Certificate Expiry
Custom Health Check
Custom Load Generator
DNS Experiment
Datadog Health Check
Disk Experiment
Dynatrace Health Check
Grafana Cloud Health Check
Grafana Cloud K6
IO Experiment
Install Gremlin on Kubernetes manually
Install Gremlin on OpenShift 4
Installing Gremlin on AWS - Configuring your VPC
Installing Gremlin on Kubernetes with Helm
Installing Gremlin on Windows
Installing Gremlin on a virtual machine
Installing the Failure Flags SDK
Jira
Latency Experiment
Memory Experiment
Network Tags
New Relic Health Check
Fault Injection Overview
Getting Started Overview
Reliability Management Overview
Resources Overview
Security Overview
Packet Loss Attack
PagerDuty Health Check
Preview: Gremlin in Kubernetes Restricted Networks
Private Network Integration Agent
Process Collection
Process Killer Experiment
Prometheus Health Check
Configuring Role Based Access Control (RBAC)
Running Failure Flags experiments
Scheduling Scenarios
Shared Scenarios
Shutdown Experiment
Slack
Time Travel Experiment
Troubleshooting Gremlin on OpenShift
User Authentication via SAML and Okta
Managing Users and Teams
Webhooks
Integration Agent for Linux
Test Suites
Restricting Testing Times
Reports
Process Exhaustion Experiment
Enabling DNS collection
Authenticating Users with Microsoft Entra ID (Azure Active Directory) via SAML
AWS Quick Start Guide
Installing Gremlin on Amazon ECS
Quick Start Guides Overview
Platform Overview
API Reference Overview
Release Notes Overview