


Reliability Management (RM) Quick Start Guide
Supported platforms:
Welcome to the Gremlin Reliability Management (RM) quick start guide! This guide will walk you through installing Gremlin on a remote Linux server, setting up your first service, running tests, and getting your first reliability score.
Overview
Gremlin RM lets you run tests on services within your environment. It tests several key reliability behaviors of each service including its scalability, redundancy, and ability to tolerate failed or slow dependencies. Gremlin then generates and assigns a reliability score to the service based on the outcome of these tests.
Gremlin defines a service as a process running on one or more hosts, containers, or Kubernetes resources. For example, a Java application deployed across three hosts is a service. A Kubernetes Deployment or ReplicaSet is also a service. This design makes it easier to test distributed applications and is more closely aligned with how teams build, test, and deploy applications.
Before you begin, you should identify a service that you want to use for testing. Note that Gremlin won't make any permanent changes to how this service is configured or operates in your environment. Nonetheless, you should choose a service that can tolerate short-term failures without causing issues for you, your team, or your organization.
This guide will walk you through the following steps:
- Downloading the Gremlin Agent configuration file from Gremlin.
- Installing the Gremlin Agent onto the systems hosting your service.
- Defining your service in Gremlin.
- Adding health checks to your service.
- Running reliability tests and generating your reliability score.
Prerequisites
Before you begin, make sure you have:
- A Linux host available to install the Gremlin Agent onto.
- At least one service running on the host (e.g., an application) that you can use during this guide.
- Access to the host using a terminal-based administration tool, such as SSH.
- A Gremlin account with access to Gremlin RM (log into an existing account or sign up for a free trial).
Step 1: Get your Agent configuration file
Before you can connect a Gremlin Agent to your Gremlin account, you'll need to download a client configuration file. This is a YAML file containing everything you need to authenticate the Gremlin Agent with your Gremlin team.
To download the configuration file:
- Log into the Gremlin web app at app.gremlin.com.
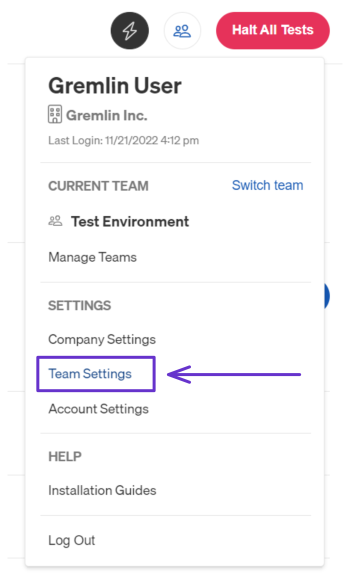
- Access your team settings by clicking on the user icon in the top-right corner and selecting Team Settings.
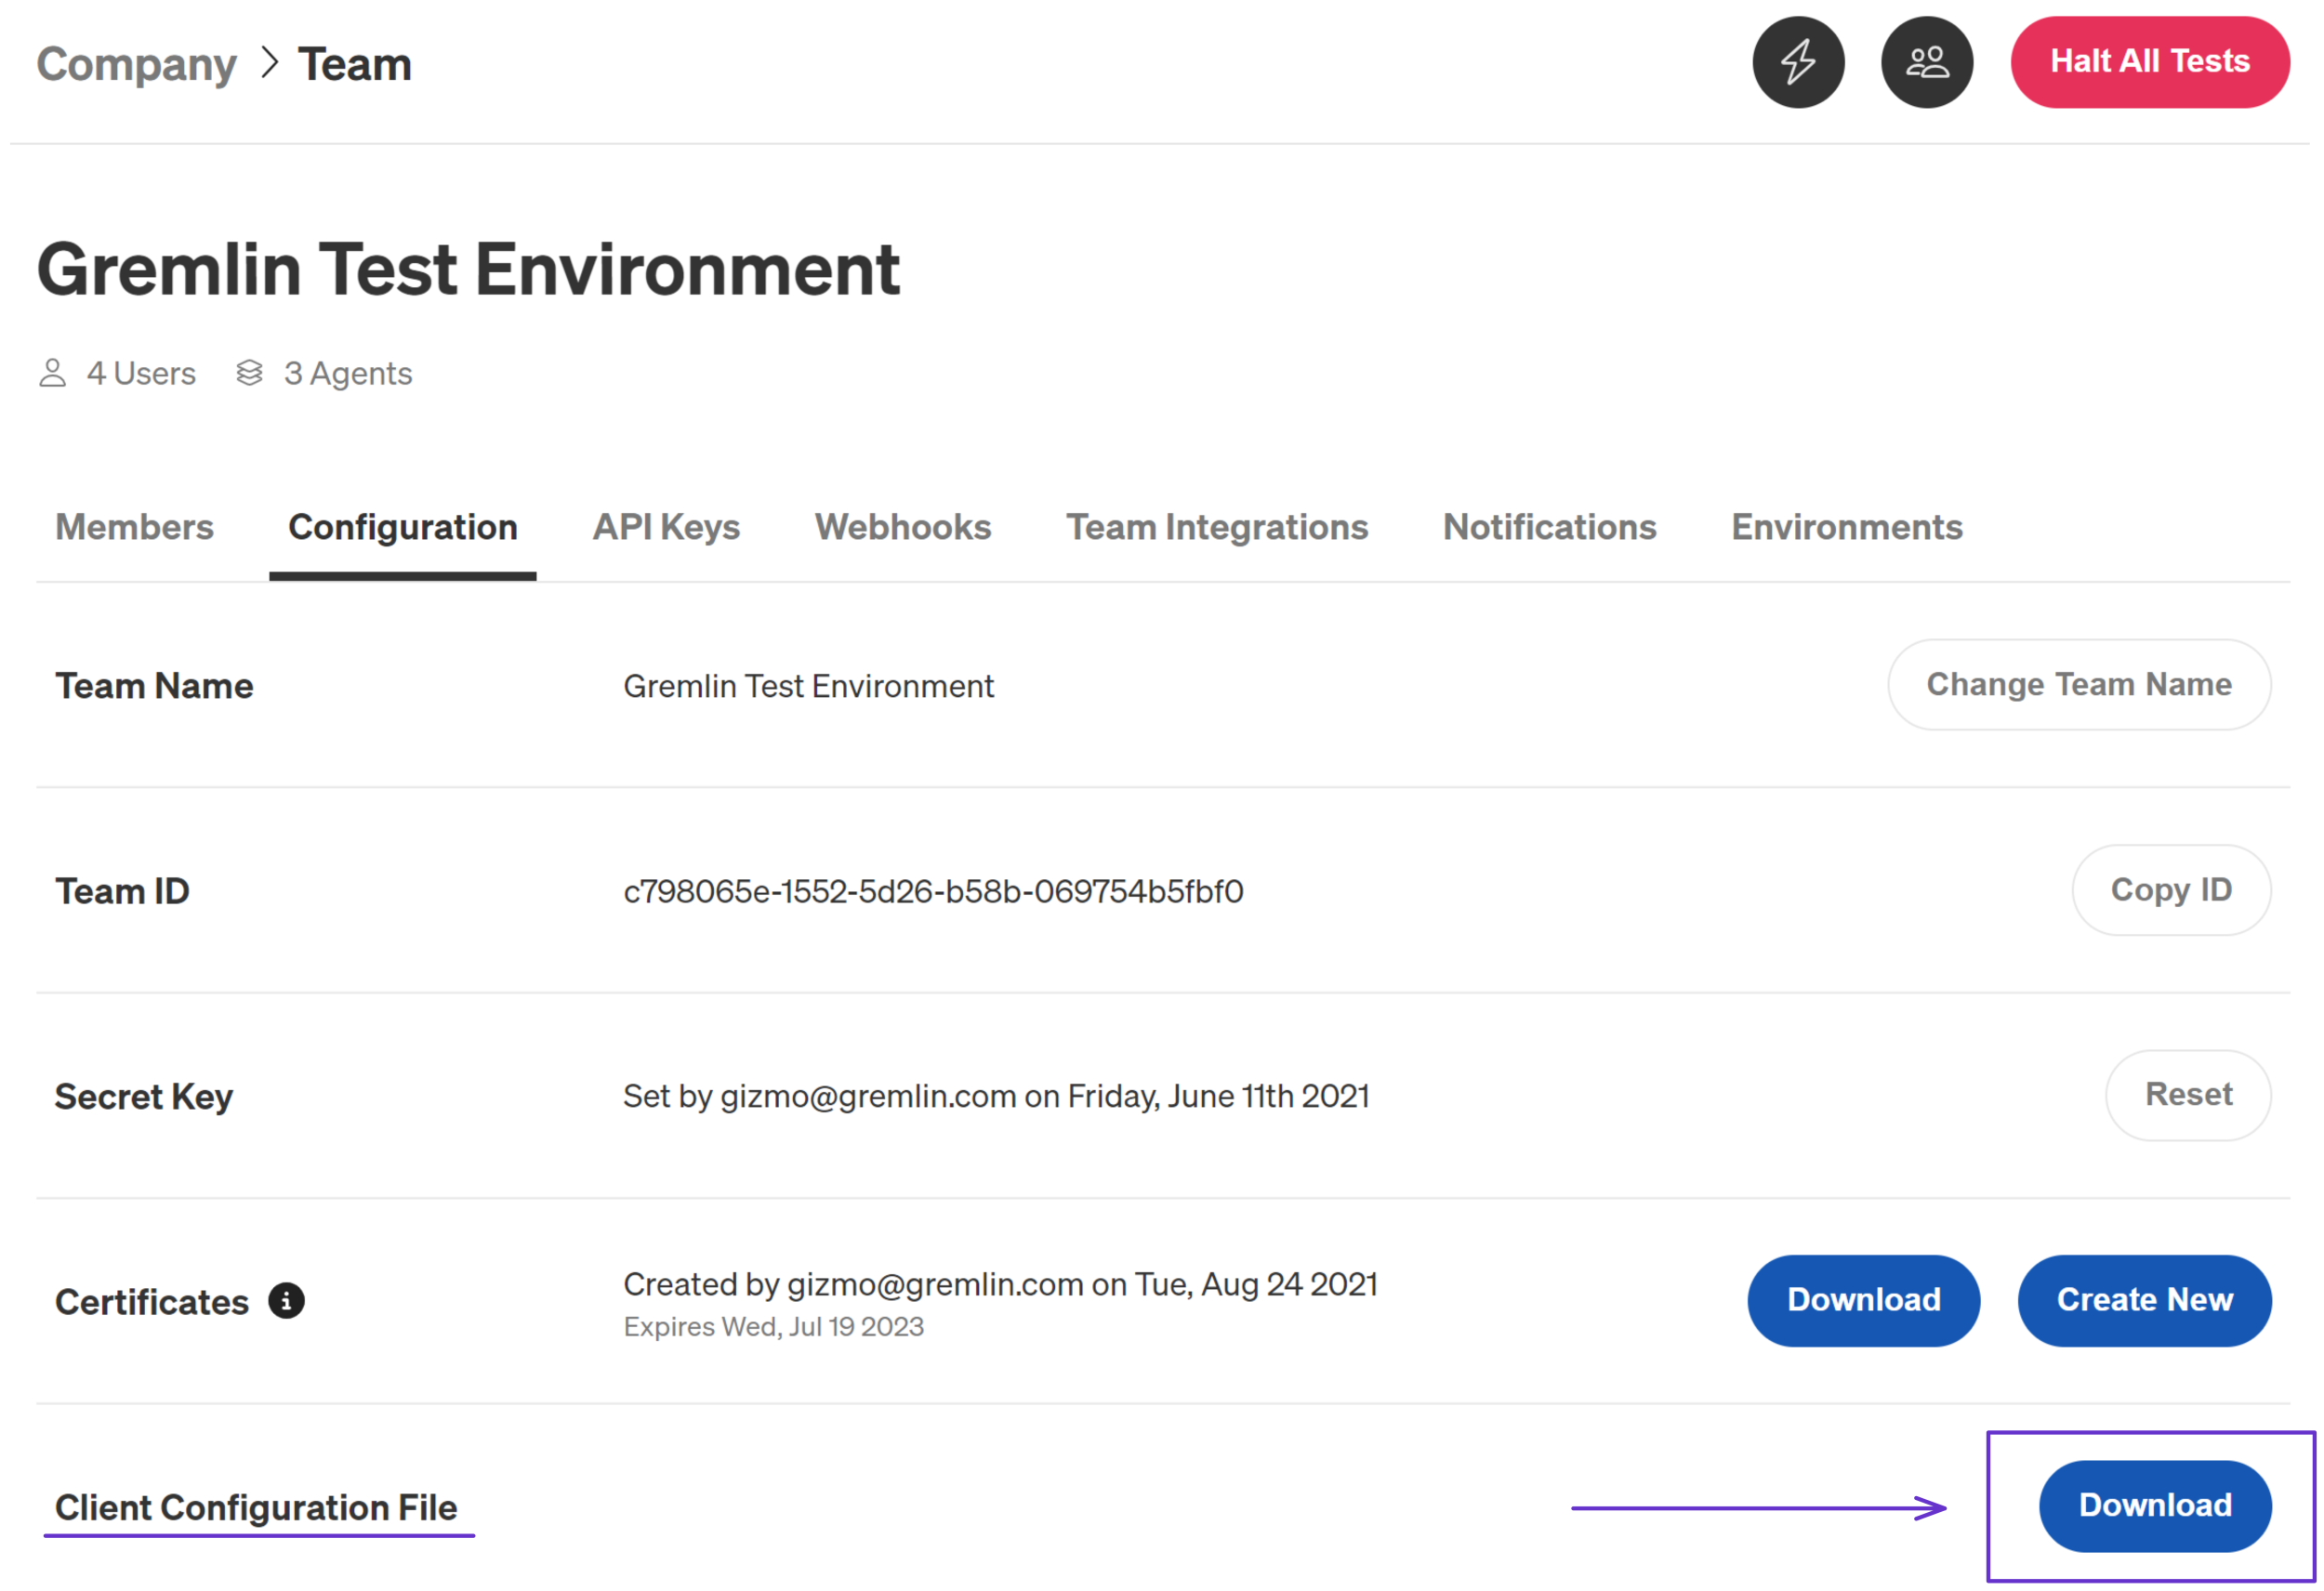
- Click on the Configuration tab.
- Next to Client Configuration File, click Download. You'll be prompted to download a config.yaml file. Save this file to your local device, as you'll need it for step 2. Note: Keep this file secret, as anyone with access to it can add new hosts, containers, or Kubernetes clusters to your Gremlin team.
Step 2: Install the Gremlin Agent
The Gremlin Agent is an executable binary you install on a host, container runtime, or Kubernetes cluster. It performs several key functions:
- Orchestrating tests on your systems.
- Detecting metadata such as availability zone and region (for cloud systems), operating system, and Agent version.
- Detecting processes running on the host (for dependency testing).
For this guide, we'll assume a Debian-based environment, such as Ubuntu. You can find installation instructions for other Linux distributions and platforms using this link.
Run the following commands on the host where you want to install the Gremlin Agent (e.g. using SSH):
Next, copy the <span class="code-class-custom">config.yaml</span> file downloaded in step 1 to the <span class="code-class-custom">/etc/gremlin/</span> directory on the host where you installed the agent. The easiest way to do this using SSH is by using the <span class="code-class-custom">scp</span> command (make sure to replace <span class="code-class-custom">user@remote-host</span> with your actual SSH credentials):
Alternatively, you can use a text editor like nano, vim, or emacs to create a blank <span class="code-class-custom">/etc/gremlin/config.yaml</span> file on the remote host, then copy and paste the original config file's contents into the new file.
Once you've updated the contents of <span class="code-class-custom">/etc/gremlin/config.yaml</span>, go back to your SSH session on the remote host and restart the <span class="code-class-custom">gremlind</span> service:
To confirm that the Agent is installed correctly, run the following command on the remote host:
If the Agent authenticated successfully, the first four lines will look like this:
If not, you'll see this:
If you're having trouble authenticating, check our Authentication FAQ for possible causes and solutions.
Step 3: Define your service
The next step is to define your service in Gremlin. The goal of defining a service is simply to tell Gremlin how to identify your service in your environment when running reliability tests. This includes which infrastructure resources to target, and which processes to use to identify dependencies.
As explained at the start of the guide, Gremlin defines a service as a process running on one or more hosts, containers, or Kubernetes resources. For example, a Java application running on three hosts simultaneously can be considered one service. A DaemonSet running on a dozen Kubernetes nodes can also be considered one service, etc.
To add a service:
- Go to app.gremlin.com/services, or open the Gremlin web app and click on Services in the left-hand nav.
- Click the + Service button in the top-right corner of the page.
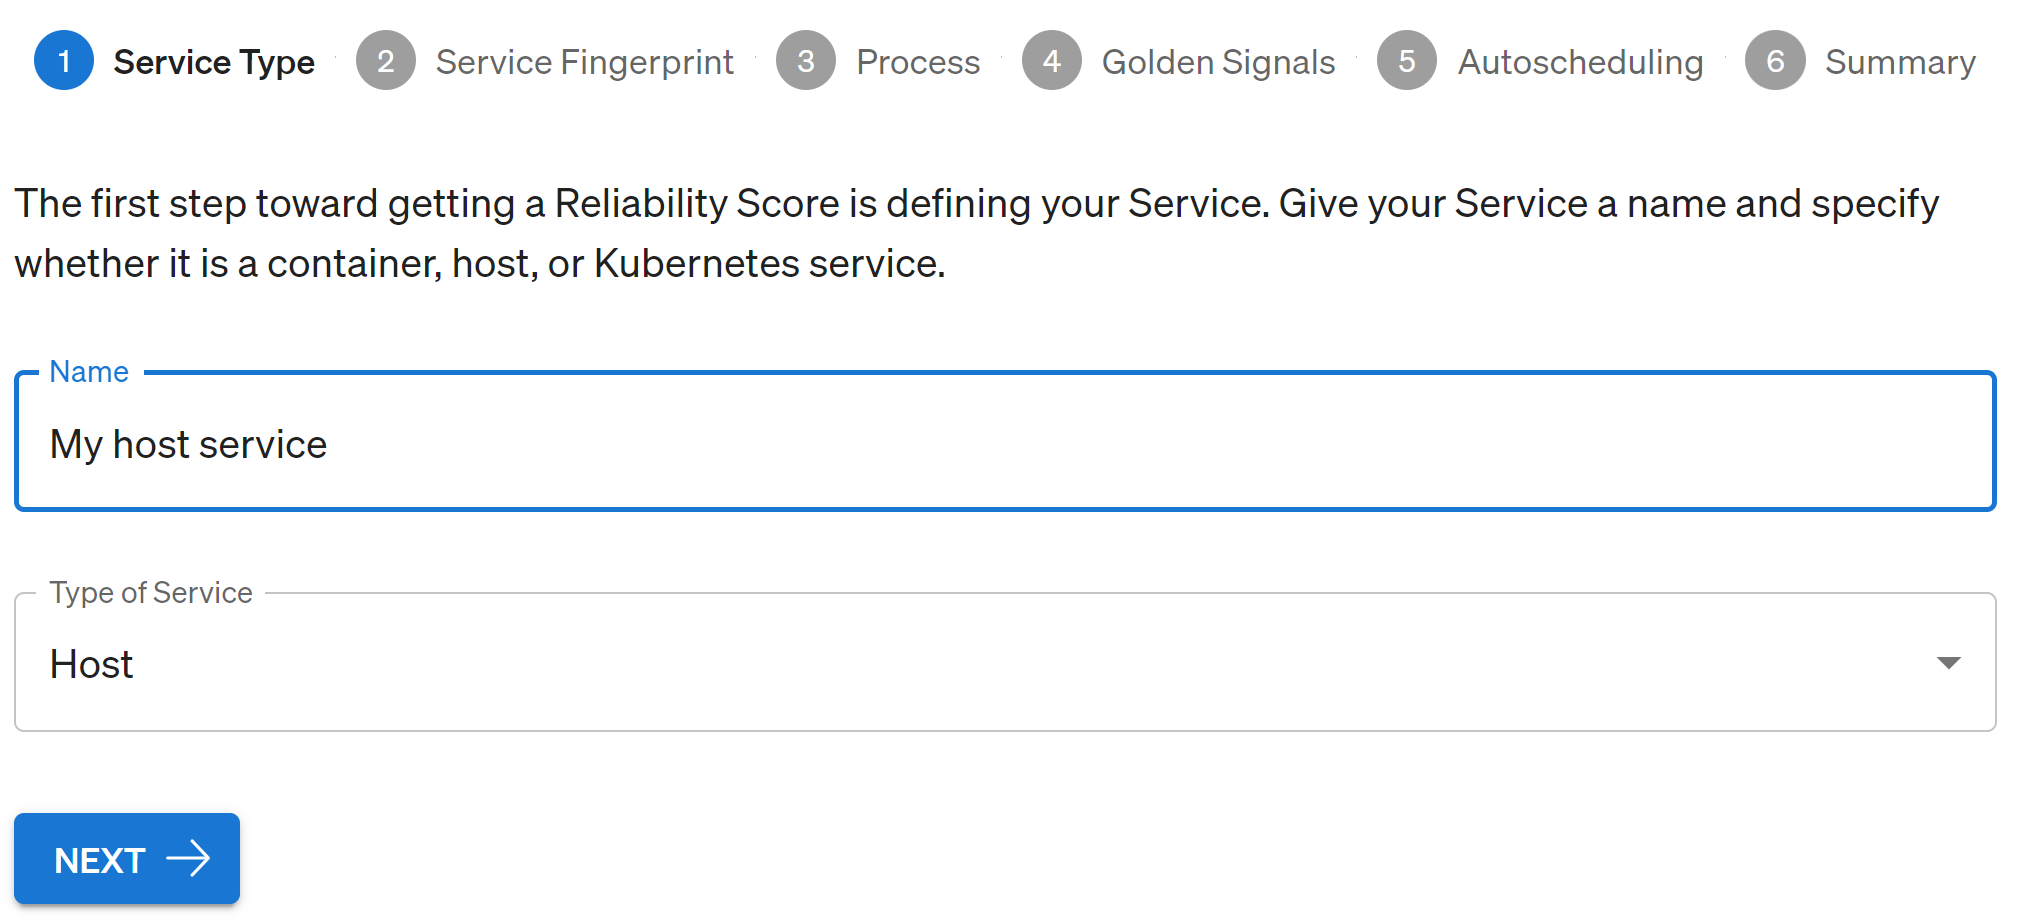
- Enter a Name for the service and select the type of service. The type of service indicates whether the service is an application running directly on a host, a container (Docker, containerd, or CRI-O), or a resource running in a Kubernetes cluster (a Deployment, DaemonSet, StatefulSet, or standalone Pod). When you're ready, click Next → to continue.
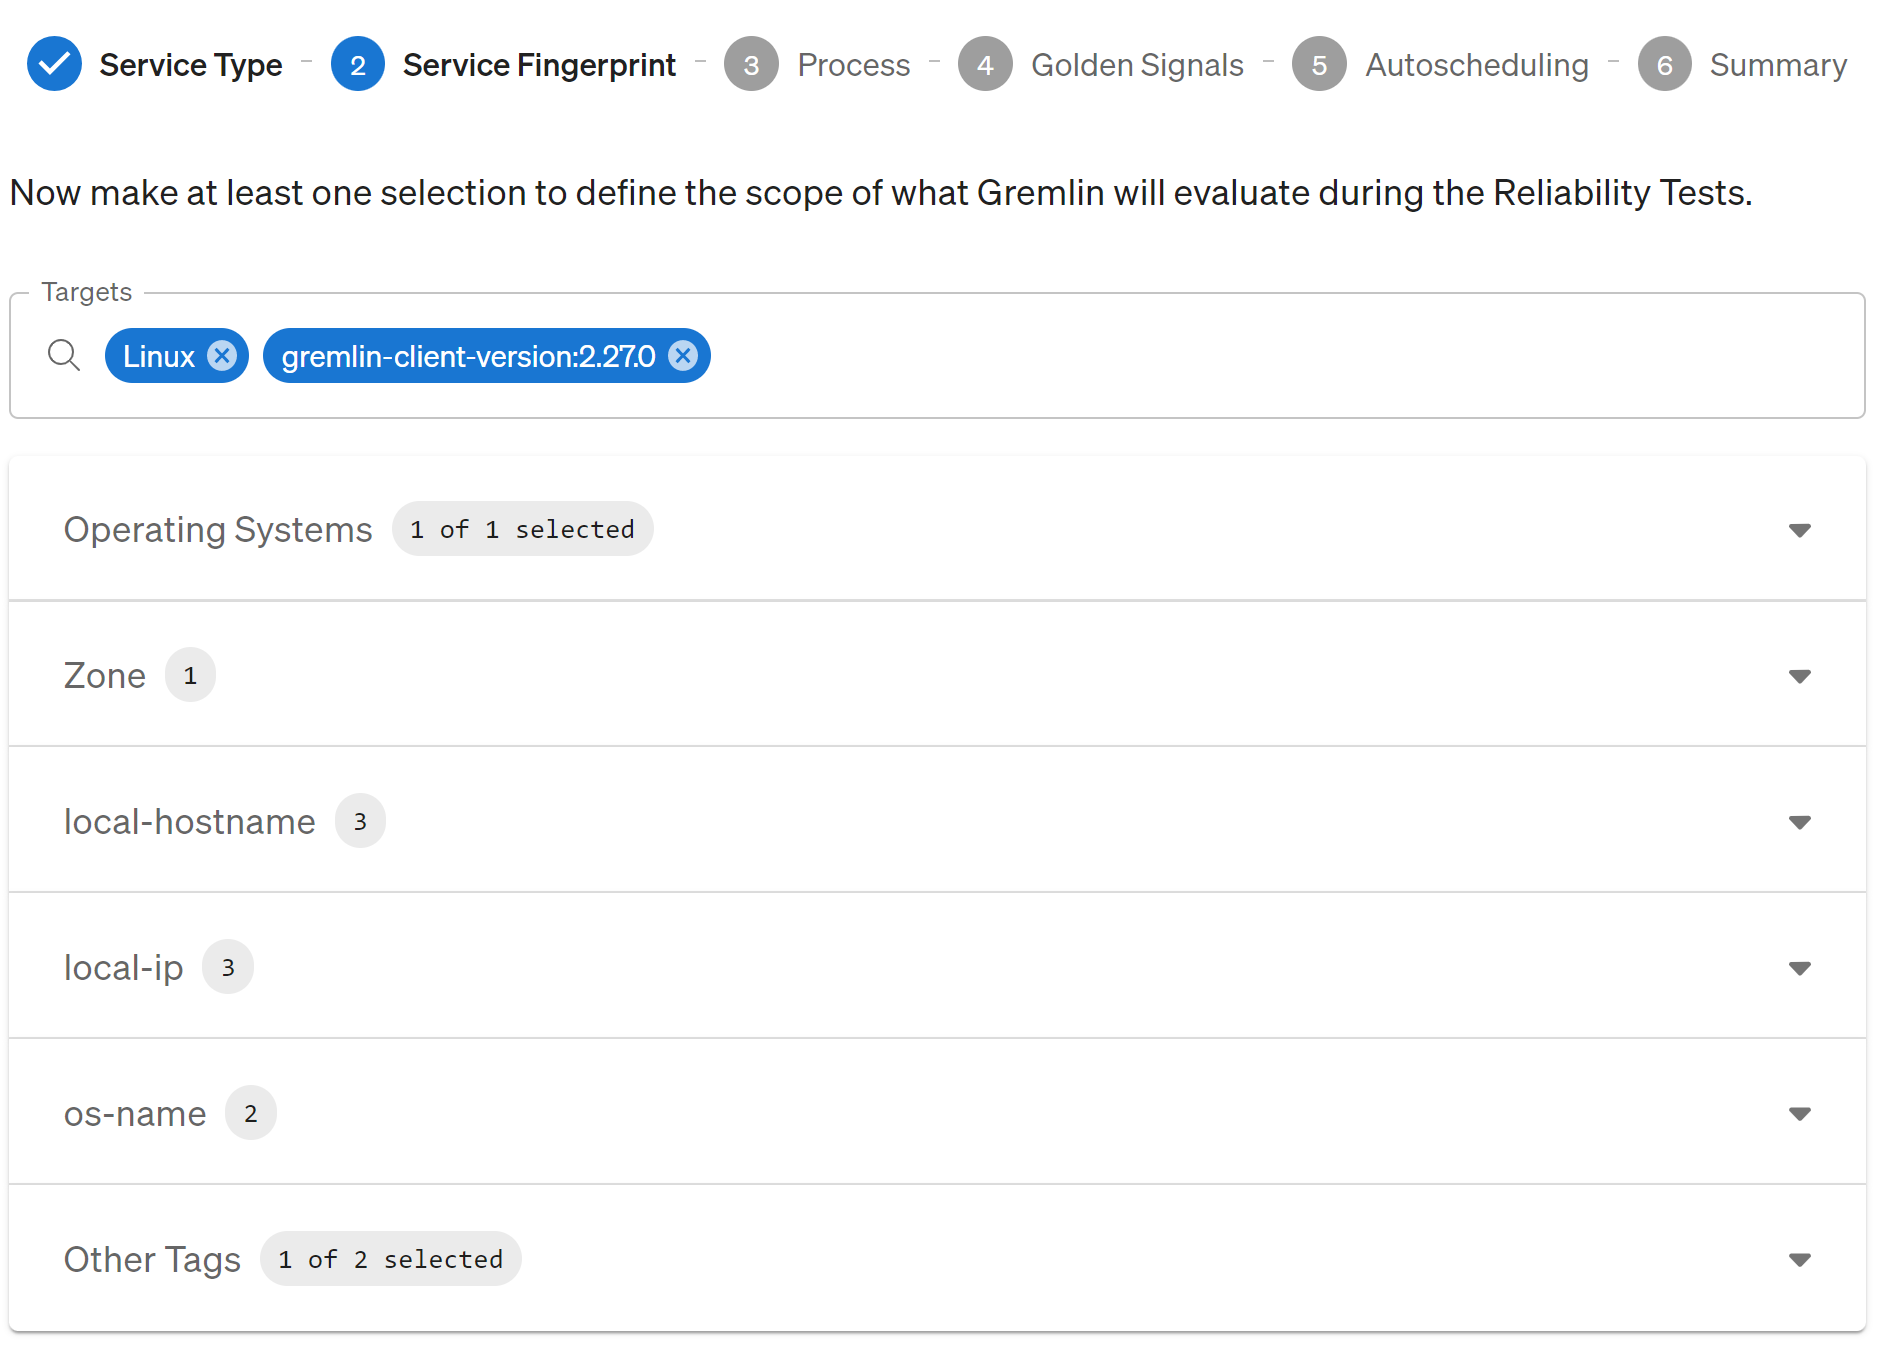
- Select the system(s) that the service is running on. The options vary depending on the type of service selected. If you selected hosts, this screen will let you search, filter, and select individual hosts. If you selected containers, this screen will let you search for individual containers. And if you selected Kubernetes, this screen will show Kubernetes resources. You can use the search box to find a specific resource by name, or search by metadata including hostname, operating system, availability zone, Gremlin Agent version, container name, or a custom tag. When you're ready, click Next → to continue.
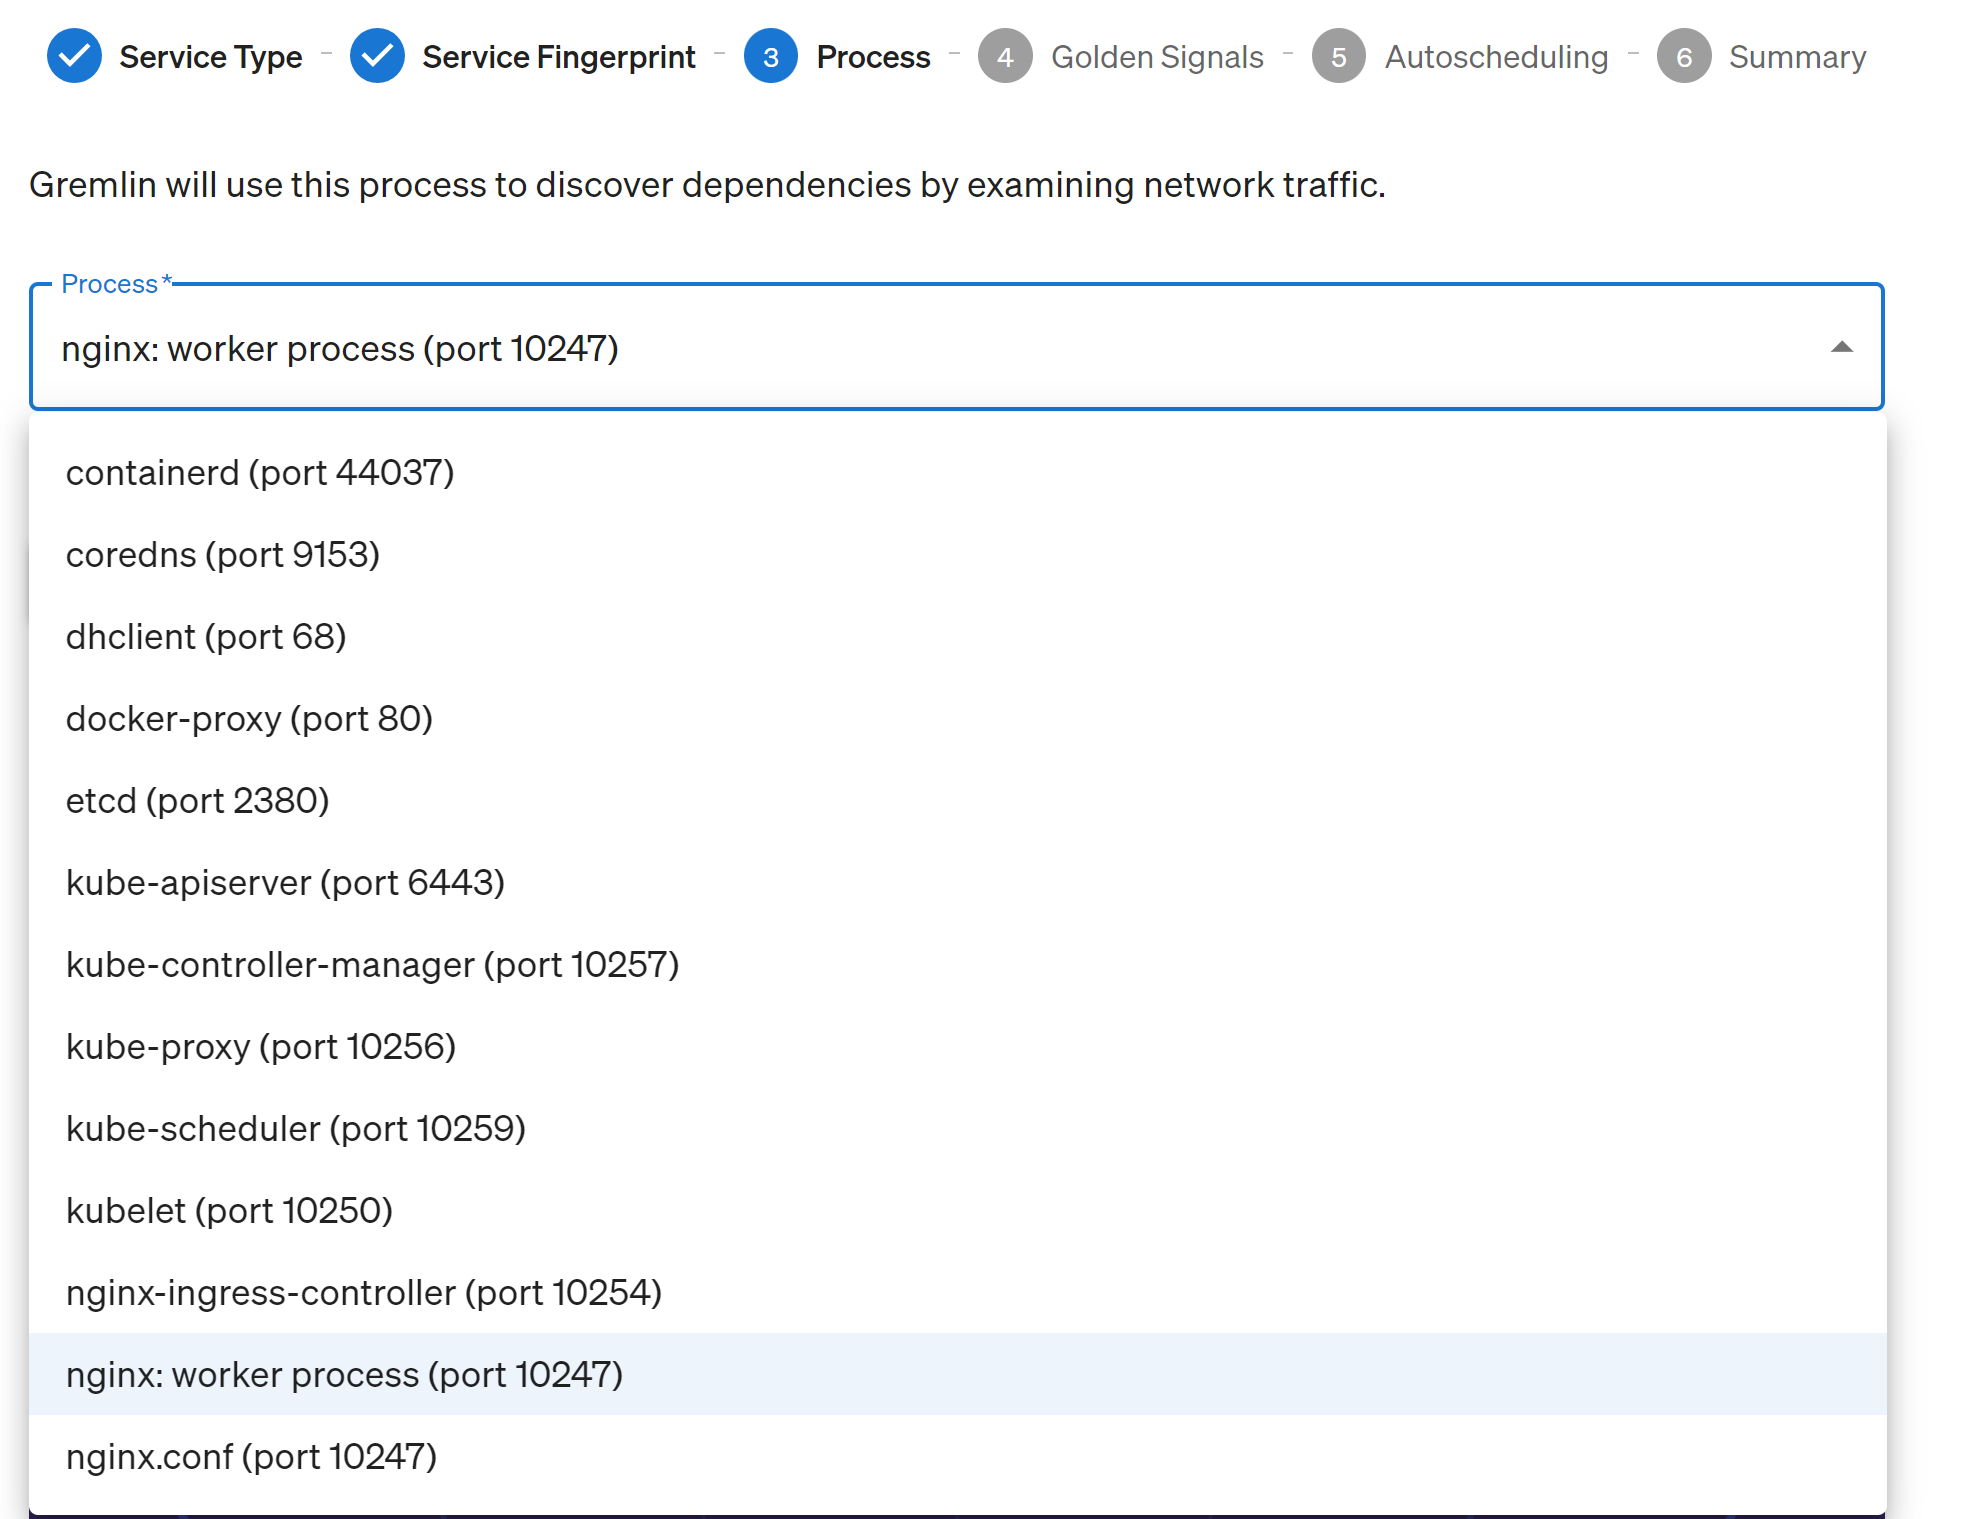
- Select the name of the process that corresponds to your service. Gremlin uses this data to fine-tune reliability test parameters and detect network dependencies for dependency reliability tests. If only one process is detected running on this resource, Gremlin selects it automatically. When you're ready, click Next → to continue.
- Click Create Service.
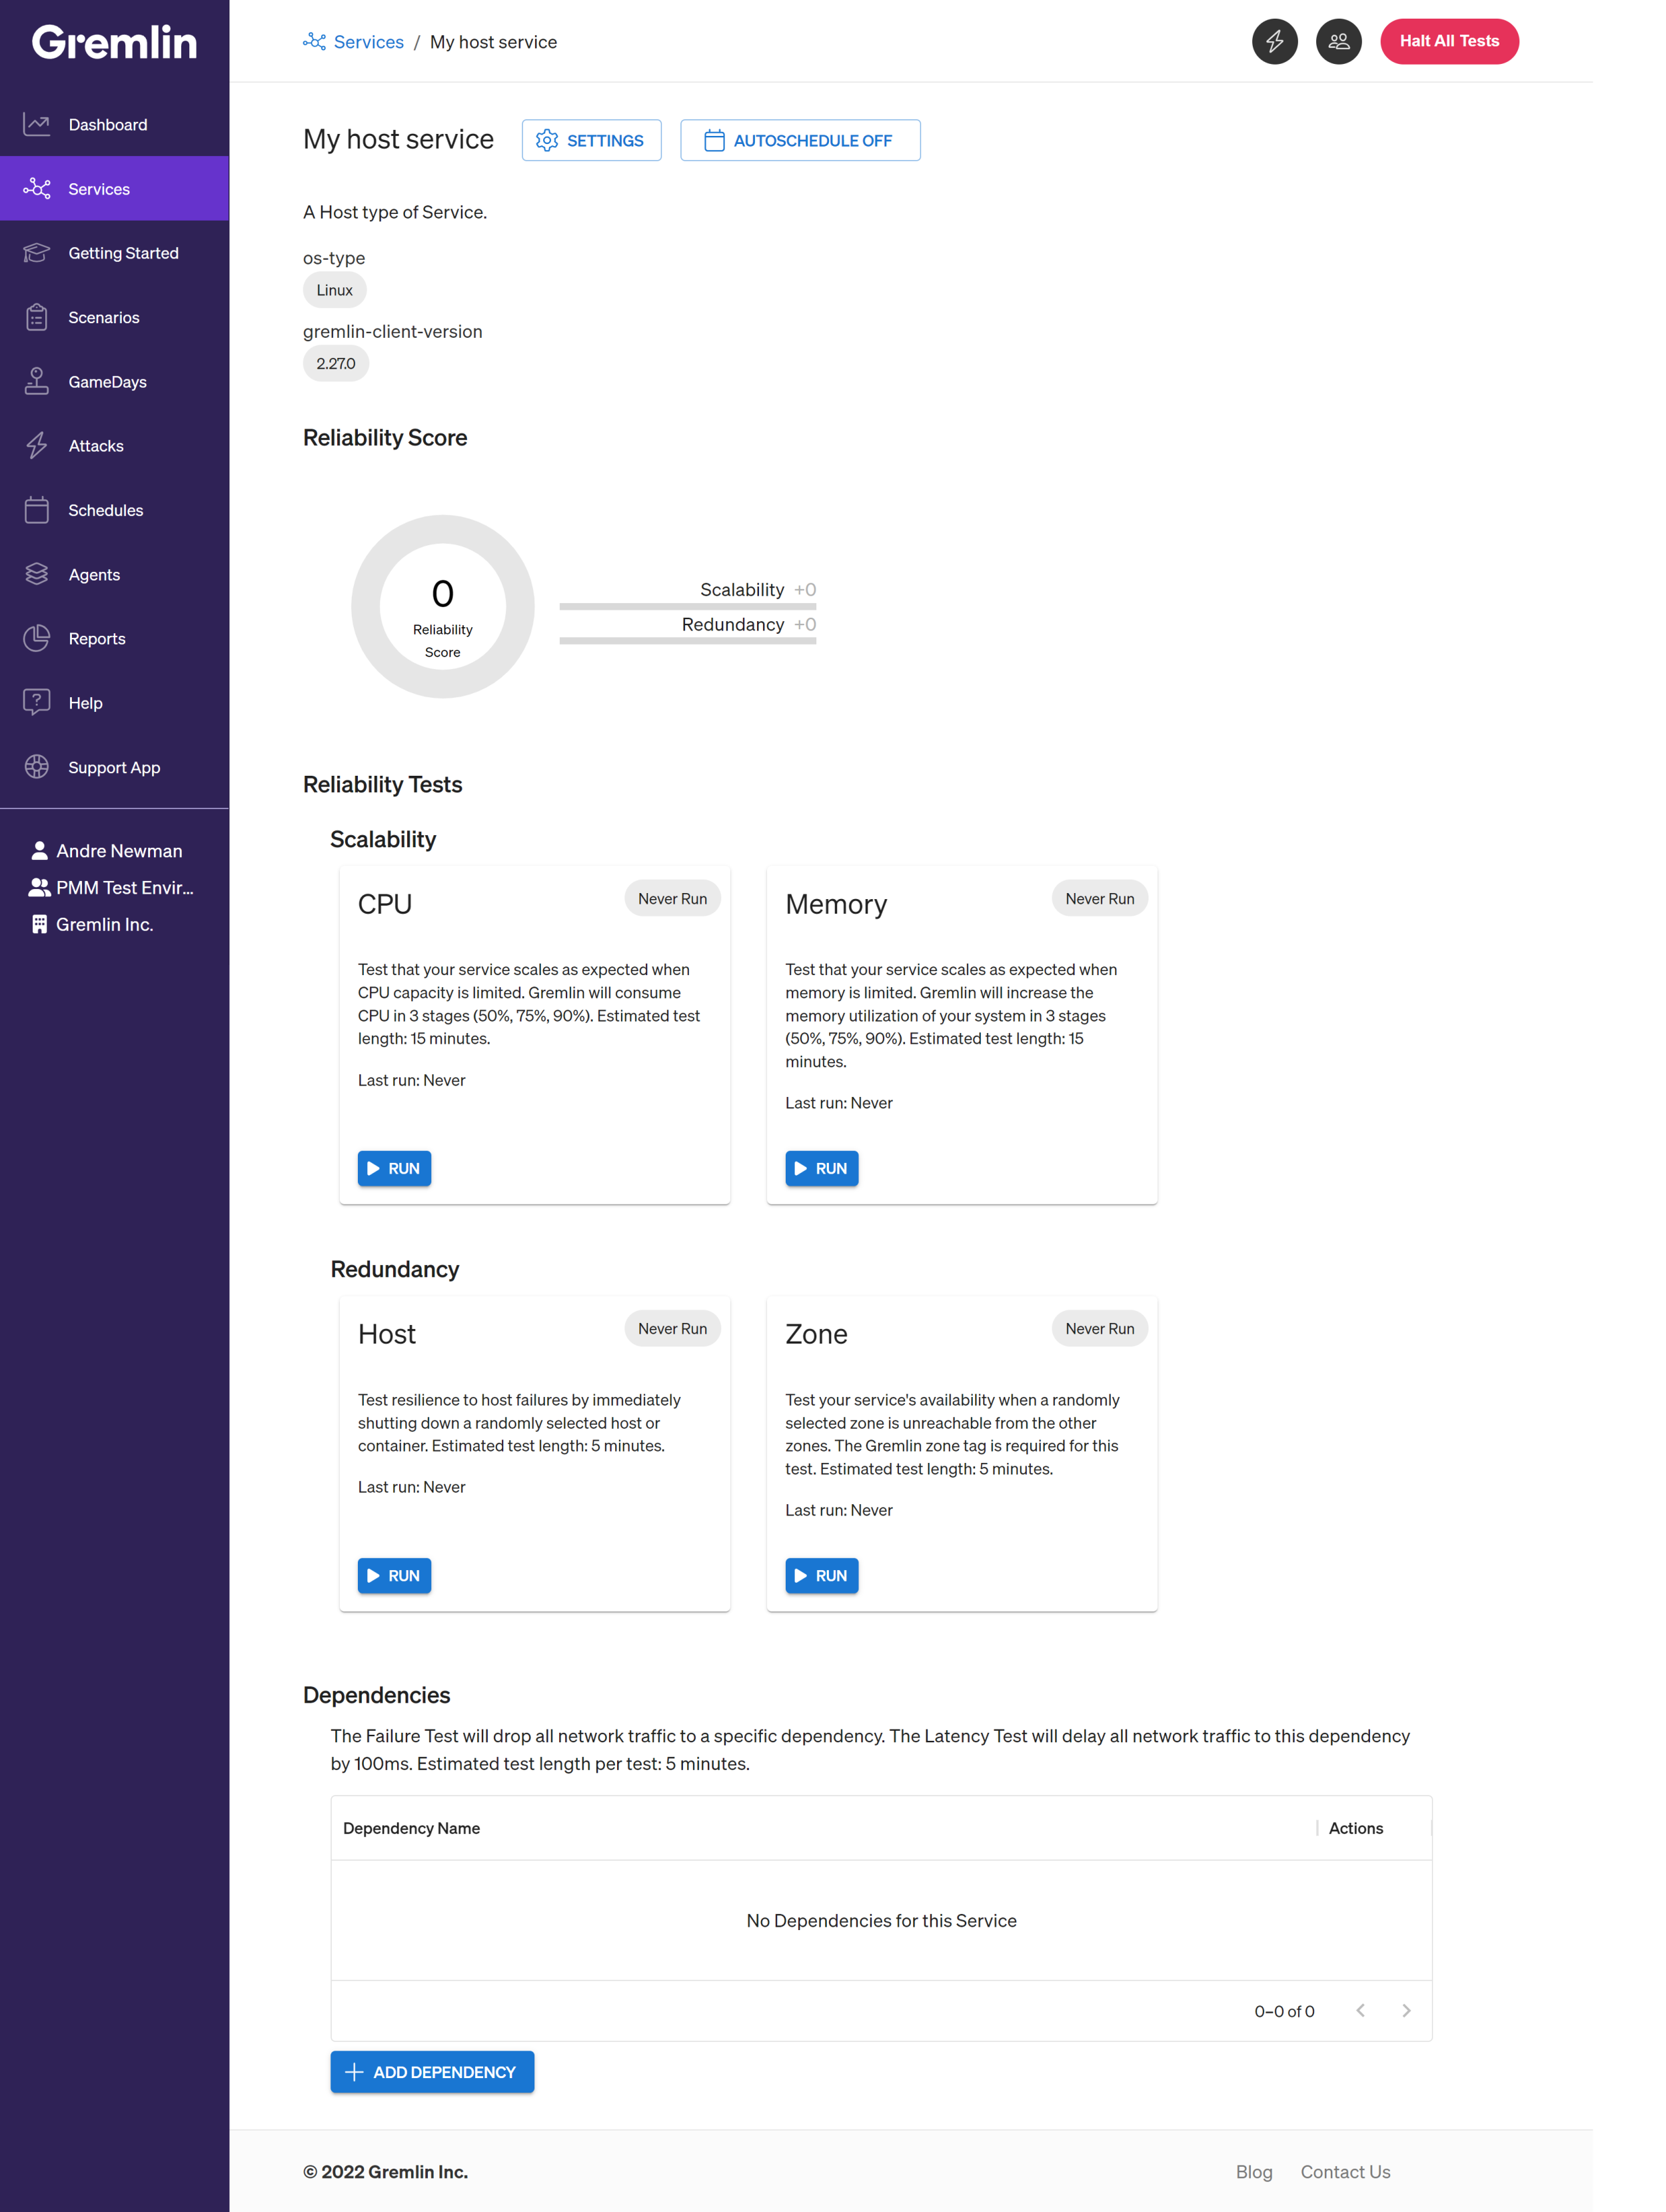
If your new service is successfully created, you'll see its overview page. Here, you can review the service's details, change its settings, see its reliability score, and run reliability tests. If dependencies were detected, they'll appear in a list in the Dependencies section.
Step 4: Add your service's health checks
Gremlin integrates with your observability tool to track the health of your services during tests. While a test runs, Gremlin continuously checks your monitors to ensure they're still reporting as healthy. These are called Health Checks. If a monitor reports as unhealthy or fails to report within a certain time frame, Gremlin immediately halts the test, returns your systems to normal operation, and marks the test as failed.
While you can create a service without adding Health Checks, Gremlin won't let you run reliability tests until you've added at least one Health Check.
Gremlin natively supports the following observability tools:
Which monitors should you use?
We recommend using monitors that measure the key metrics of your service. If you don't yet have comprehensive monitoring in place, we strongly recommend starting with the four golden signals: latency, traffic, error rate, and resource saturation. We recommend these as a best practice according to the Google Site Reliability Engineering book. Please see your observability tool's documentation if you need help setting up monitors. Here are links for the tools we support:
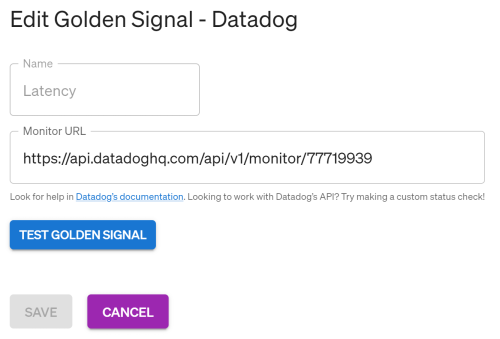
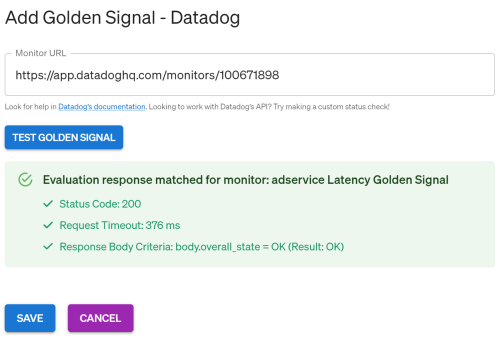
When using a supported tool, connecting a monitor to a health check is usually as easy as copying the monitor's URL and pasting it into a text box in the Gremlin web app. For example, the following images show four monitors from Datadog, with each monitor corresponding to a Datadog URL. We'll explain how to link these monitors in the next section. For now, just note the URL of the monitor(s) you wish to use to track the health of your service.

Adding a health check
To add a health check:
- Select Settings at the top of the Service Overview page, then select Health Checks.
- Select your monitoring or observability tool from the drop-down list, then click + Add.
- If this is your first time adding this tool, Gremlin will require you to add authentication details. Typically this involves adding an API Key and Application Key. Refer to your tool's documentation for information on where to find these. Once you've added the keys, click Test Authentication to verify that Gremlin can connect to your tool. If it's successful, click Save Authentication to save the keys to your Gremlin account. Gremlin will automatically reuse these keys whenever anyone on your Gremlin team adds additional monitors using this integration.
- Copy and paste the URL of the monitor you want to use.
- If you're using a supported tool like Datadog, you should be able to continue to step 4.
- If you're using a custom tool, Gremlin will ask you to enter Success Evaluation Criteria. Gremlin uses this to determine whether to evaluate the monitor as healthy or unhealthy. You'll need to enter the desired HTTP Status Code (200 by default) and a maximum timeout period (1000ms or 1 second by default). Click Test Evaluation to run a test and ensure the response meets your criteria.
- Once you've successfully tested the monitor, click Save.
We recommend repeating this process until you've added all of your service's most important monitors (or golden signals). Remember, you need to add at least one monitor to continue.
Step 5: Run reliability tests and get your reliability score
Now that you've defined your service and linked its health checks, you can run reliability tests and get your reliability score.
If you want to run the full suite of tests and get a complete score, click Run All at the top of the Service Overview page, then click Run All Tests to confirm. Gremlin will run each test sequentially. The page will automatically refresh to show the current running test and the results of completed tests.
To run an individual test, find the test you want to run, then click Run. Gremlin will prompt you to confirm that you want to run the test. Click Run again to confirm and start the test.
While the test is running, you'll see the test progression screen. Here, you can track the state of the test and the status of your Health Check monitors. You can stop the test anytime by clicking the Halt This Test or Halt All Tests buttons. You can also view log output from the Gremlin Agent(s) orchestrating the test by clicking on the name of the Agent(s) listed under Executions.
Lastly, if Jira integration is enabled, you can create, view, and manage issues related to this test by scrolling down to the Jira Issues section.
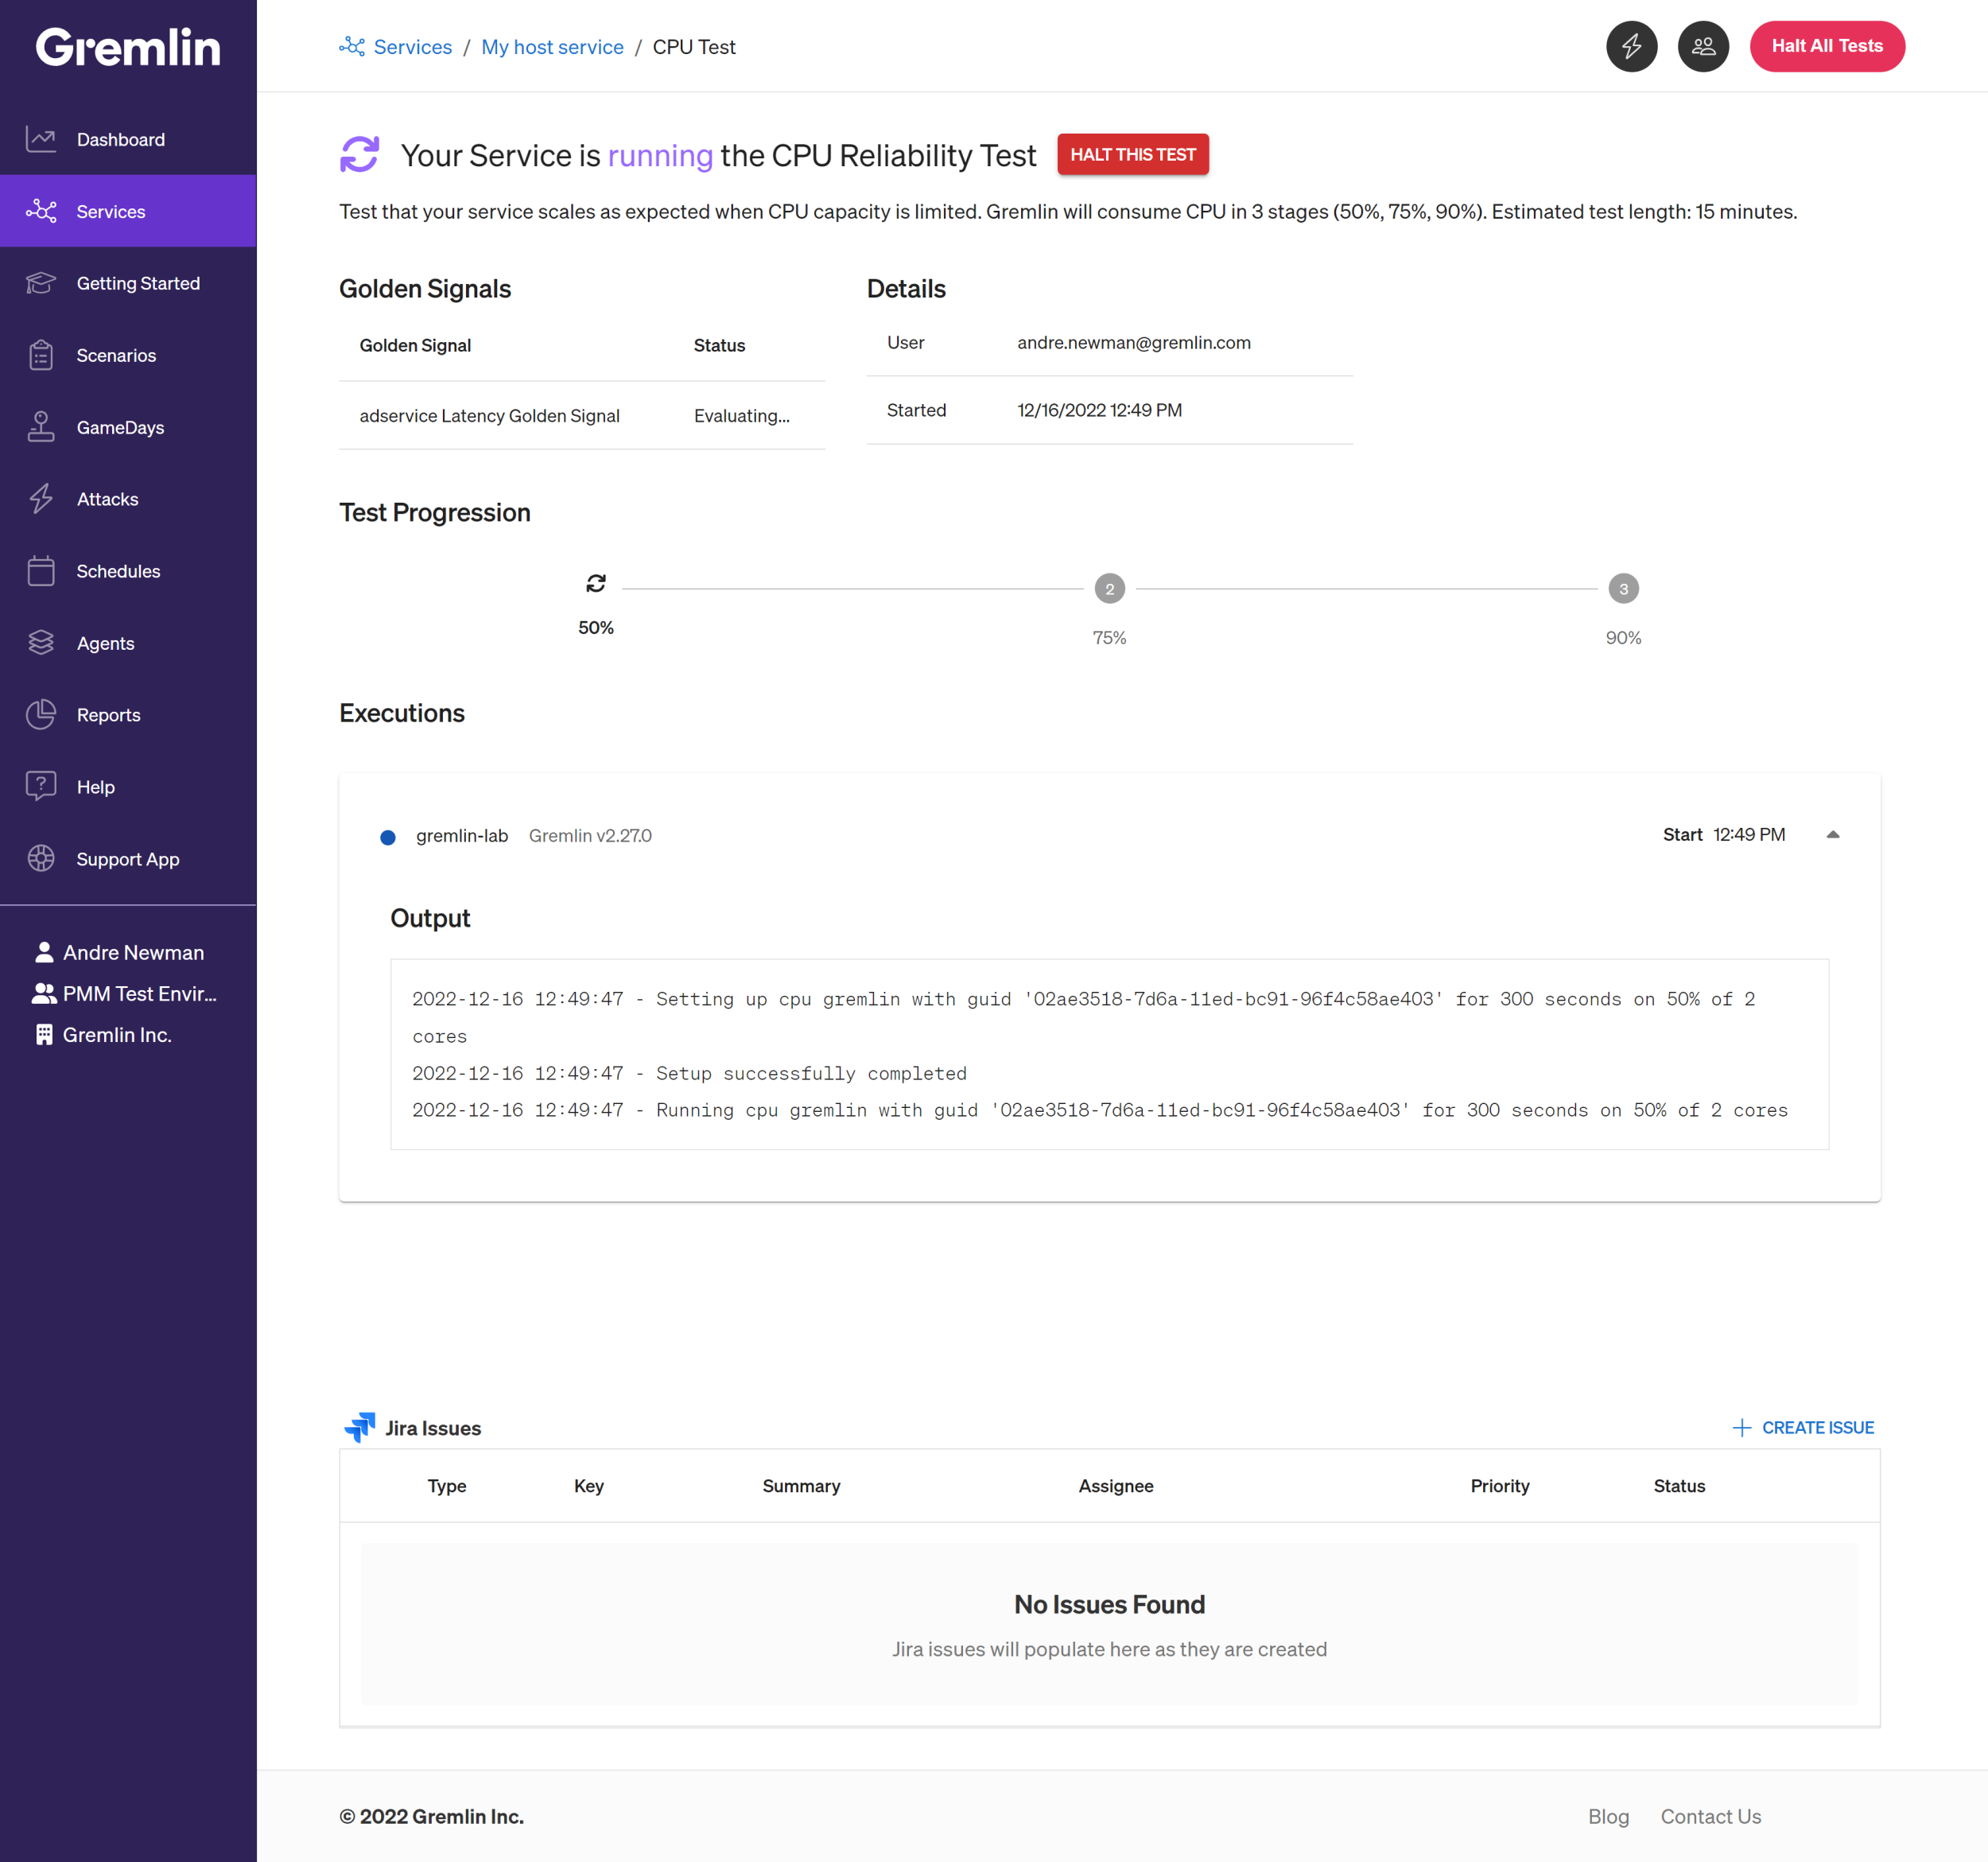
You can leave this page while the test is running. To return, navigate to the Services page, click on the Service you wish to view, scroll down to the active test, and click View Progress. For example, here's how an active CPU test appears:
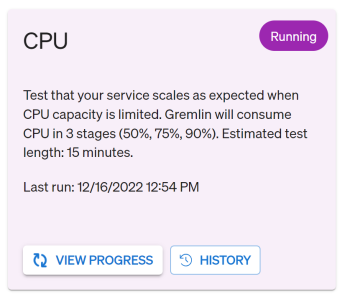
When the test is finished, Gremlin displays the final status of the test (passed or failed) and updates the service's reliability score. To view details about the test run, click on the Last run link or the History button. Test results expire after one week, at which point you'll need to re-run the test to maintain your score. Alternatively, you can use auto-scheduling to run the test regularly and keep your score up-to-date. For a breakdown of how the score is calculated, see the Reliability Score page.

Modifying a service
If you need to make any changes to a service (changing the name, adding or removing Health Checks, configuring auto-scheduling, etc.), open the service's page and click the Settings button at the top of the page. Select the option you wish to change, make your changes, then click Save. See Viewing service details for more information.
Next steps
Congratulations on starting your reliability journey! Now that you've added a service and run your first test, consider running the remaining tests, setting up auto-scheduling, and adding additional services. You can also check out the following links to learn more about how to use Gremlin RM:
- Managing services and dependencies
- Managing Health Checks
- Running reliability tests
- Understanding how the reliability score is calculated