


Services
Supported platforms:
A service is a discrete unit of functionality provided by one or more systems in your environment. For example, a web server deployed as a load balancer for your backend systems is a service. In Gremlin, services are the units used to test and measure the reliability of your system. This page will show you how to add, manage, and test your services using the Gremlin web app.
Viewing your list of services
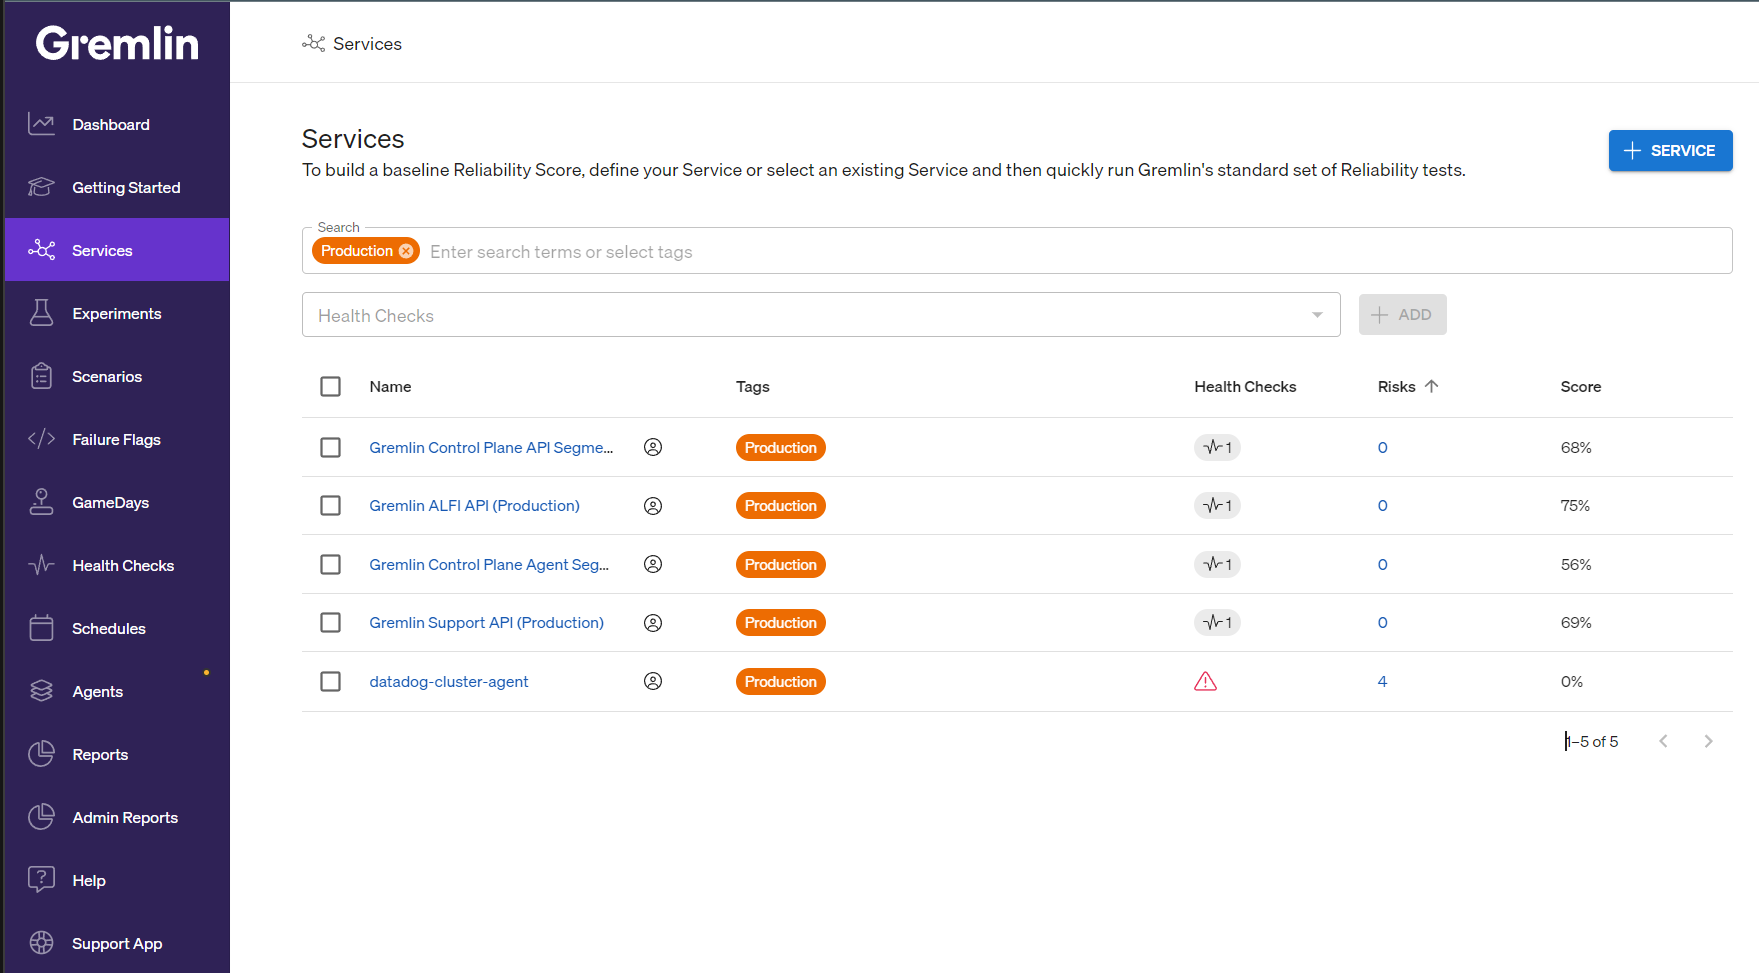
You can access your list of services using the Services menu item in the nav bar. This is the main view of any services that you or your teammates have added to Gremlin, along with their reliability score. If no services have been added yet, this list will appear empty.
To open a service, simply click on its entry in the list. You can search for a specific service by name using the search box, or by clicking on the Name or Score column header to sort by those fields.
Viewing your production services
Gremlin lets you flag services as being in a Production environment. When this flag is enabled for one or more services, those services will be highlighted, and an additional tab named Production will appear at the top of the list. Clicking on the Production tab shows only those services that are flagged as Production so that you can more easily identify key services.
Adding a service
To add a new service, you may define them manually, by adding one via an AWS Elastic Load Balancer (ELB), or by adding an annotation to your agent configuration.
Adding a service manually
To add a new service, click the + Service button on the top-right corner of the services list.
- Give your service a name.
- Check This Service is in a Production environment if your service is handling live traffic. This adds a baner on top of the service's page, adds an
environment: productiontag, and shows a confirmation dialog each time you run a test on this service. - Select the Type of Service. Gremlin supports host-based, container-based, Kubernetes-based, and Failure Flags-based services.
- Define your service's fingerprint. This is where you select the resources in your environment that comprise your service. The selection will change depending on the type of service selected. For example, selecting Kubernetes will show all of the Kubernetes resources detected by your Gremlin agent(s).
- For Failure Flags, this will show the services detected by your Failure Flags agent(s).
- For hosts and Kubernetes, you can select multiple resources. For example, you can select multiple Kubernetes Deployments, a Deployment and a DaemonSet, etc.
- For Kubernetes, you can use label selectors to identify the resources that belong to this service. After selecting Kubernetes as the service type, click the Selector button. After selecting the cluster and namespace that your application is deployed to, enter your selection criteria in the Label Selectors field, then click View Matches. Gremlin will list any matching resources, letting you review and confirm before continuing.
- Click Create Service.
Adding a service via an AWS Elastic Load Balancer (ELB)
If you've authenticated Gremlin with your AWS account, Gremlin can detect your ELBs and use them to define your services for you. Gremlin will also automatically create Health Checks for these services, so you can start running tests immediately after creating them.
- Click on the Getting Started nav item.
- Under step 3 (Define your services), select the AWS account you wish to add the service from. If you haven't added an account yet, follow the instructions in Authenticating Gremlin to AWS.
- Select the Elastic Load Balancer (ELB) that you want to use to create the service. Note that you can select multiple ELBs at once.
- If Gremlin can't detect your ELBs, make sure you've set up your AWS authentication correctly, and that your Gremlin IAM role has the correct permissions. You can find the full policy and permissions on the CloudWatch Health Checks page.
- Once your ELB(s) are selected, click Create Service.
Adding a service by using annotations
You can use annotations to automatically register a service with Gremlin. For instructions, see Automatically onboarding services.
Adding a service from a Scenario
If you create a Scenario, you can use the targets you selected for it to create a service. This lets you easily create services without manually re-selecting their resources or adding annotations. To learn how, see Creating a service from a Scenario.
Managing services
The Service Details page serves as your dashboard for viewing, managing, and testing each service. You can perform tasks such as viewing the service's reliability score, running reliability tests, adding Health Checks, integrating with other services, deleting the service, and viewing the service's selection criteria (e.g., the systems in your environment that comprise the service). You can also view, manage, and run tests on the service's dependencies.
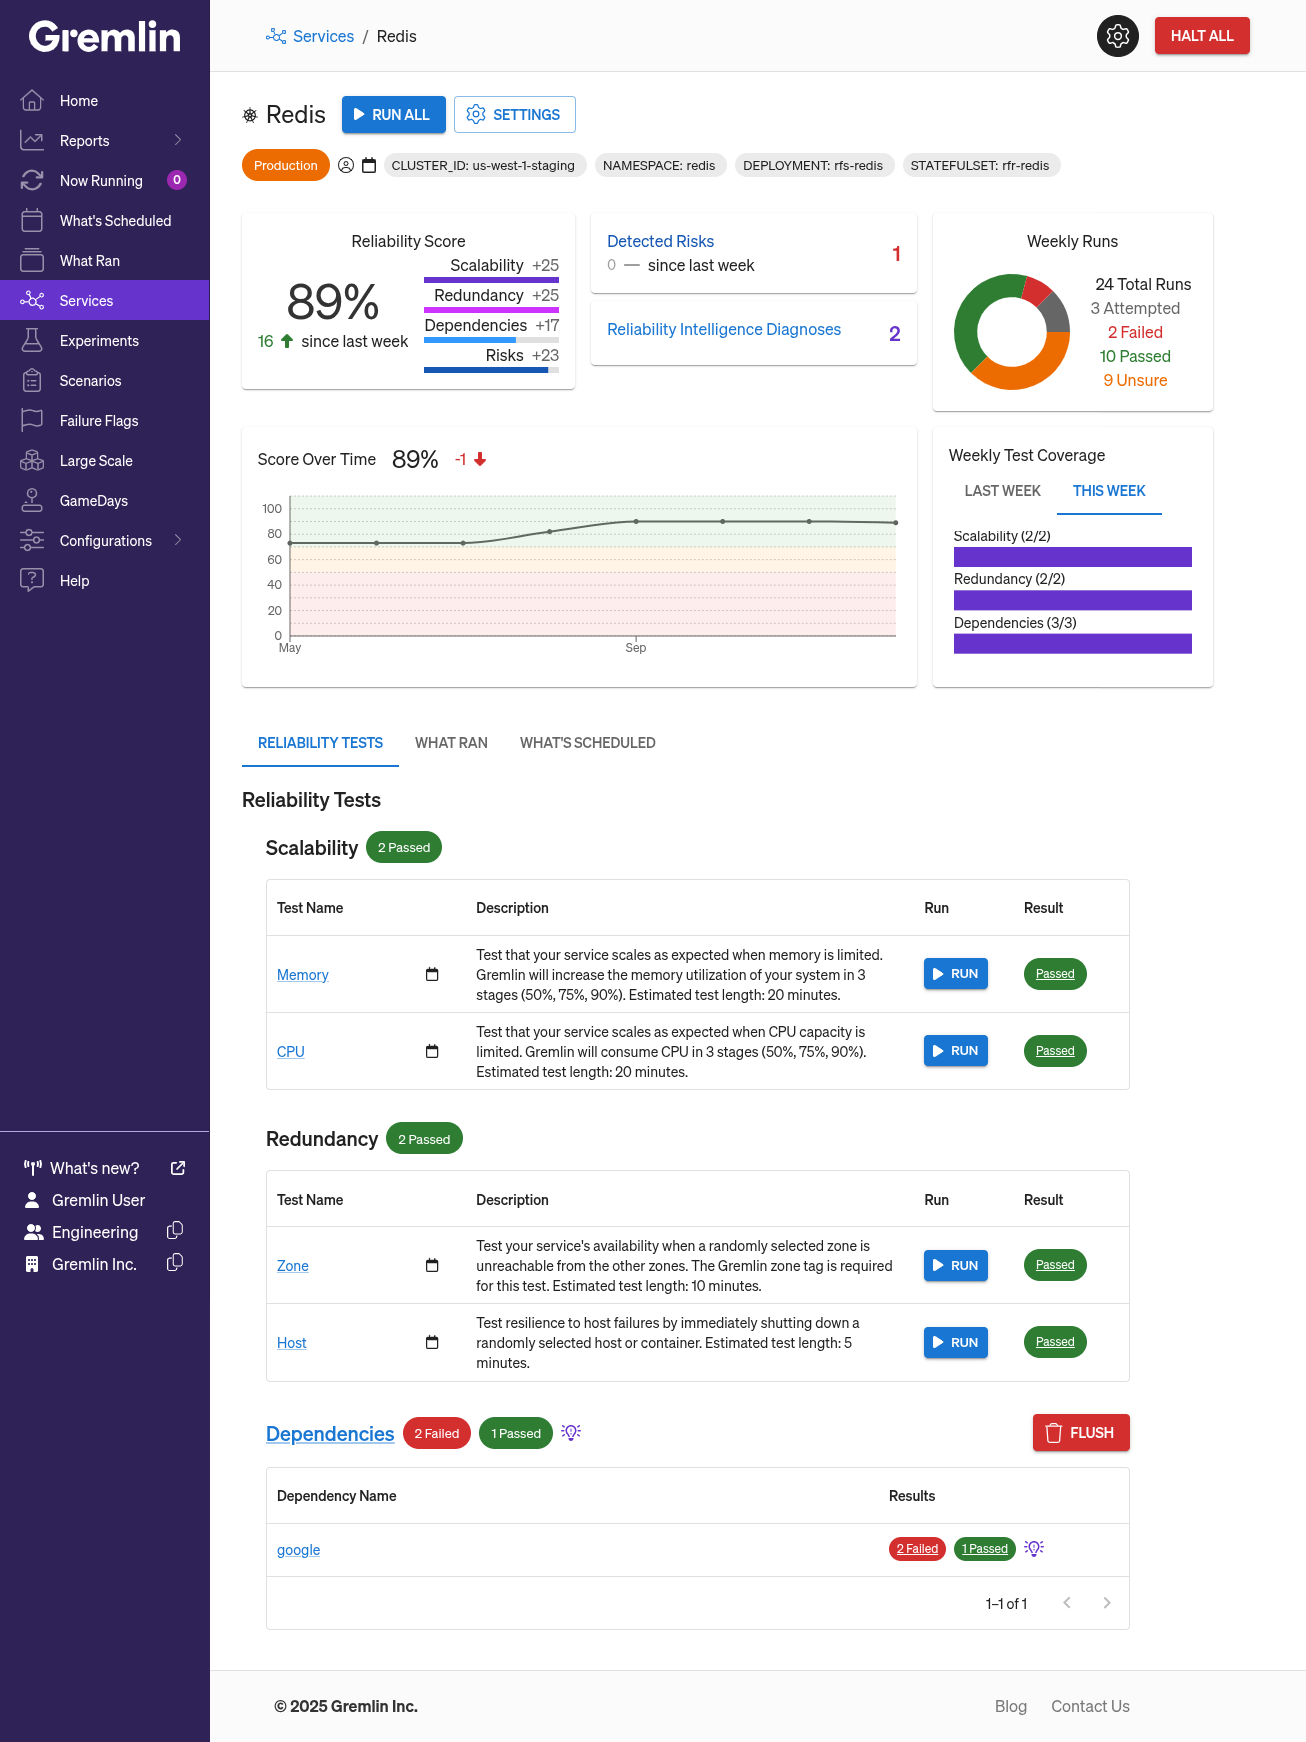
Service details
The service details show everything you need to know about the service, including its:
- Reliability Score: the percentage of reliability tests the service passed this week, broken down by category. Gremlin also shows the percentage change compared to the previous week’s score.
- Detected Risks: the number of automatically-detected reliability risks Gremlin discovered on this service, and the change in risks compared to the previous week.
- Reliability Intelligence Diagnoses: the number of reliability improvement recommendations Gremlin currently has for this service. This is based on the type of service, the test performed, the category of the Health Check that triggered the error, and any unusual events detected during the test (such as an out-of-memory event).
- Weekly Runs: the number of tests performed this week and their status. Clicking on a status will filter the test runs to that status in the “What Ran” tab, with tests filtered to that status.
- Score Over Time: the service’s reliability score charted month-over-month over a rolling six-month period.
- Weekly Test Coverage: the number of tests performed this week in each testing category. You can view the current week’s test coverage and the previous week’s test coverage.
Running reliability tests
The default tab for the Service Details page is the “Reliability Tests” tab. This tab displays the current Test Suite and the status of each test (if it has been run). You can also run or halt individual tests from this tab.
Viewing previously run tests
The “What Ran” tab lists all tests, Scenarios, and experiments that have been run on this service. Each entry lists the type of test, its result (if available), how it was initiated (the “source”), and its runtime. Clicking on an entry brings you to the test results page, where you can view additional details about the test.
Viewing scheduled tests
The “What’s Scheduled” tab lists all tests, Scenarios, and experiments that are scheduled to run on this service. Like the “What Ran” tab, you can see the type of test and who (or what) scheduled it. Gremlin also lists an estimated start time, which it calculates using the length of the test and of other tests in the queue.
Assigning an owner
Services can be assigned to a service owner. Service owners will receive email notifications when:
- Test suites finish running, and
- Gremlin sends weekly reliability reports.
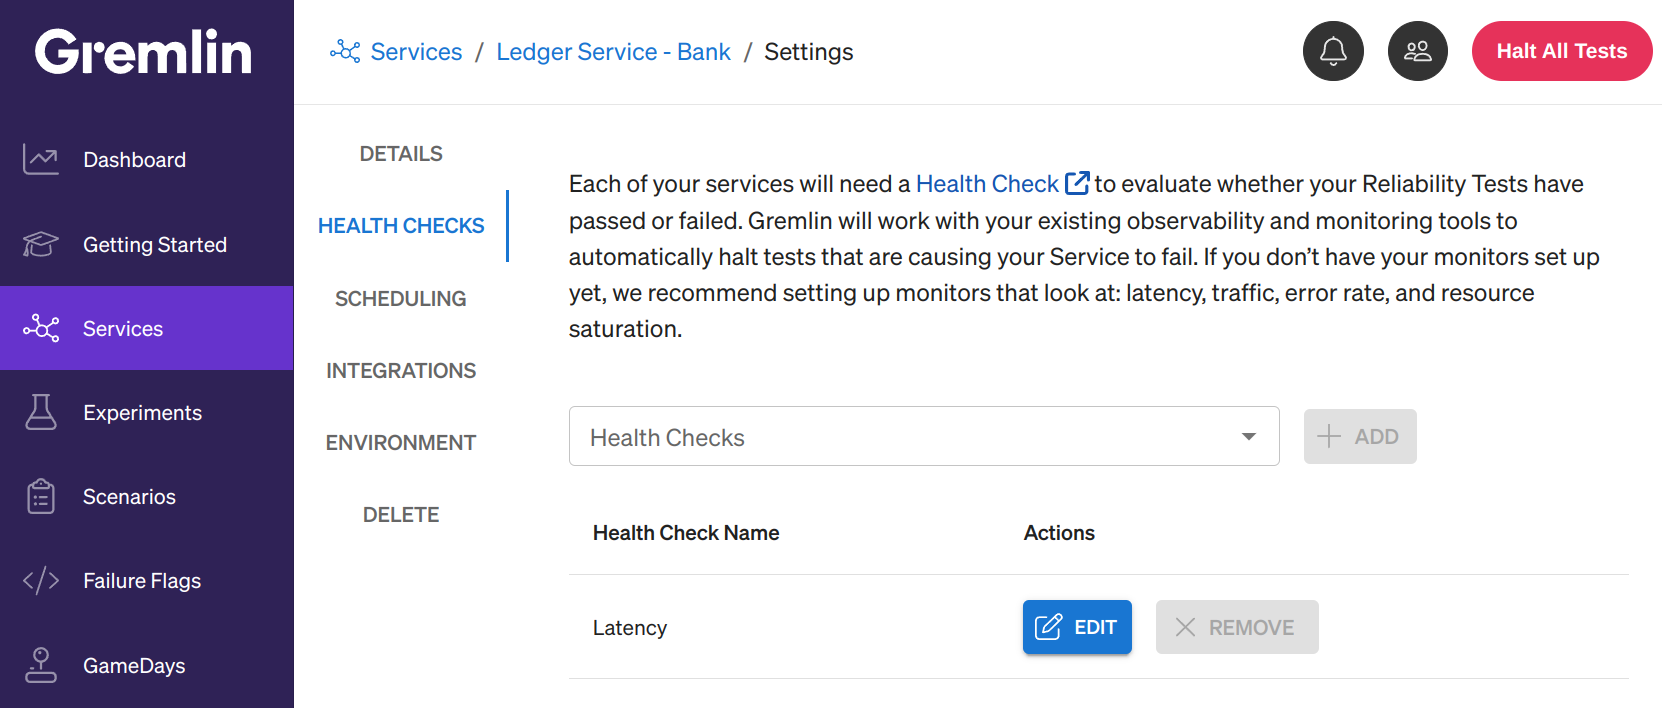
Adding and removing Health Checks
The Health Check feature automatically checks external metrics or REST API endpoints while a reliability test is running. These are usually monitors configured in an observability tool like Datadog, New Relic, or Prometheus. It can also include custom monitoring tools and URLs.
Before you can run a reliability test on a service, you'll need to assign at least one Health Check to the service. While a reliability test is running, your Health Check(s) will poll your observability tool every 10 seconds. If the monitor/endpoint reports back as failed, unhealthy, or unavailable, the Health Check will halt the ongoing test, revert the impact, and mark it as failed.
Adding a Health Check to a Service
Once you've created a Health Check, you can add it to a service in one of two ways:
Adding a Health Check from the service details page
- In the Gremlin web app, open the details page for the serivce you want to add the Health Check to.
- Click Settings at the top of the page next to the service name, then select Health Checks.
- Click on the Health Checks drop-down and select the Health Check you want to add. You can also type text to search for a specific Health Check.
- Click + Add to add the Health Check to the service.
Adding a Health Check from the Service list
- In the Gremlin web app, open the service list.
- Click the check box next to the service you want to add the Health Check too. Note that you can select multiple services for bulk adding Health Checks.
- Click on the Health Checks drop-down at the top of the list and select the Health Check you want to add. You can also type text to search for a specific Health Check.
- Click + Add to add the Health Check to the service.
Editing a Health Check
You can edit an existing Health Check in one of two ways:
Editing a Health Check from the service details page
- In the Gremlin web app, open the details page for the serivce you want to add the Health Check to.
- Click Settings at the top of the page next to the service name, then select Health Checks.
- Find the Health Check you want to edit, then click Edit.
- Make the desired changes to the Health Check.
- Click Test Connection, then Test Evaluation to verify the new settings.
- Click Save Health Check to save the changes.
Editing a Health Check from the Health Checks page
- In the Gremlin web app, open the Health Checks page.
- Find the Health Check you want to edit, then click Edit.
- Make the desired changes to the Health Check.
- Click Test Connection, then Test Evaluation to verify the new settings.
- Click Save Health Check to save the changes.
Removing a Health Check
To remove a Health Check from a Service, open the Service in the Gremlin web app, click Settings, and then click the Health Checks tab. Find the Health Check you want to edit, then click Edit. This will delete this specific Health Check, but it will not delete the authentication settings for the observability tool. In other words, you can continue using this observability tool for other Health Checks.
Viewing the reliability score
Each service has a reliability score ranging from 0 to 100. This score is a calculated value that represents how reliable the service is. Running a reliability test will increase your score. To learn how the score is calculated, see Reliability Score.
Managing the service's queue
The Queue page shows all the reliability tests scheduled to run—and currently running—on a service. To access the queue, click the Queue button at the top of each service’s overview page.
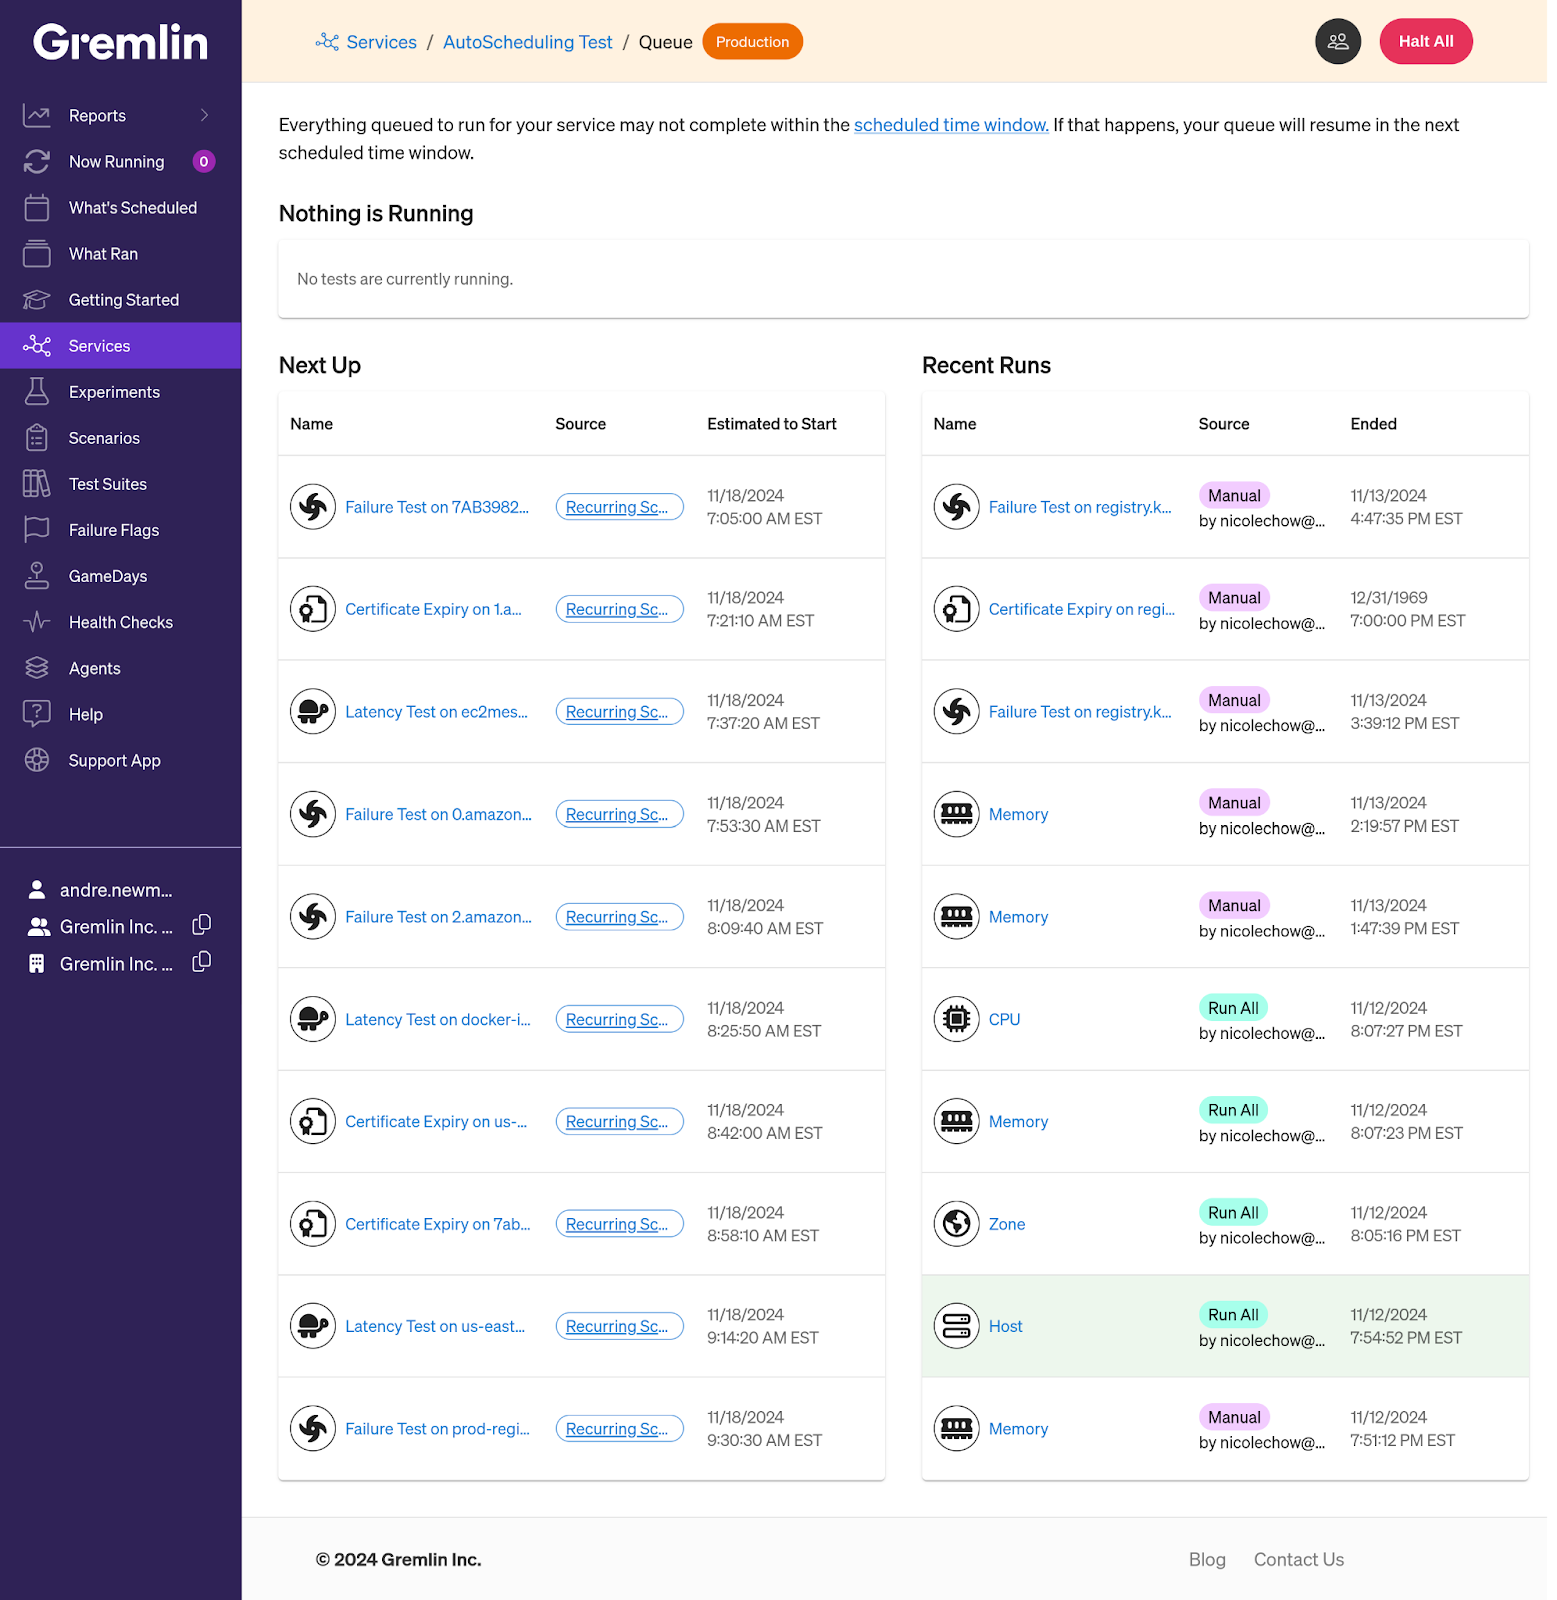
If a reliability test is running, it will be shown under the Now Running section at the top of the page with its start time, target service, source (how it was triggered), and a button to halt the test. The Next section shows the tests that are scheduled to run next, while the Recent Runs section shows the last ten (10) tests that have run on this service.
Editing service settings
You can modify a service by clicking the Settings button at the top of the service's page. This page lets you:
- Change the service's name.
- Add or remove Health Checks.
- Change the testing schedule.
- Manage integrations (e.g. load generators).
- Flag whether this service is a production service.
- Delete the service.
Flagging a service as Production
If a service is running in production, you may want to avoid running tests on it without confirmation. Gremlin lets you do this by tagging the service with metadata that identifies it as running in a production environment. The service will be highlighted in the service list and will show a confirmation warning when you try to run tests.
To flag a service as "Production":
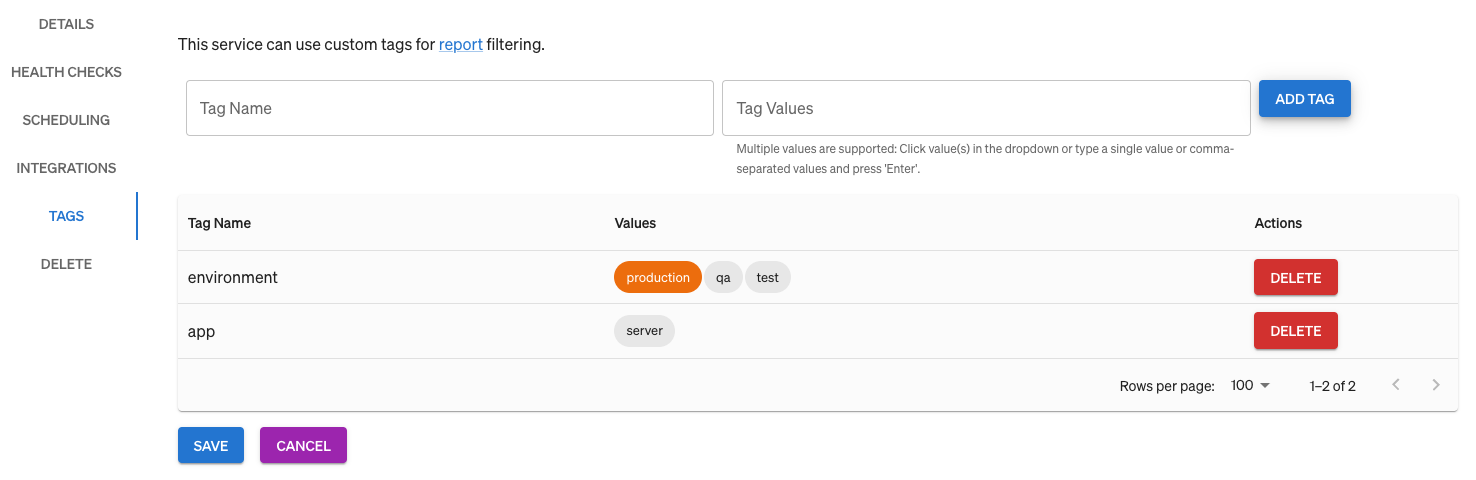
- Open the service settings and select the Tags tab.
- In the Tag Name box, enter <span class="code-class-custom">environment</span>, and in the Tag Value box, enter <span class="code-class-custom">production</span>.
- Click Add Tag. The new tag will appear in the box below, and "production" will be highlighted in orange.
If you want to flag every service as a Production service, you can do so by navigating to Team Settings, selecting the Environments tab, and clicking the Everything in this Team is in a Production environment checkbox.
Tagging a service with custom metadata
In addition to auto-detected tags (region, zone, etc.), you can also add your own custom tags to services. This lets you add metadata to help with searching, grouping, and filtering services.
To add a tag to a service, open the service's settings page and select the Tags tab. Give the tag a name in the Tag Name box, and enter its value in the Tag Values box. You can store multiple values in a single tag by entering them as a comma-separated list. When you're ready to add the tag, click Add Tag, then click Save.
The tag table shows all tags associated with this service. You can remove a tag from the service by clicking the Delete button. Note that deleting or editing a tag here won't change other service's tags, even if they share the same tag name.
For Kubernetes services, you can add tags using annotations. For example, here is an Nginx deployment with a production environment tag and an additional custom tag:
Deleting a service
To delete a service:
- Click Settings and select the Delete tab.
- Click Delete, then click Delete again to confirm.
Managing dependencies
In addition to testing services, Gremlin can test each service's dependencies. Learn more about discovering, managing, and testing dependencies on our Dependencies page.
FAQ
Q: How often are services discovered?
A: Gremlin currently discovers services once every hour.
Q: How often are characteristics of an existing service discovered and/or modified?
A: Gremlin currently discovers and/or modifies once every hour.
Q: How often are targets resolved to an existing service?
A: Gremlin resolves targets instantly, as soon as they change on a service. If a new pod is registered with the control plane, it’s immediately registered as a target to a service.
Q: How often does Gremlin associate pods, containers and hosts with existing services?
A: Every 30 seconds.