Amazon CloudWatch Health Check
Supported platforms:
Gremlin offers several ways of creating AWS Health Checks: either adding an Amazon CloudWatch monitor or alarm, or by automatically creating Health Checks using Intelligent Health Checks. In both cases, the first step is to grant Gremlin permission to access your CloudWatch environment if you haven't already done so.
Authenticating Gremlin to AWS
Please see our AWS integration documentation for instructions on authenticating Gremlin to your AWS account.
Using Intelligent Health Checks
For AWS services that are mapped to an Elastic Load Balancer (ELB), Gremlin can automatically create Health Checks for you. To enable Intelligent Health Checks:
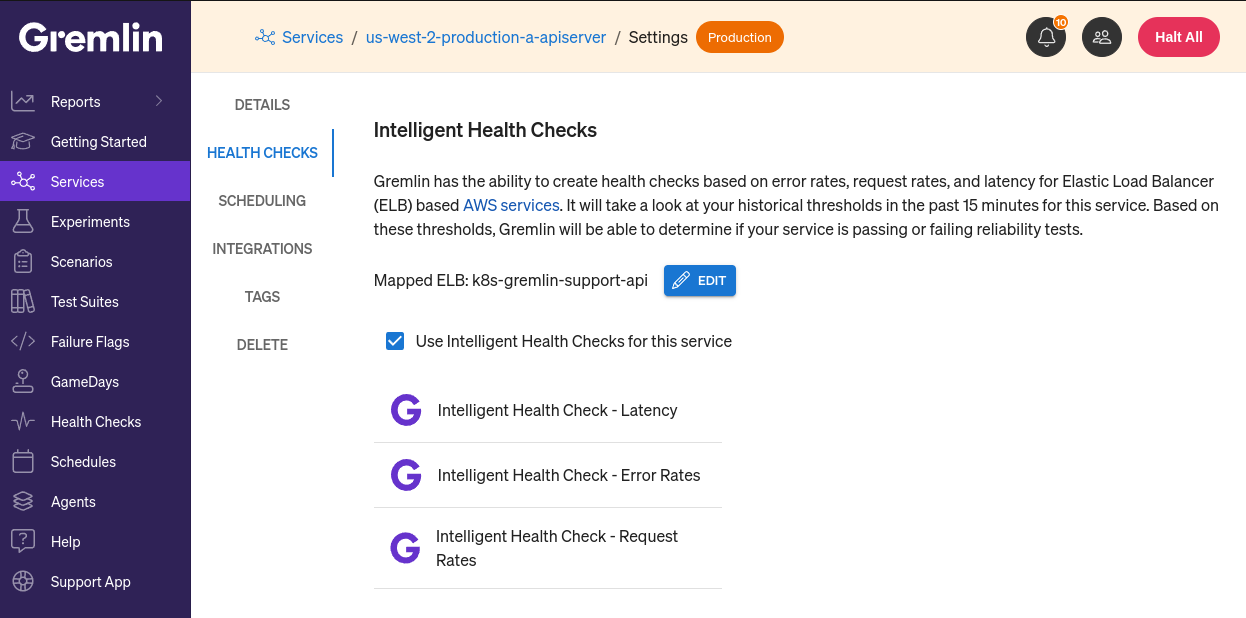
- Open the service's Settings page and navigate to Health Checks.
- Double-check the Mapped ELB field to ensure the correct ELB is mapped to this service. Using the wrong ELB will result in inaccurate testing scores.
- Click on the checkbox labeled Use Intelligent Health Checks for this service. Gremlin will generate a set of Health Checks for your service.
These Health Checks can be used instead of—or in tandem with—regular Health Checks, but they can't be used in Scenarios.
Adding an AWS CloudWatch alarm as a Health Check
Instead of using Intelligent Health Checks, you can also use any CloudWatch alarm as a Health Check. To add a CloudWatch alarm as a Health Check:
- Open the Gremlin web app and navigate to Health Checks, or click this link.
- Click + Health Check.
- From the Observability Tool drop-down, select AWS. If you’ve already authenticated Gremlin to your AWS account, select your account ID from the AWS Account ID box. Otherwise, follow the instructions above. Click Next.
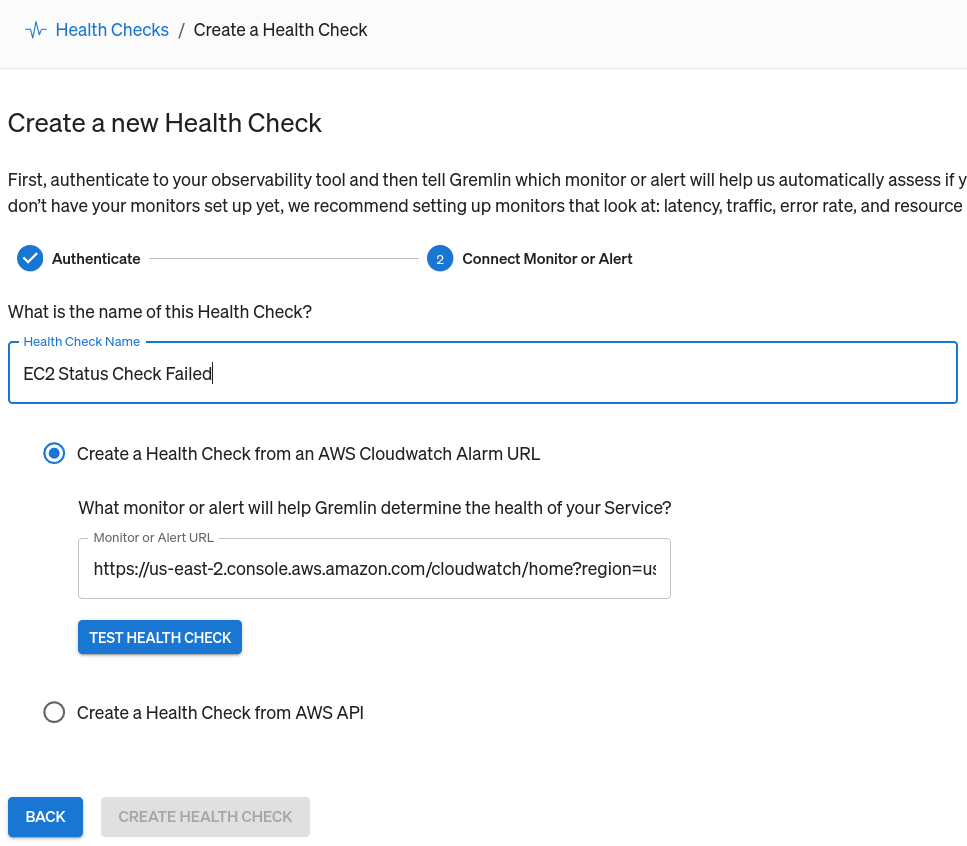
- Enter a Name for the Health Check. We recommend using the same name that you use in CloudWatch.
- Select Create a Health Check from an AWS CloudWatch Alarm URL.
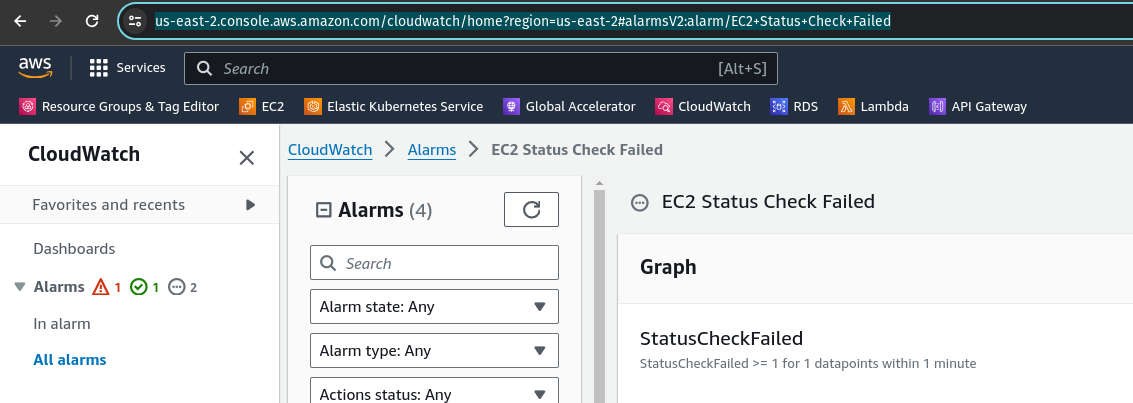
- Open the alarm you wish to use in the AWS Console, then copy its URL from your browser window.
- Go back to the Gremlin web app and paste the URL into the Monitor or Alert URL box.
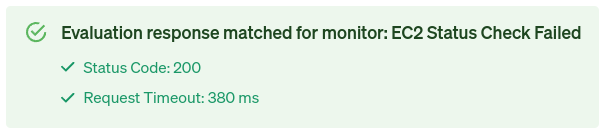
- Click Test Health Check to confirm that Gremlin can access your monitor, and that it’s reporting back as healthy.
- Click Create Health Check.
Alternatively, you can define custom success criteria for your Health Check by using the AWS API directly.
- After entering the name of your Health Check, select Create a Health Check from AWS API.
- Copy and paste the URL of your CloudWatch alert into the Monitor or Alert URL box.
- Click Test Connection to confirm that Gremlin can access your monitor. Gremlin will also show the HTTP response code and the JSON body of the response.
- Set the Success Evaluation Criteria. This is the criteria Gremlin will use to determine whether the alert is healthy, or if it’s in an alarm state. By default, Gremlin checks the value of `.DescribeAlarmsResponse.DescribeAlarmsResult.MetricAlarms[0].StateValue` to see if it equals OK. You can use any field here and compare it to any value. You can also specify the HTTP status code to look for, and set a maximum response timeout.
- Click Create Health Check.