Dashboard
Platform

New Relic Health Check

With New Relic, you can reference any previous or current incident, alert violation, or application ID relevant to your service. See Application and reporting health status in the New Relic documentation for more information.

Example incident, alert, or applicationInput valueEvaluation
List of all open incidentshttps://api.newrelic.com/v2/alerts_incidents.jsonGremlin looks at the response body and verifies the length, meaning that no incidents are created
Any available alert violations that are triggeredhttps://api.newrelic.com/v2/alerts_violations.jsonGremlin looks at the response body and verifies the length, meaning that no alert violations are present.
Summary data for a specific applicationhttps://api.newrelic.com/v2/applications/$APP_ID.jsonGremlin looks at the response body and verifies the value for "health status" field. This has to be green in order for the evaluation to be successful. Other values like yellow, red, or gray indicate an unhealthy application.

To add a New Relic Health Check:

  • Open the Health Checks page in the Gremlin web app, click + Health Check, then select New Relic from the Integrations drop-down.
  • If New Relic is already authenticated, go to step 3. Otherwise, continue with these steps:
  • ^In the New Relic web app, copy or create an API key.
  • ^In the Gremlin web app, paste your New Relic API key into the API Key text box.
  • ^Click Authenticate Observability Tool. To validate the endpoint with the added header, Gremlin calls the following API: <span class="code-class-custom">https://api.newrelic.com/v2/applications.json</span>
  • ^If the authentication passes, click Save Authentication, then click Next.
  • In the New Relic web app, get the URL of the incident, alert violation, or application ID that you want to use.
  • Back in the Gremlin web app, paste the URL into the New Relic API URL.
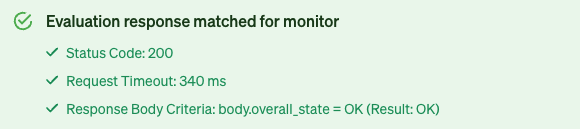
  • Click Test Health Check. Gremlin will send a test request to New Relic and analyze the response.
JSON response OK
  • Click Create Health Check.
No items found.
Next
Previous
This is some text inside of a div block.
Compatibility
Installing the Gremlin Agent
Authenticating the Gremlin Agent
Configuring the Gremlin Agent
Managing the Gremlin Agent
User Management
Integrations
Health Checks
Notifications
Command Line Interface
Updating Gremlin
Quick Start Guide
Services and Dependencies
Detected Risks
Reliability Tests
Reliability Score
Targets
Experiments
Scenarios
GameDays
Overview
Deploying Failure Flags on AWS Lambda
Deploying Failure Flags on AWS ECS
Deploying Failure Flags on Kubernetes
Classes, methods, & attributes
API Keys
Examples
Container security
General
Linux
Windows
Chao
Helm
Glossary
Alfi
Additional Configuration for Helm
Amazon CloudWatch Health Check
AppDynamics Health Check
Application Level Fault Injection (ALFI)
Blackhole Experiment
CPU Experiment
Certificate Expiry
Custom Health Check
Custom Load Generator
DNS Experiment
Datadog Health Check
Disk Experiment
Dynatrace Health Check
Grafana Cloud Health Check
Grafana Cloud K6
IO Experiment
Install Gremlin on Kubernetes manually
Install Gremlin on OpenShift 4
Installing Gremlin on AWS - Configuring your VPC
Installing Gremlin on Kubernetes with Helm
Installing Gremlin on Windows
Installing Gremlin on a virtual machine
Installing the Failure Flags SDK
Jira
Latency Experiment
Memory Experiment
Network Tags
New Relic Health Check
Overview
Overview
Overview
Overview
Overview
Packet Loss Attack
PagerDuty Health Check
Preview: Gremlin in Kubernetes Restricted Networks
Private Network Integration Agent
Process Collection
Process Killer Experiment
Prometheus Health Check
Role Based Access Control
Running Failure Flags experiments
Scheduling Scenarios
Shared Scenarios
Shutdown Experiment
Slack
Teams
Time Travel Experiment
Troubleshooting Gremlin on OpenShift
User Authentication via SAML and Okta
Users
Webhooks
Integration Agent for Linux
Test Suites
Restricting Testing Times
Reports
Process Exhaustion Experiment
Enabling DNS collection