Getting started with Foresight AI




Teams are writing and shipping code faster than ever, but with that come increased reliability risks. Gremlin Foresight AI helps you find and fix these risks before they become incidents and outages.
In this tutorial, you’ll use Foresight to take a set of services from first deployment to a tracked reliability program. During this tutorial, you'll:
- Onboard services from a Kubernetes application.
- Find reliability risks and get prioritized fixes, including Kubernetes manifest diffs.
- Run tests on your services after applying fixes to confirm they worked.
- Schedule weekly reports from Foresight’s Technical Program Manager (TPM).
- Build dashboards that show your progress over time.
This tutorial takes around 15 minutes, plus the time your reliability tests take to run. This tutorial uses Bank of Anthos, Google's sample banking app, running on a Kubernetes cluster.
Prerequisites
For this tutorial, you’ll need:
- A Gremlin account with access to Foresight AI (contact your account executive for details).
- A Kubernetes cluster with Bank of Anthos deployed and the Gremlin Helm agent installed.
- Alternatively, you can use any test environment with the Gremlin agent deployed.
Step 1: Onboard your services
Deploying the Gremlin agent lets you run experiments, but you need to define a service to run reliability tests, get a reliability score, and discover dependencies. Normally, you’d create these services yourself using the Gremlin web app or script their creation with Gremlin’s REST API. Foresight can create them for you instead.
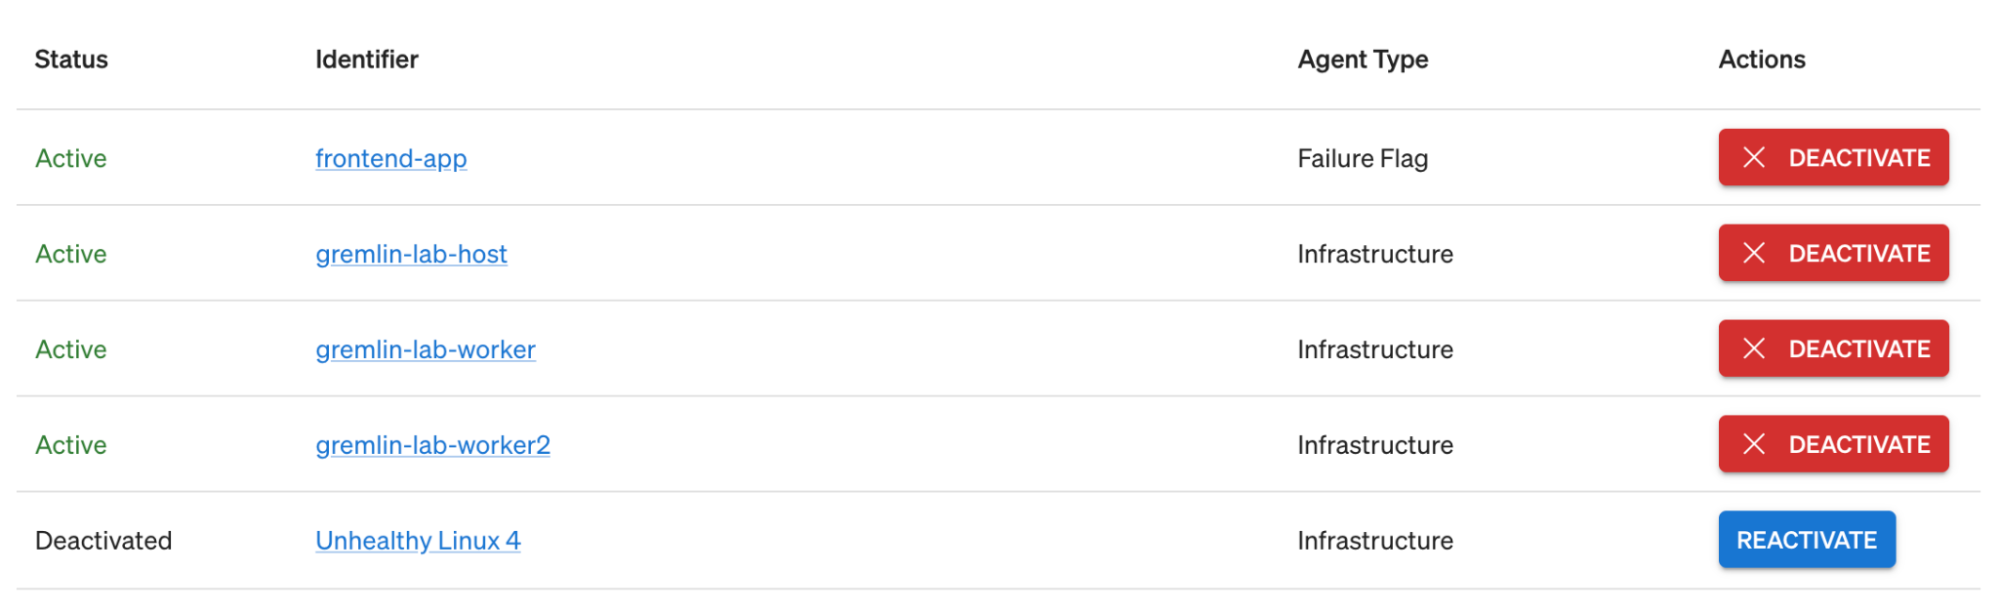
First, confirm that your agents are reporting:
- Log into the Gremlin web app and navigate to Configuration > Agents.
- Confirm that your agents appear in the list with the Infrastructure agent type and an Active status.
Next, use Foresight to find and create your services.
- Log into Foresight AI and navigate to the Chat pane.
- Enter “Identify services in my environment that aren't already in my Gremlin team.” If you’re a member of multiple Gremlin teams, Foresight might ask you to specify which team you want to add the services to.
-
Foresight lists the services it discovered. Depending on your environment, it may flag some services as intentionally excluded (for example,
kindnetandkube-proxyon Kubernetes clusters).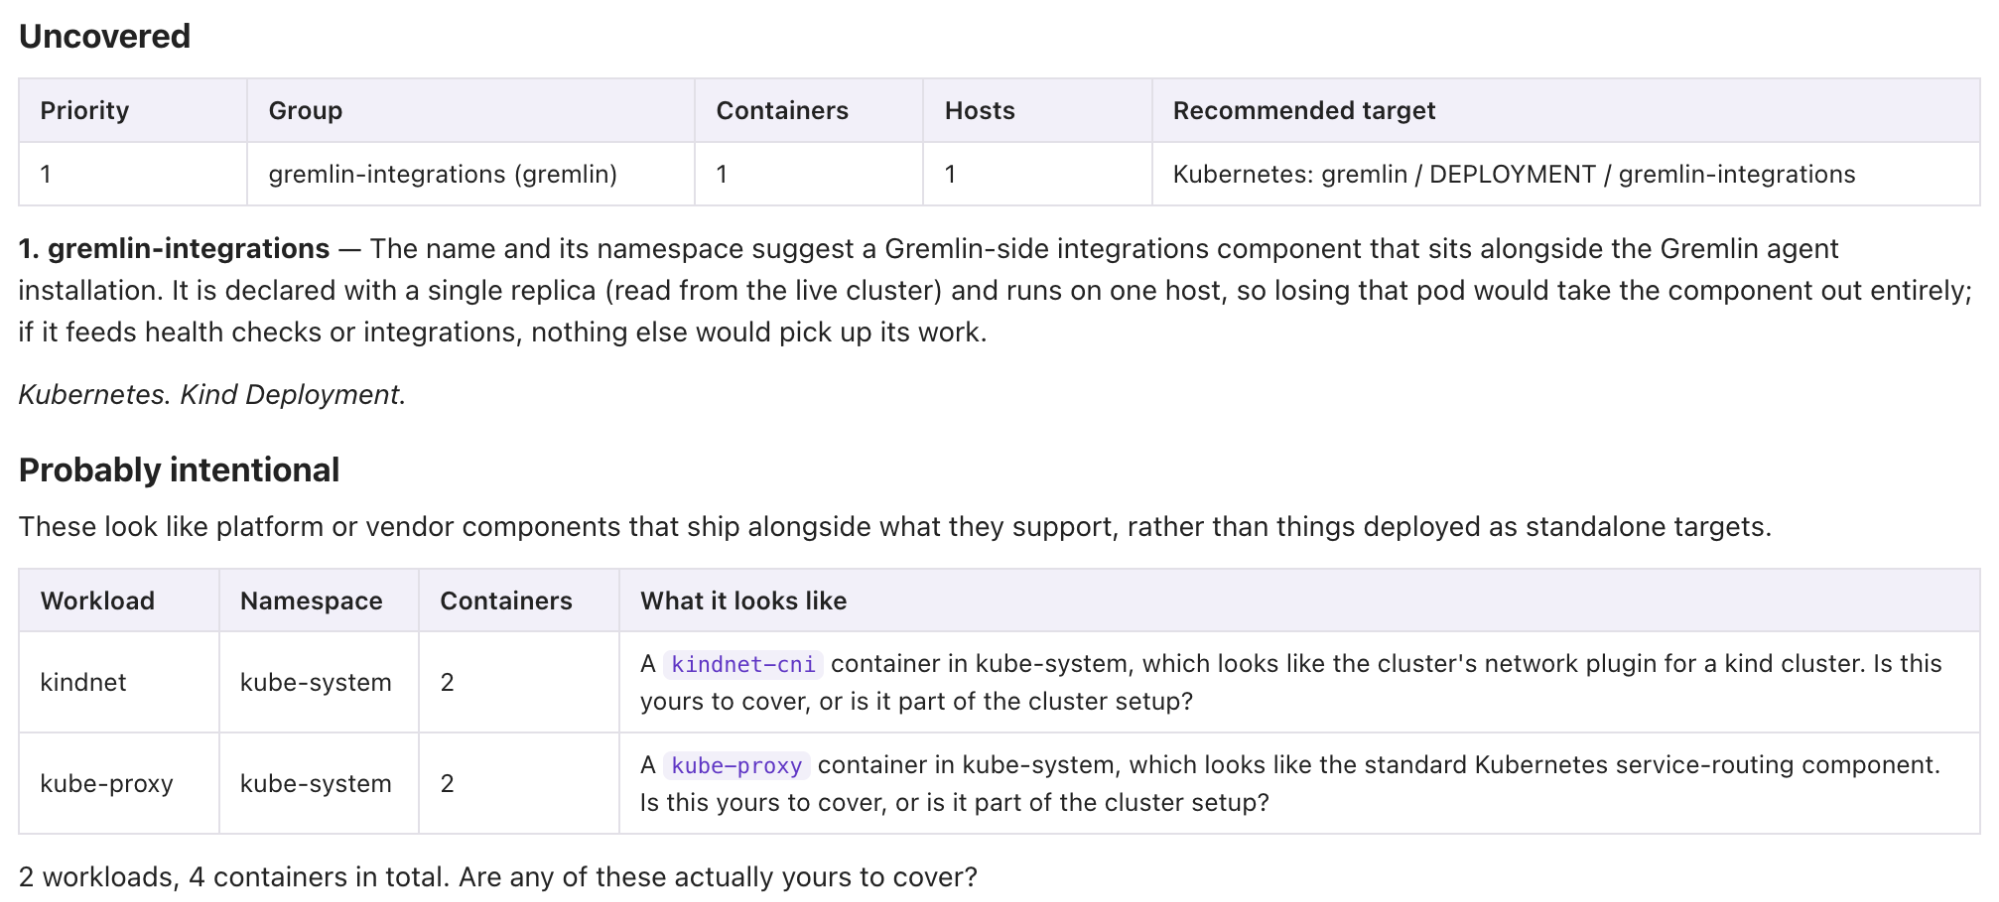
-
Foresight recommends how to proceed. Answer “Yes” to accept its recommendation, or provide additional details.

-
As a safety measure, Foresight asks you to confirm certain actions. To see what the request will do, click Request details. Click Yes to approve and create the service (you can onboard multiple services at once this way).


Create and add Health Checks
Before you can run tests on these services, you’ll need to add Health Checks. You can ask Foresight to create Health Checks for you. For example, we can create a basic Health Check that monitors the URL where our application is hosted, via the frontend service:
- Find the external IP of the
frontendservice by runningkubectl get service frontendand looking under theExternal-IPcolumn. - Ask Foresight to "Create a new Health Check that monitors [your external IP] for errors and attach it to all Bank of Anthos services."
Alternatively, if you already have a Health Check you want to use, you can ask Foresight to attach it to your new services. For example: “Add my 'Bank of Anthos Frontend' Health Checks to [service name].”

Step 2: Find risks, test your services, and get fixes
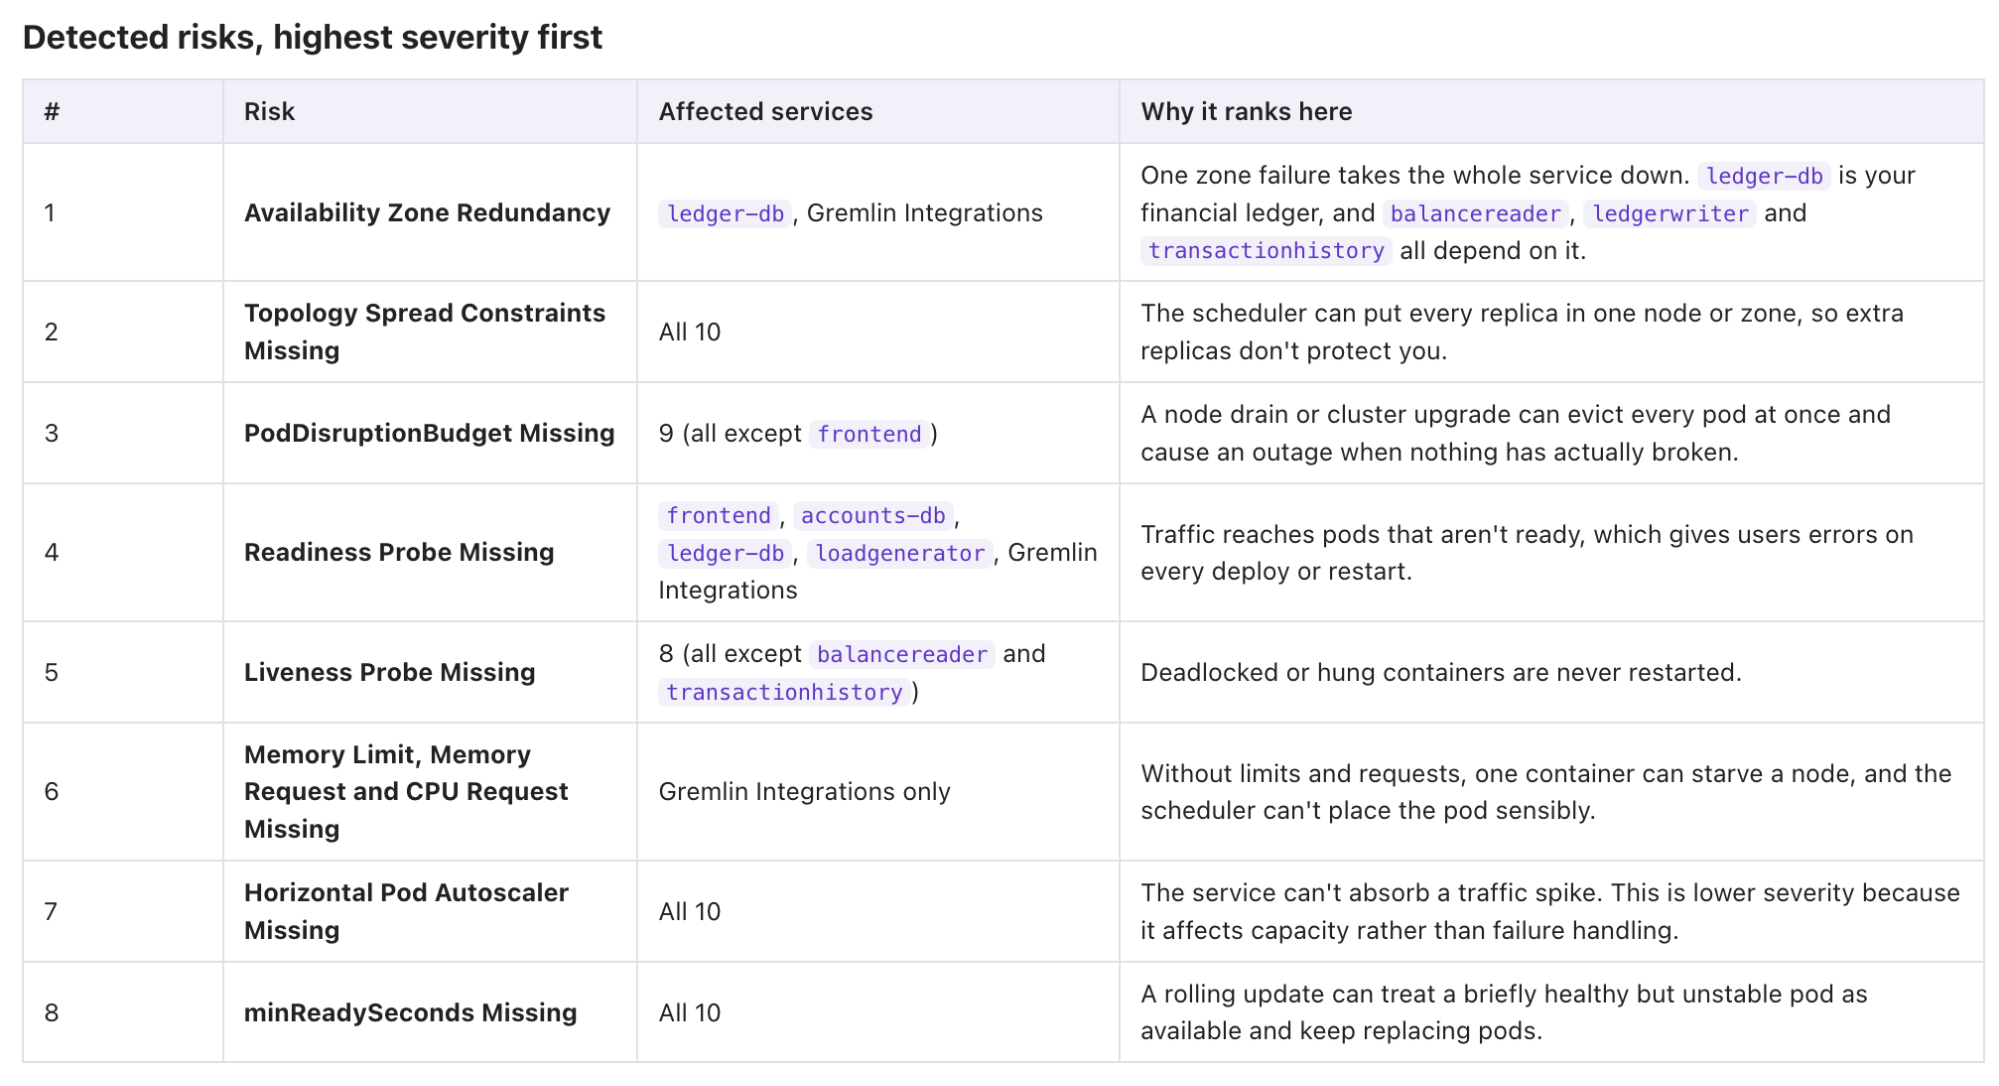
As soon as you add your services, Gremlin evaluates them for Detected Risks. Ask Foresight which risks are the highest priority and how to fix them. For the sake of this tutorial, focus on one specific service, like the frontend service.
-
Ask Foresight “What reliability risks are present in my frontend service? Order from highest severity to lowest.”
-
To learn how to fix each issue, ask “How do I fix these?”
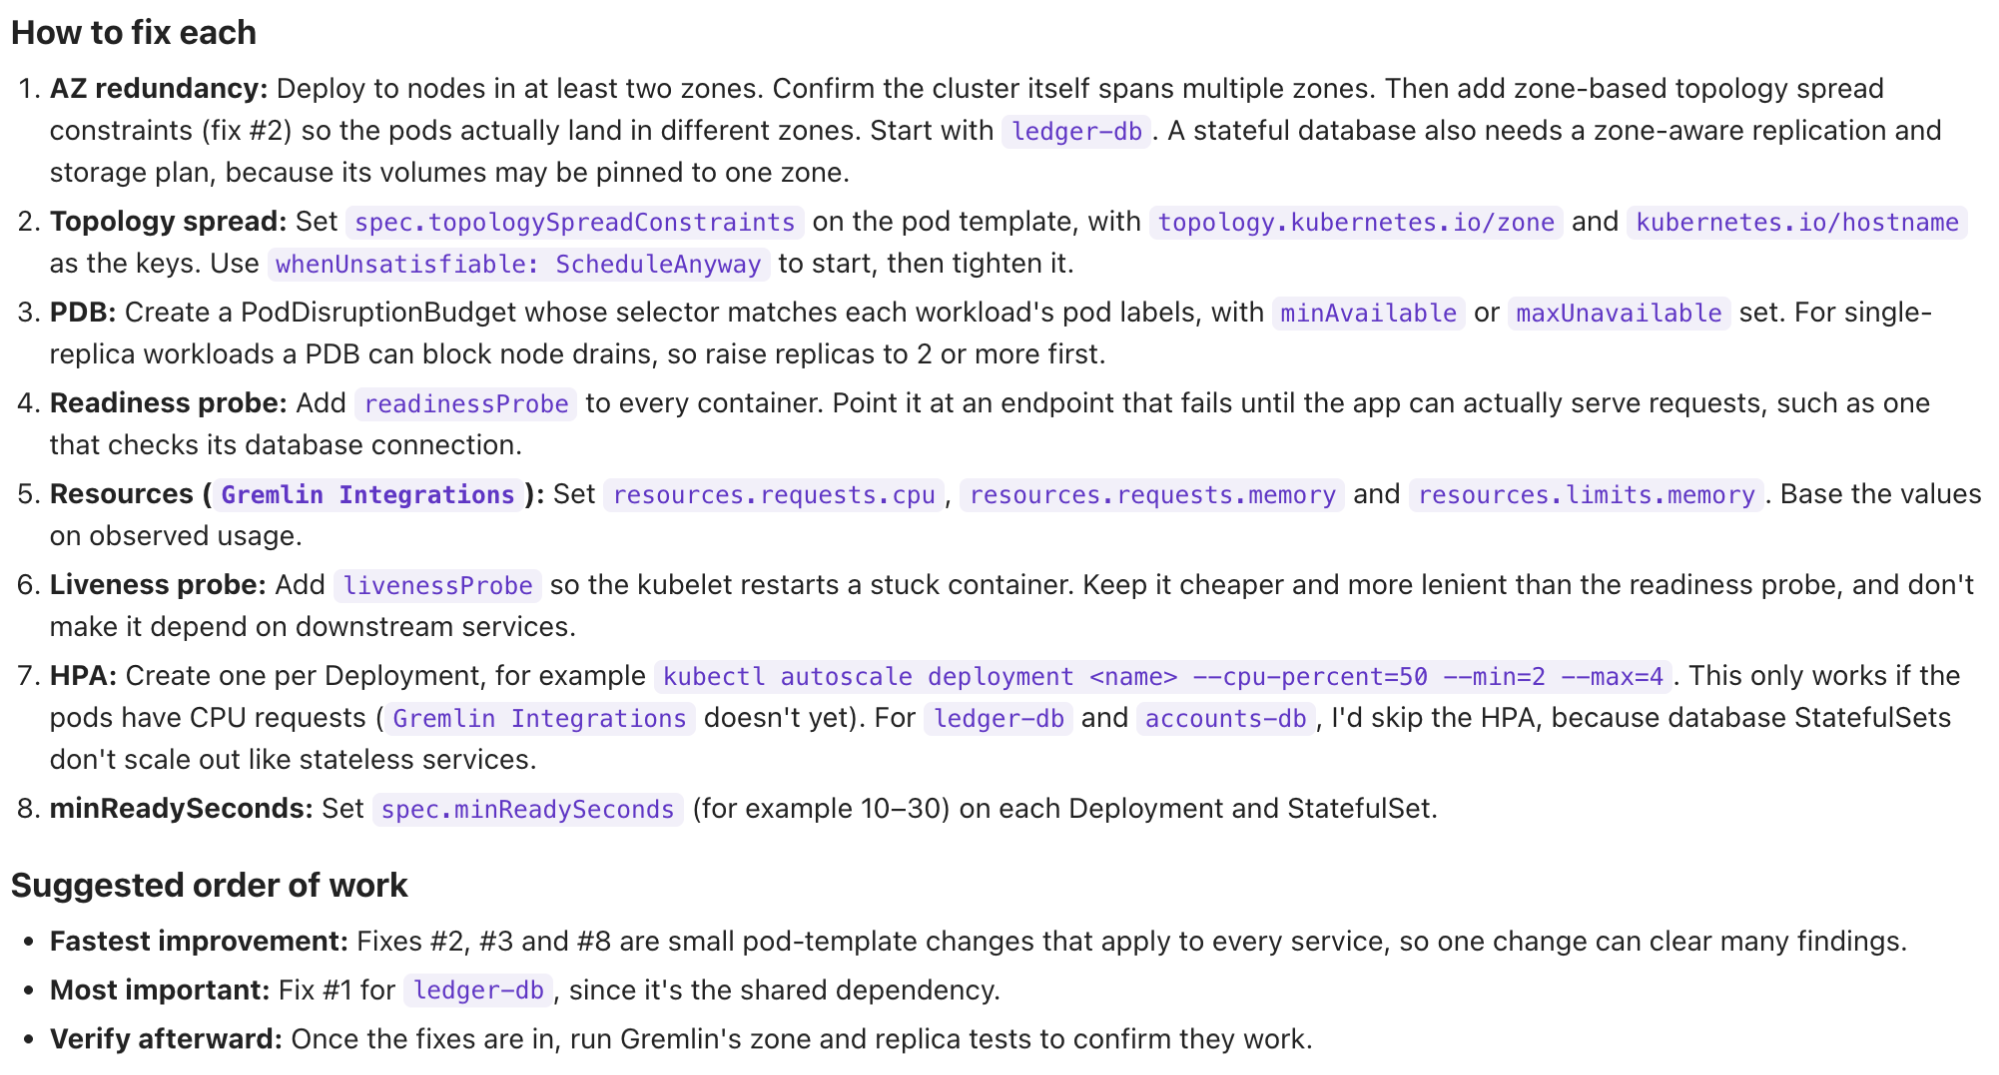
-
For Kubernetes services, Foresight can also display diffs that you can drop into your Kubernetes manifests.
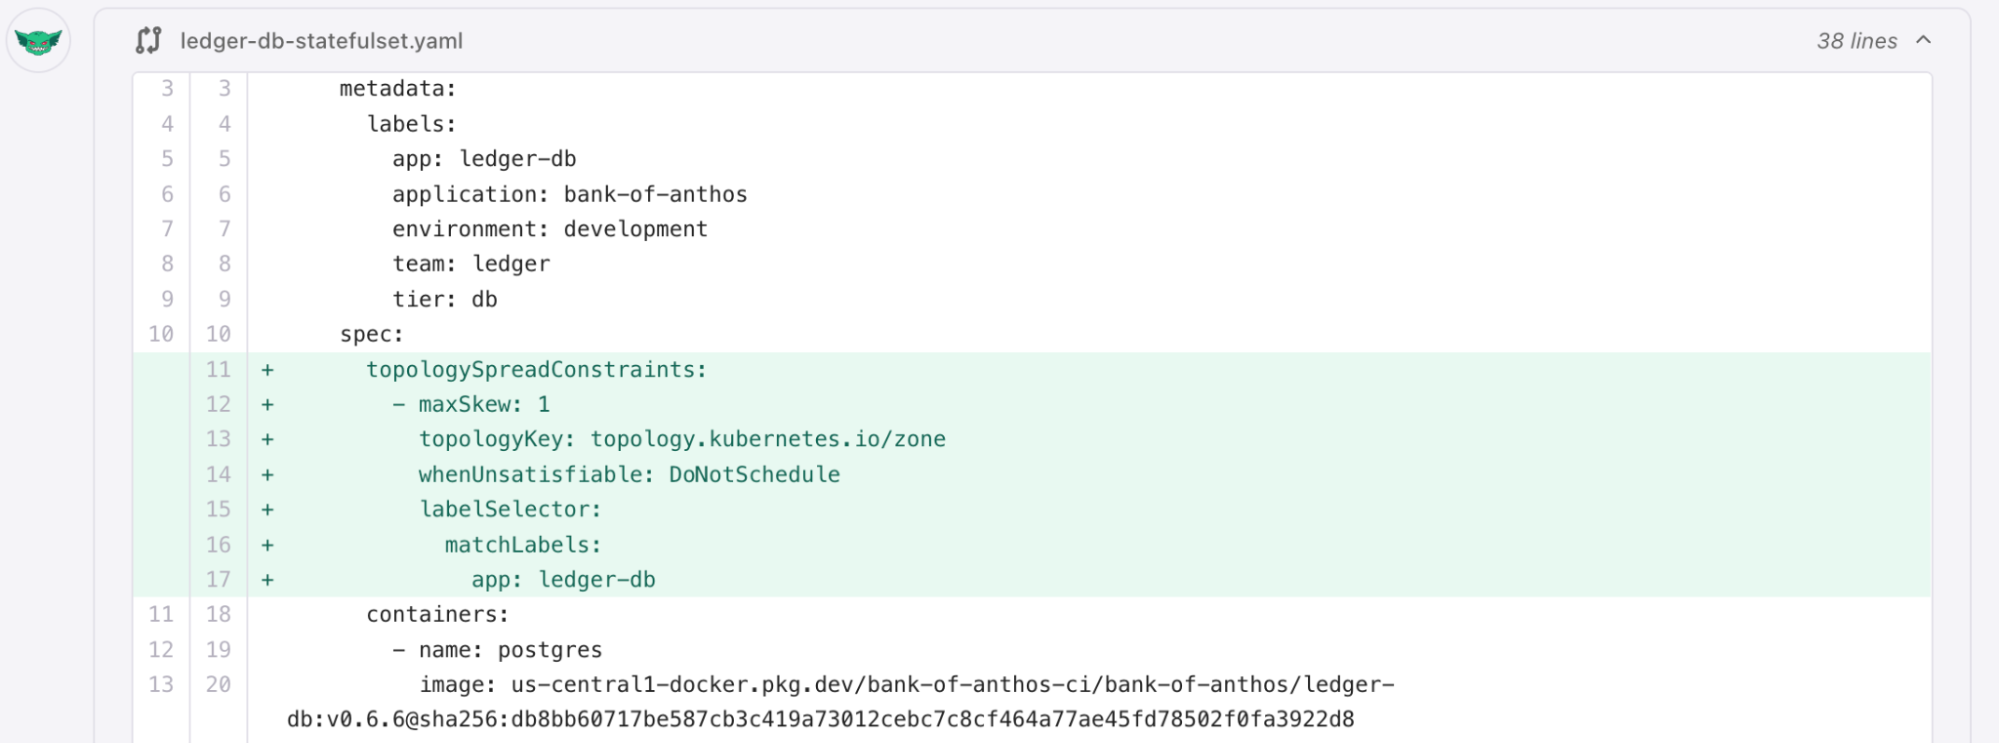
Step 3: Apply fixes and re-test
Now that you have your risks and action plan, apply the fixes by editing and re-deploying your Bank of Anthos manifests using your preferred AI coding tool.
After editing and re-deploying the frontend service, ask Foresight to re-analyze it for risks. Gremlin keeps a history of risks, so Foresight can tell you which risks you fixed and which remain. For example:
- “Which Detected Risks on frontend have been resolved since the last test run?”
- “Compare frontend’s reliability score before and after my changes.”
- “Re-run the failed reliability tests on my frontend service.”
Step 4: Set up TPM for regular reports
Foresight comes with a Technical Program Manager (TPM) that automatically reviews your Gremlin environment and generates weekly reports with recommendations. This makes it easy to stay on top of changes in your reliability score, review failed test results, and track your progress towards your reliability goals.
- Click the Program bar at the top of the Foresight page.
- Click Create Configuration.
- Give your program a Name, or use the default.
- Goals are your desired outcomes for your reliability initiatives: reducing incidents, reaching four or five nines of availability, etc. These help guide the TPM's recommendations. For this tutorial, add the following goals:
- "Make the frontend service redundant"
- "Ensure the frontend can scale to handle traffic surges"
- Leave the Report Period at its default of 14 days (two weeks) and the Report Day of Week at its default value of 1 (Monday).
- Click Submit to create the program, then click Generate Report to get your first TPM report.
After a few moments, Foresight displays your report with a comprehensive analysis of the frontend service, where its risks are, and which risks we should prioritize in order to meet our goals. Foresight also creates action items for us, called Commitments.
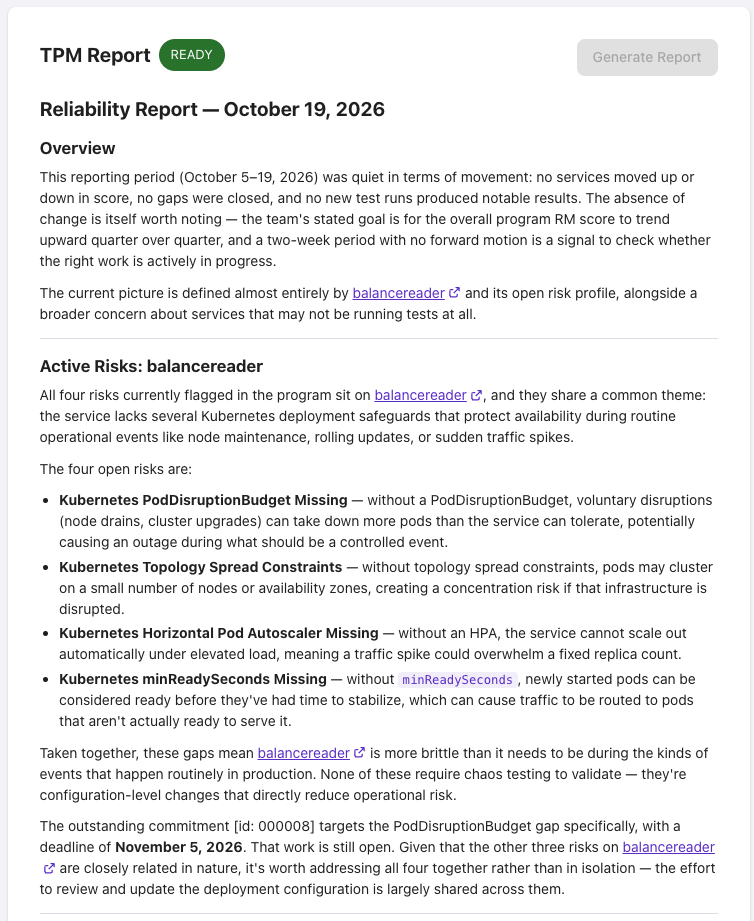
Manage Commitments
A Commitment is a recommended action item created from the results of a TPM report. For example, the TPM noticed that our frontend service has four open risks. These risks will become Commitments that we can track as part of our program.
- Click the Program bar at the top of the Foresight page and select the Commitments: Open page.
- Review the list of newly-created Commitments under Commitments: Open > Suggested.
- Click Accept to add a Commitment (such as the PodDisruptionBudget Missing risk) to your program.
Once you complete the Commitment and verify that the risk is fixed (step 3), you can click Complete to move it to the Commitments: Closed page.
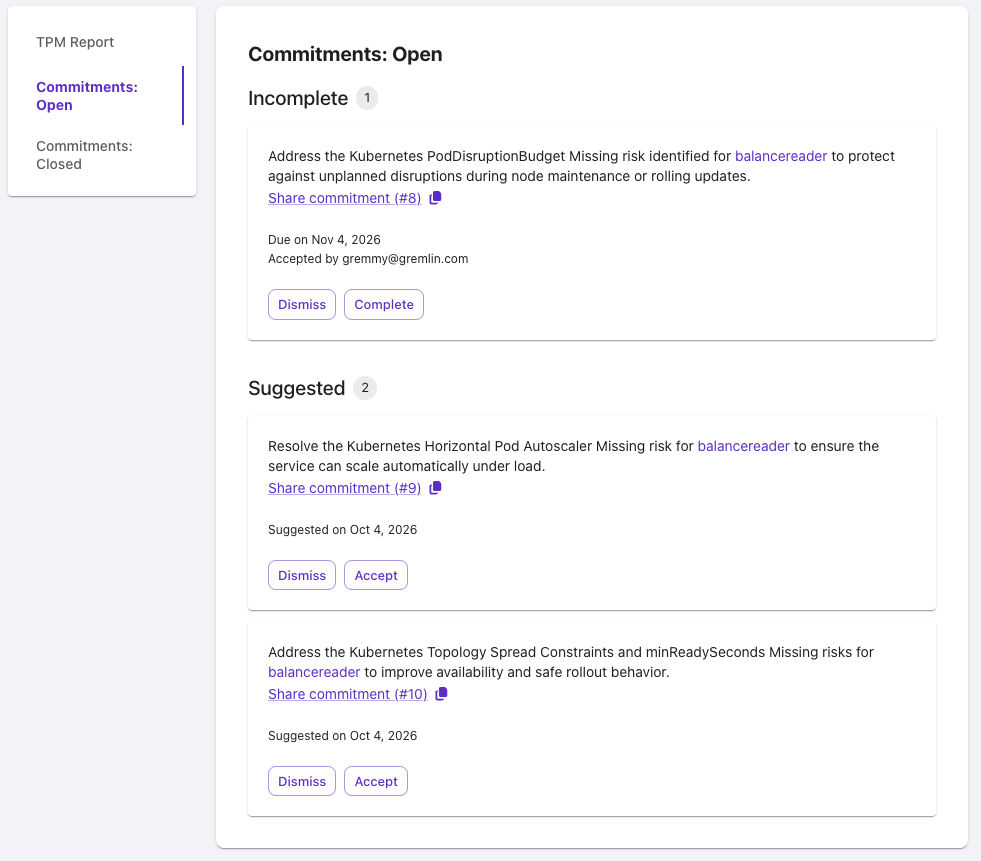
You can also ask Foresight about your Commitments:
- “Show my current open commitments”
- “List my open commitments by priority and severity”
Step 5: Create dashboards to track your reliability progress
You've fixed a risk and set up weekly tracking. Now build a dashboard to track your improvements. A good starting point is to create a dashboard showing your overall reliability score and per-service scores. To do this:
- Click the Chat bar at the top of the Foresight page.
- Describe the dashboard you want. For example: "Create a dashboard tracking my team's overall reliability score and per-service reliability scores over the past 6 months."
- Click Save to team dashboards to save the dashboard to the Dashboards tab.
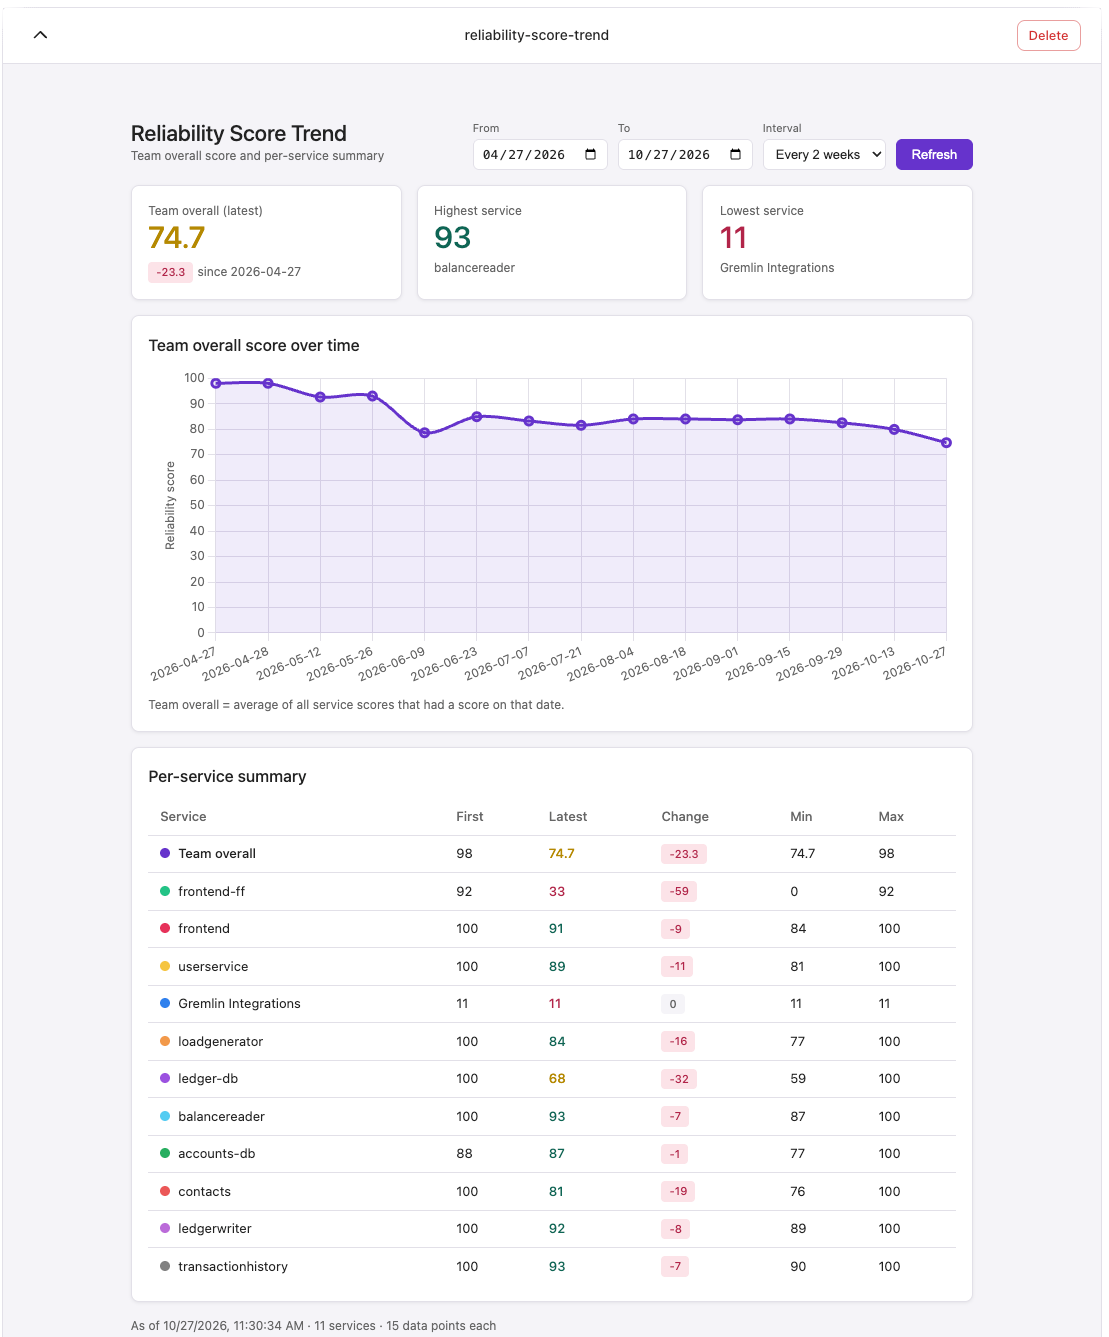
The next time you expand this dashboard, it will automatically refresh with up-to-date information.
Do more with Foresight
You've nowonboarded services, received a prioritized list of risks, verified fixes, scheduled a weekly TPM report, and created a dashboard to track your progress. Together, these create a repeatable loop: Foresight finds risks, your team fixes them, and Foresight confirms each fix and reports the result.
To keep building on that loop:
- Onboard your remaining services and attach Health Checks so Foresight can test them.
- Update your TPM goals as your reliability targets change.
- Share saved dashboards with leadership to show reliability trends over time.
If you aren’t sure whether Foresight supports a task, just ask it! Foresight knows its own capabilities and tells you when a request falls outside them.
Avoid downtime. Use Gremlin to turn failure into resilience.
Gremlin empowers you to proactively root out failure before it causes downtime. See how you can harness chaos to build resilient systems by requesting a demo of Gremlin.