
Managing Kubernetes node drains with Pod Disruption Budgets
Kubernetes normally excels at preserving uptime during maintenance tasks, but it’s not always perfect. Even something as benign as consolidating nodes after a traffic spike could take your application offline if not done carefully. This is where PodDisruptionBudgets (PDBs) come in.
In this blog, we’ll explain why PDBs are important, what the risks are of not implementing them, and how you can find out which of your own deployments are missing PDB definitions.
What is a pod disruption?
A disruption is any event that interrupts a pod’s ability to run. Hardware failures, out-of-memory evictions, and cloud provider outages might come to mind: these are involuntary disruptions, which you have little to no control over. But if a pod goes down because someone or something took deliberate action, that’s a voluntary disruption. Voluntary disruptions include:
- Draining nodes for replacement, upgrading, or downscaling.
- The cluster autoscaler consolidating workloads onto fewer nodes.
- Migrating pods to make room for other pods that need a resource on the node.
A common misconception is that PDBs govern rolling updates to Deployments or StatefulSets. Pods removed during a rolling update count against a PDB, but the Deployment and StatefulSet controllers aren’t limited by PDBs. PDBs work through Kubernetes’ eviction API, while these controllers delete pods directly. The same applies to Horizontal Pod Autoscalers (HPAs).
What is a pod disruption budget, and why is it important for reliability?
A PDB restricts the number of pods that can be unavailable simultaneously for a given deployment during a voluntary disruption.
Kubernetes has no way of knowing which of your pods are load-bearing. If you ask it to drain a node, it will evict everything on the node. If your pod replicas happen to be spread evenly across the cluster, this isn’t a problem. But if your replicas happen to be consolidated on a single node, you can lose the entire service. PDBs help catch scenarios like these and prevent evictions from proceeding until your pods can migrate to other nodes.
For example, imagine we’re hosting a web application in an Nginx pod with four replicas for redundancy:
We want to ensure that we always have at least three replicas in order to meet our latency service level objective (SLO), so we’ll create a PDB:
Let’s break down each of these fields:
maxUnavailablecaps the number of pods that can be unavailable during a voluntary disruption. Alternatively, you can useminAvailableto set the minimum number of pods that must be available. Both properties also accept percentages in the form of strings (e.g.maxUnavailable: "50%").selectordetermines which pods the PDB will apply to. An empty selector matches every pod in the namespace, so scope this carefully.unhealthyPodEvictionPolicydetermines when Kubernetes considers unhealthy pods for eviction.IfHealthyBudget(the default) only allows an eviction ifcurrentHealthyis at or abovedesiredHealthy. The other option,AlwaysAllow, permits it regardless.
After applying the PDB, you can validate it by running kubectl get pdb nginx-pdb:
Validating your pod disruption budget
Imagine our deployment is running on a four-node cluster. Since we didn’t use topology spread constraints to control where and how our pods should be distributed, the Kubernetes scheduler placed three of them on the same node.
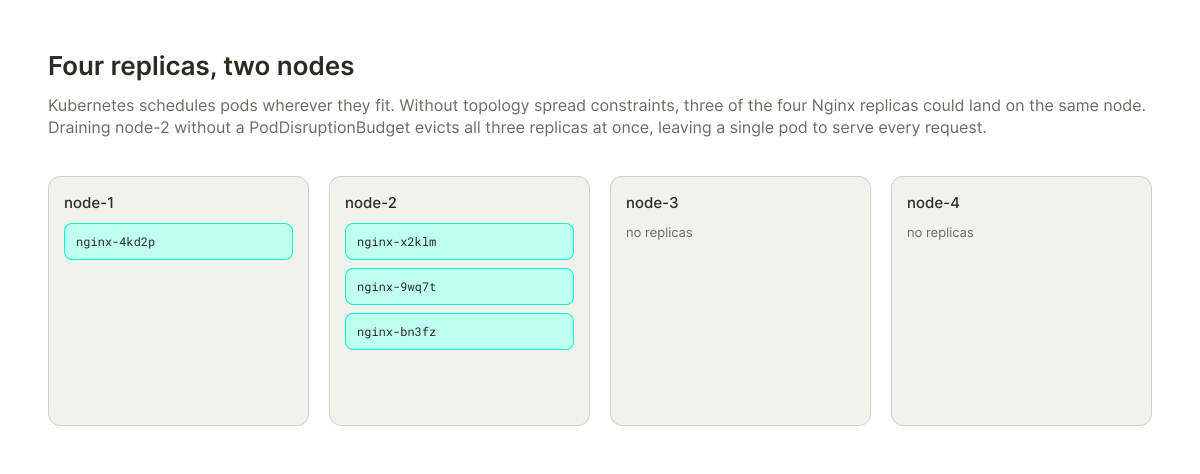
For details about the PDB, run kubectl get pdb nginx-pdb -o yaml:
Under status:
conditionsmaps out changes in the PDB’s state.currentHealthyis the number of healthy pods matching the selector.desiredHealthyis the minimum desired number of healthy pods.disruptionsAllowedis the number of pods that can be disrupted while still satisfying this PDB. SincecurrentHealthyanddesiredHealthyare the same number, this leaves room for zero disruptions.expectedPodsis the number of pods matched by the PDB’s selector.
If we drain the node without a PDB, we’d lose 3/4 of our deployment. But since we defined maxUnavailable: 2, the PDB will evict one pod and stall on the second while Kubernetes deploys replicas onto another node. currentHealthy drops to 3, disruptionsAllowed drops to 0, and the node drain waits for the replacements to become Ready before continuing.
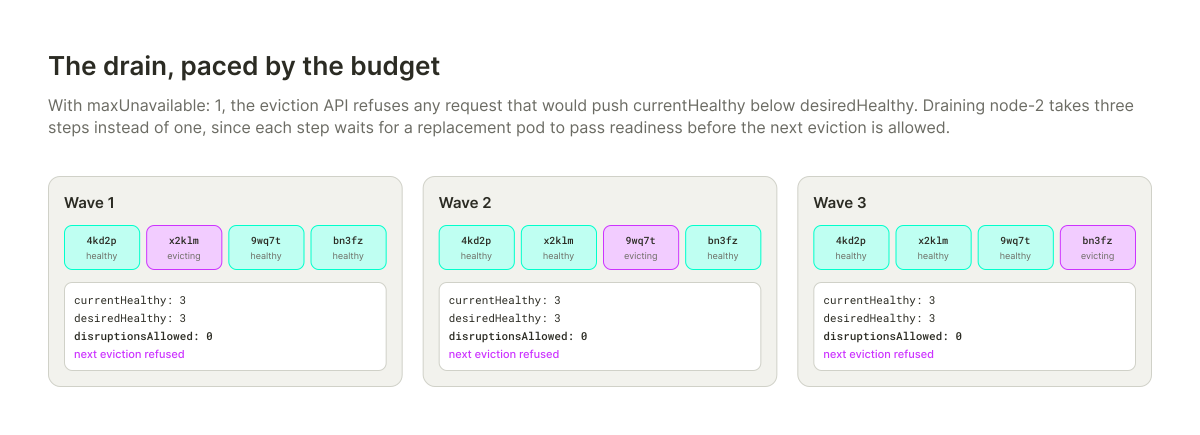
After the new replica becomes available, the PDB allows the eviction to proceed.
How do you decide the parameters for a PDB?
Creating a PDB only takes a few lines; the hard part is choosing the right number of unavailable pods. What’s the smallest replica count that your service can run at while still doing its job? It comes down to three factors: capacity, service level objective (SLO) tolerance, and operational throughput.
Start with capacity. What’s the minimum number of replicas needed to serve your baseline traffic? That becomes your floor. If your normal traffic could be served by two pods, two is your floor. The exception is services that require a certain number of replicas for quorum, like distributed databases and message queues. For those, keep the floor at or above quorum size, and remember that node count isn’t the whole story: for example, a Kafka cluster with three surviving brokers can still refuse writes if a partition drops below its minimum in-sync replicas.
Next, consider your service level objectives (SLOs). If dropping your floor pushes p99 latency past your SLO, the floor is too low. Keep in mind that desiredHealthy guarantees nothing about the remaining pods: they can still crash, get out-of-memory (OOM) killed, or go offline due to a failed node. A PDB only constrains voluntary disruptions. Involuntary disruptions stack on top of whatever the budget already permits.
Last is operational throughput, which is the cost side of the tradeoff. A narrow budget means longer maintenance cycles, since Kubernetes will need to migrate the same number of pods in fewer batches. For example, draining four pods off a node with maxUnavailable: 2 only requires two eviction cycles (two pods per cycle), but maxUnavailable: 1 doubles this to four cycles (one pod per cycle). On large clusters with slow containers, this can be the difference between several minutes and several hours.
How to test that your PDB holds
Choosing a value for a PDB is one thing, and verifying that it works as expected is another. The question isn’t whether the mechanism works (that’s the job of the Kubernetes developers), but whether your service can reliably survive a voluntary disruption.
Start by scaling your deployment to the desiredHealthy target, then perform a load test to replicate peak traffic. If you can maintain your SLOs at that level, then your budget is acceptable. You can also use Gremlin’s blackhole experiment to make pods unreachable, simulating reduced capacity so you can test without modifying your cluster.
Common hurdles when creating PDBs
There are some unexpected “gotchas” when creating PDBs.
Never allow disruptionsAllowed to equal 0 in steady state. If minAvailable equals your replica count, or maxUnavailable is zero, the budget permits nothing. Node drains hang, cluster upgrades stall, and the cluster autoscaler stops consolidating. The failure is silent until the next maintenance window, or an admin checks manually.
Both minAvailable and maxUnavailable round up when using percentages. Rounding up a maximum makes it more permissive, not less. For example, maxUnavailable: "30%" on four replicas allows two evictions rather than one. Calculate the integer equivalent for your minimum, steady, and peak replica counts before committing to a percentage.
Don’t use PDBs for single-replica deployments. A minAvailable: 1 or maxUnavailable: 0 budget on one replica pins disruptionsAllowed to zero. Expect a missing PDB audit to flag every single-replica deployment. The solution, rather than using a PDB, is to add more replicas.
Broken pods can block a drain. With the default IfHealthyBudget policy, a pod that is Running but not Ready can only be evicted while currentHealthy is at or above desiredHealthy. Once the budget is spent, a pod in CrashLoopBackOff can block the drain indefinitely. Setting unhealthyPodEvictionPolicy: AlwaysAllow lets Kubernetes evict these blocking pods. This is best used for stateless services, as stateful services may need the time to catch up on tasks such as replication.
Scope your PDB selector to one service. The broader your selector, the harder it is to calculate your budget. Remember that an empty selector covers every pod in the namespace. Create separate PDBs for each service, even if their rules are identical.
How do you find deployments with missing PDBs?
PDBs bind by label selector, so there’s no direct way to identify pods without them. Instead, you can work backwards by collecting every PDB selector in the namespace, then listing pods that match none of them:
There are two things to note with this script:
- It only evaluates
matchLabelsselectors, notmatchExpressions. Any PDB usingmatchExpressionsgets skipped and its pods will show as uncovered. - It lists pods rather than workloads, so each replica appears separately alongside Job and DaemonSet pods.
Once you’ve applied your PDBs, re-run this script to confirm your pods no longer appear in the output.
Manually running this script is fine for starting out, but running this per namespace or per service doesn’t scale. Gremlin includes a Detected Risk that automatically scans your cluster for deployments without a PDB. Gremlin surfaces this risk, along with many other reliability risks, in one report so you can see exactly which services are exposed.
Other Kubernetes risks to watch for
PDBs are just one part of a resilient Kubernetes deployment. Pods that are unevenly distributed, slow to start, or missing resource requests carry more hidden risks. To learn how to protect against these, check out our comprehensive ebook, Kubernetes Reliability at Scale.
In the meantime, if you'd like a free report of your reliability risks in just a few minutes, you can sign up for a free 30-day Gremlin trial, or use Gremlin's Detected Risks feature to automatically scan your existing Kubernetes deployments for missing pod disruption budgets.
K8s Reliability at Scale
To learn more about Kubernetes failure modes and how to prevent them at scale, download a copy of our comprehensive ebook
Get the Ultimate Guide
Optimizing Kubernetes pod deployments for reliability with topology spread constraints
Topology spread constraints control how Kubernetes replicates pods across failure domains, like zones and regions. Learn how they work in this blog post.

Topology spread constraints let you determine how Kubernetes spreads pod replicas across failure domains, such as availability zones and regions. This blog explains how they work, how to configure them, and how to scan for missing constraints.
Read moreManaging slow container starts with Kubernetes readiness probes
Pods without readiness probes are like engineers without coffee. Learn how readiness probes work, why they’re important, and how to configure them correctly.

Pods without readiness probes are like engineers without coffee. Learn how readiness probes work, why they’re important, and how to configure them correctly.
Read moreHow to ensure your Kubernetes Pods have enough CPU
How much CPU should you reserve for your Pod containers? Read this blog to learn how Gremlin can detect underprovisioned or missing CPU requests in your Kubernetes clusters.

A common risk is deploying Pods without setting a CPU request. While it may seem like a low-impact, low-severity issue, not using CPU requests can have a big impact, including preventing your Pod from running. In this blog, we explain why missing CPU requests is a risk, how you can detect it using Gremlin, and how you can address it.
Read more