Prepare for DNS provider outages with Gremlin and Datadog


.svg)
.svg)

 This is an older tutorial
Hosted DNS resolver outages are rare, but when they hit, the impact is global. Take the DynDNS outage caused by a DDOS attack or the recent Cloudflare outage caused by a router misconfiguration. Both outages brought many sites, such as Discord and Shopify, to their knees and left customers unable to talk to their friends or sell products.
If these sites were running redundant DNS providers, they would have not experienced downtime and would have mitigated the lost revenue during these outages. For companies with two providers, it’s important to test failovers frequently to make sure both resolvers are working and that they are synchronized.
However, running two DNS providers adds some costs and complexity to managing systems, so some companies make the conscious decision to not run two providers. For those companies, it’s important that their teams are prepared to recognize the signs of an outage and have a runbook for how to manually failover in the case of an extended outage.
The tricky thing about DNS outages is that server side, things can look just fine. One way to test for a DNS outage is by using Datadog’s integrations with DNS providers, such as Cloudflare, and using synthetics and real user monitoring to make sure customers are able to resolve requests and access your website quickly, while watching for a drop in traffic or no responses to requests. For this tutorial, we’re going to build our own synthetic monitor using Datadog’s agent with the HTTP and DNS checks enabled. This will allow us to experiment on our production systems without affecting customers. We’ll walk through the impact and signs of a website (Discord) with a single DNS provider experiencing a provider outage, and a two provider website (Etsy) experiencing provider outages.
Prerequisites
- An Ubuntu 16.04 Server (we used an AWS instance, but a bare metal or virtual machine or will work)
- A Datadog account (sign up here)
- A Gremlin account (request a free trial)
Step 1: Install a Datadog agent and add DNS and HTTP monitoring
For most installations, Datadog has its infrastructure monitoring down to a single line install. For Ubuntu, check out: https://app.Datadoghq.com/account/settings#agent/ubuntu. My install looked like this:
The Datadog agent comes with DNS and HTTP checks build in, we just need to turn them on. Once the agent is up and running, add DNS and HTTP checks. First, edit the DNS configuration:
And add a DNS check for discord.com (or your website) under instances:
Then, we’ll edit the HTTP check file.
Add a check for discord.com:
Restart the Datadog Agent:
Step 2: Setup a Datadog dashboard and baseline
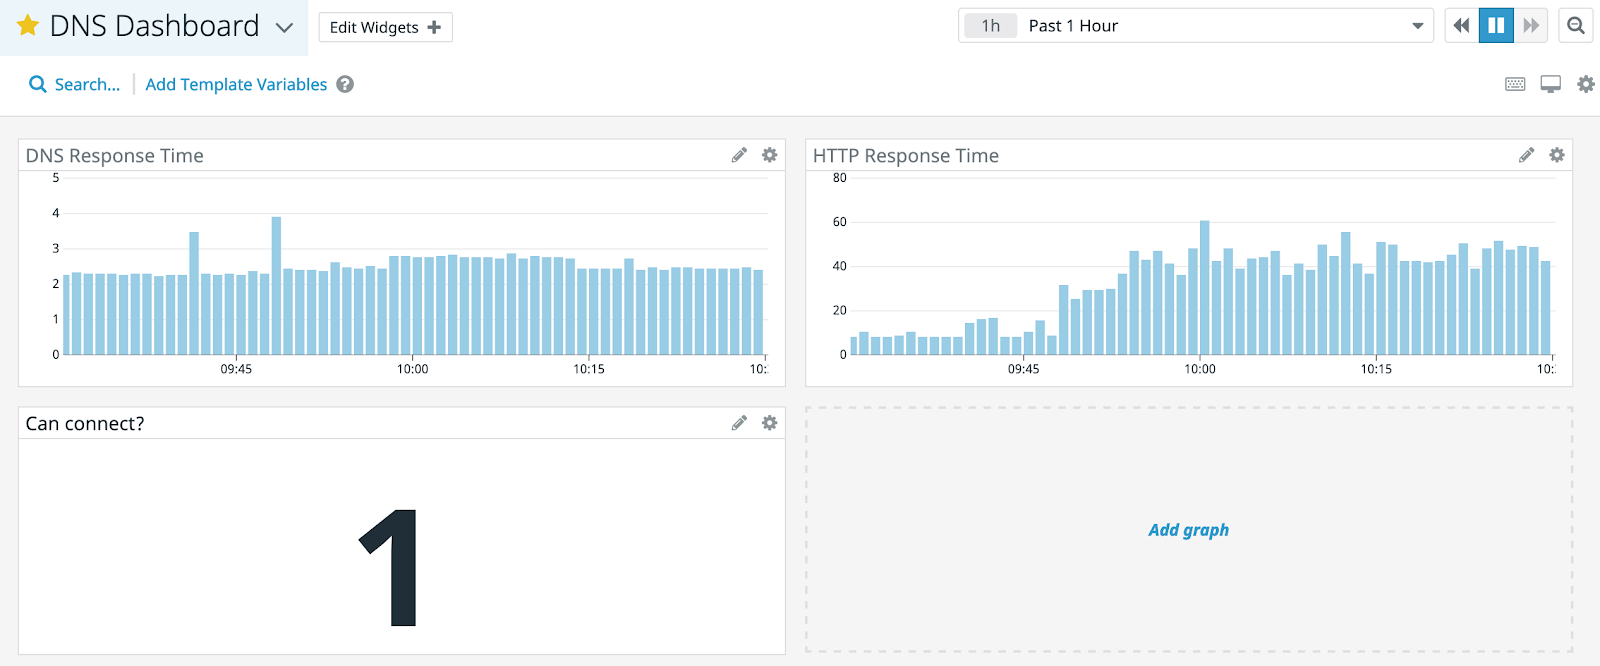
We’re going to add a dashboard that shows the connectivity to Discord. We’ll add 3 graphs:
- DNS response time - how long does it take to resolve the IP address (162.159.138.232) of discord.com
- HTTP response time - how long does it take to get a HTTP response, in this case a GET request to discord.com
- Can connect - is the agent able to connect to discord.com
Go to your Datadog controller https://app.Datadoghq.com. In the left nav bar, go to Dashboard -> New Dashboard -> Timeboard.
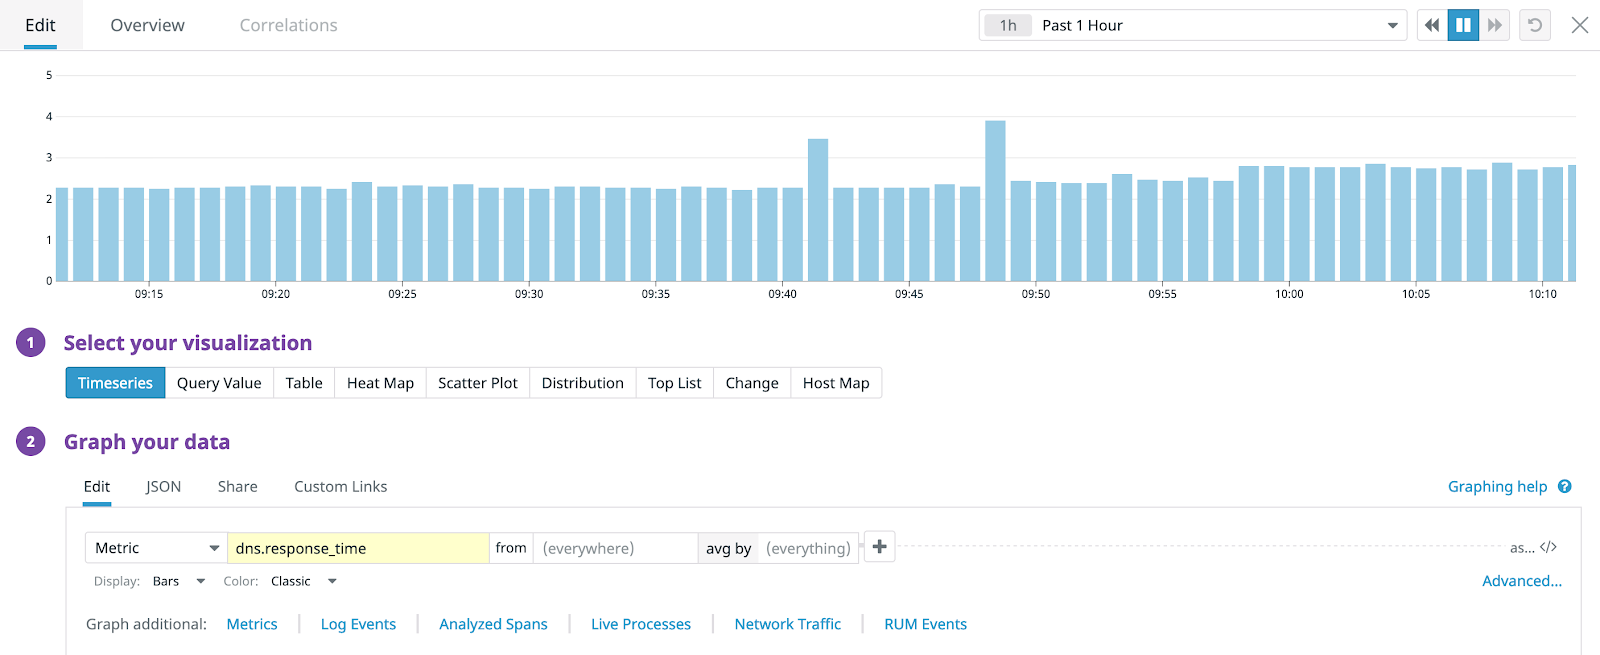
Click Add graph -> Time series. Change the Metric to <span class="code-class-custom">dns.response_time</span> and change the display to “Bars”. Bars will help us show gaps in responses where lines would smooth out. Change the name to<span class="code-class-custom"> DNS Response Time</span>.
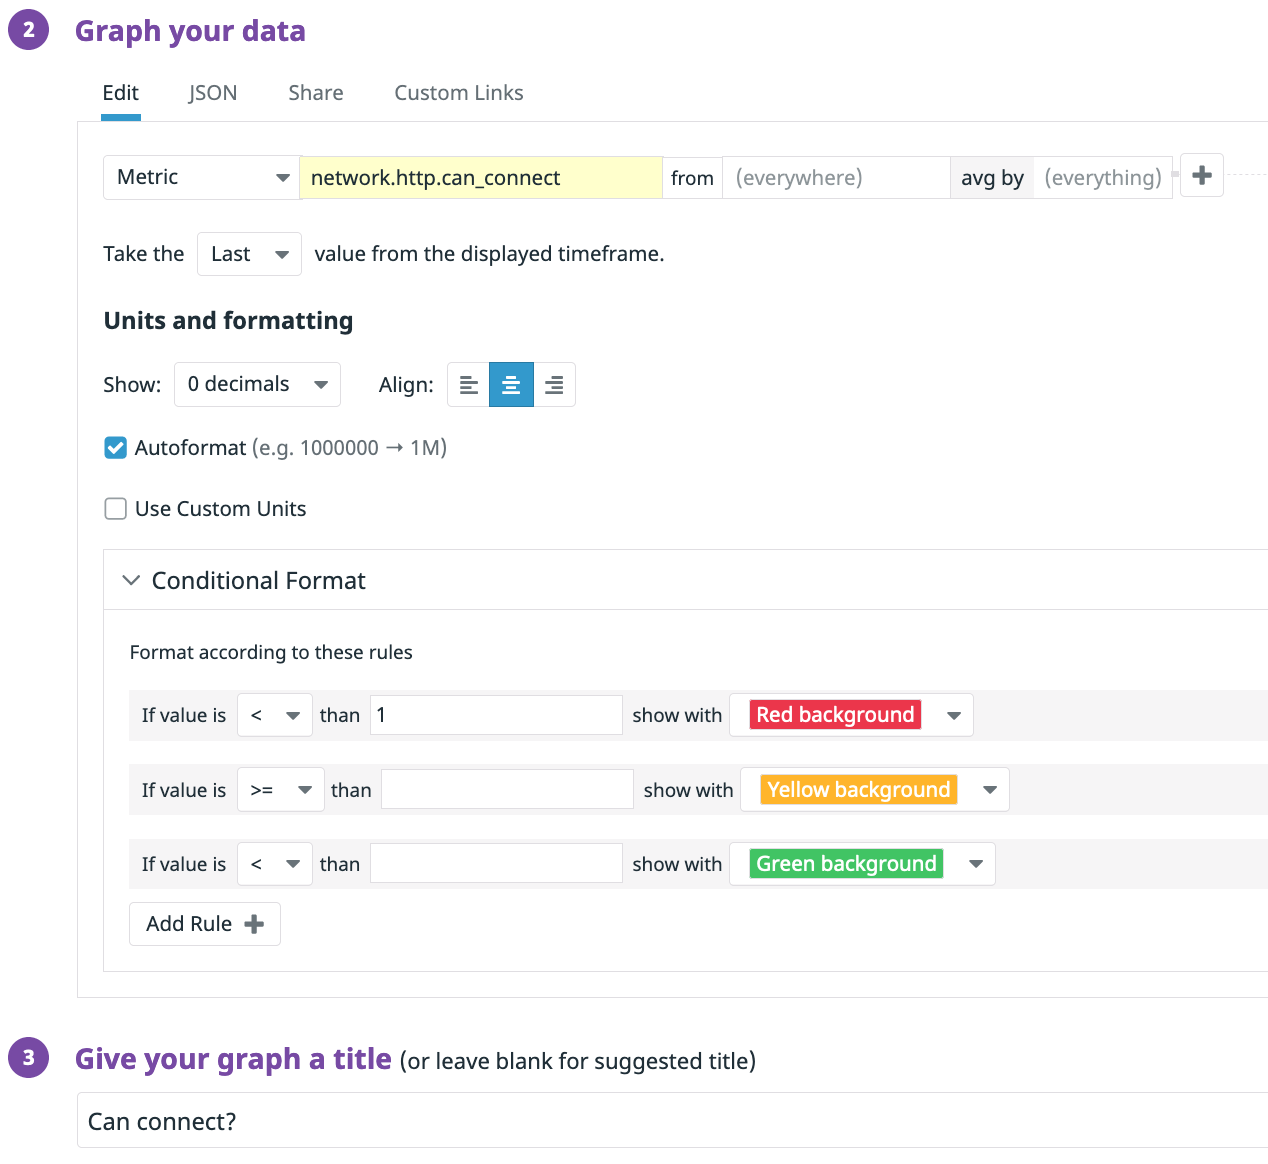
Add 2 more graphs. For the first, add a time series chart and use the metric <span class="code-class-custom">network.http.response_time</span> as bars and with the title HTTP Response Time. For the second, we’ll add a query value chart. Set the metric to <span class="code-class-custom">network.http.can_connect</span>, Take the Last, and set a red threshold to <1 and change the title to Can connect?.
Now we have a dashboard to show off the response time of discord.com. Check the baseline for the top 2 charts. It looks like DNS responses take just under 2ms and HTTP responses take about 50ms.
If you have the Gremlin Datadog integration on, you can add annotations to show when attacks started and stopped.
Step 3: Add a monitor for downtime
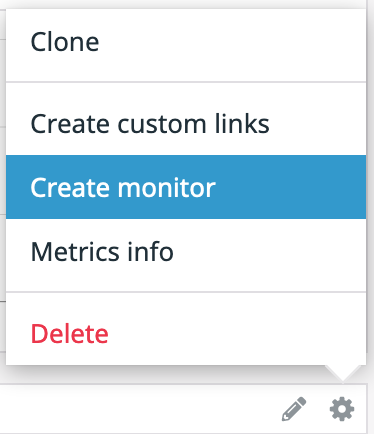
We’ll add an alert for when the site is unreachable. Click on the gear icon in the upper right corner of the “Can connect?” widget. Click “Create monitor”.
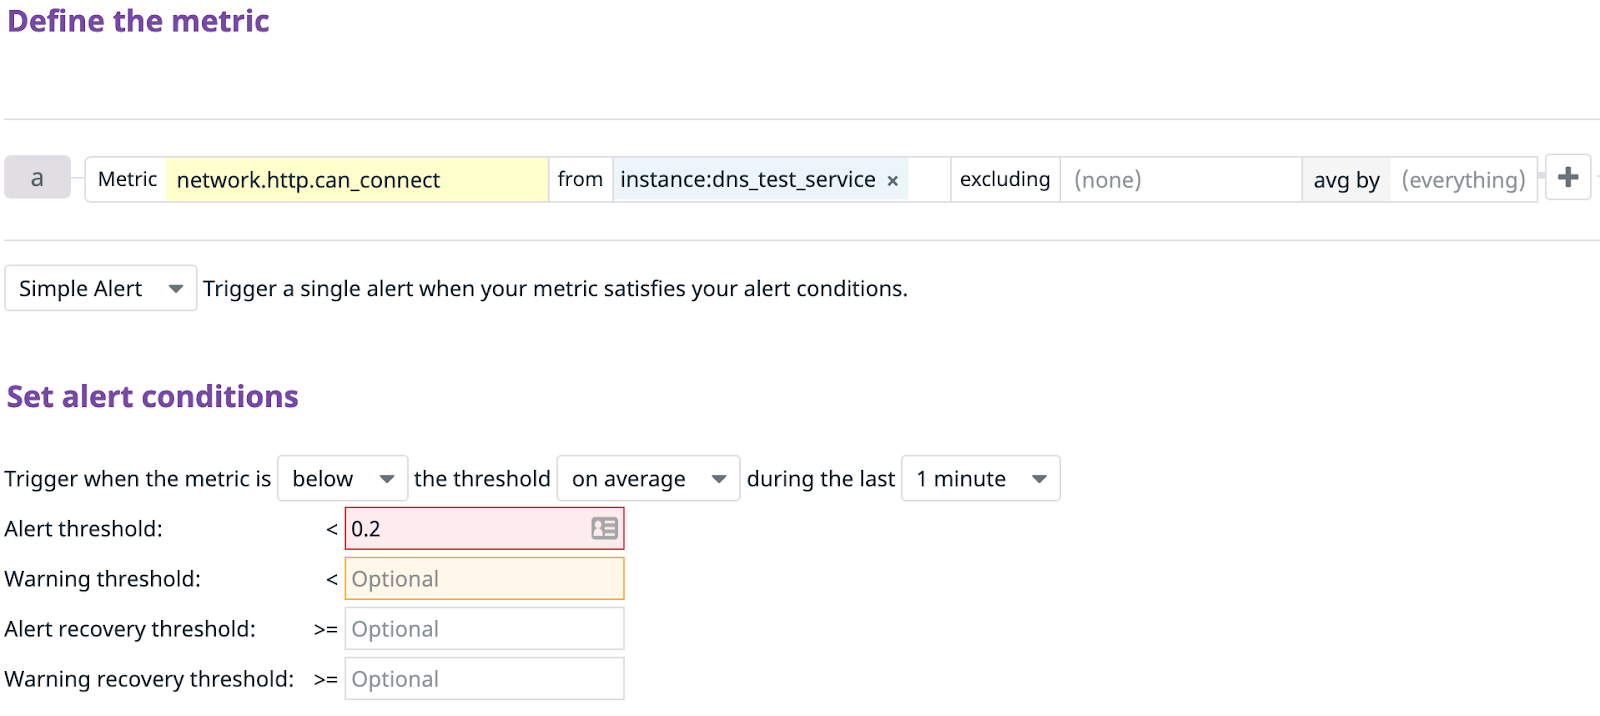
Set the metric to <span class="code-class-custom">network.http.can_connect</span> from {your test server}. Set the alert conditions to trigger when the metric is <span class="code-class-custom">below</span> the threshold <span class="code-class-custom">on average</span> during the last <span class="code-class-custom">1 minute</span> and an alert threshold <<span class="code-class-custom">0.2</span>. These are pretty high fidelity settings, so use Gremlin to tune these alerts to make sure they alert you in time, but not too frequently for false positives.
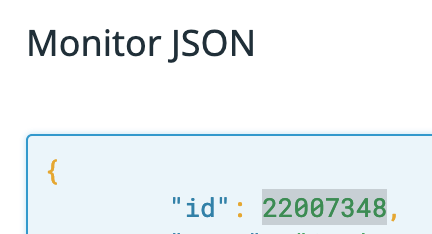
Add a title and body for your alert, then hit “Save.” Click “Export Monitor” and hold on to the id number for use in Experiment 2.
Step 4: Install BIND9 and make it your default resolver
DNS resolvers, such as Google’s 8.8.8.8 or Cloudflare’s 1.1.1.1, act as a middle layer between your server and the name servers, making it difficult to isolate and block a single provider. In order to just block a few name servers, we need to set up our own resolver locally on our machine. Running our own resolver requires maintenance, so it’s advisable to only run this in a throwaway virtual machine or instance. We used LinuxBabe’s tutorial to set BIND9 up as our local resolver on the same machine as our Datadog agent.
Install Bind9 with:
Then start the service:
And enable it at boot:
Then, inside BIND we need to turn on the recursive resolution service. Edit the configuration file:
Inside the “options” after the directions block, add:
And restart BIND to apply the configuration:
Next we need to set our local BIND server as our default resolver:
Confirm that localhost (127.0.0.1) is your resolver with:
It should look like this:
Step 5: Install Gremlin
Now that you are running your own DNS resolver that checks websites for response time and uptime, we’ll install Gremlin on the test server so we can run some attacks. From your Ubuntu server run:
Navigate to Team Settings and click on your Team. Make a note of your Gremlin Secret and Gremlin Team ID. Then initialize Gremlin and follow the prompts:
Your new synthetic is all set up and ready to go!
Experiment 1, Step 1: Gather Discord’s name server addresses
We want to just target a single provider for this exercise. To do that, we’ll use the “dig” utility to see who is the hosted name server provider for Discord. From your Ubuntu server run:
Look for the name server providers:
Then run a dig on those two servers to get their IP addresses:
Look for the “ANSWER SECTION” and grab the IP addresses. The results should look like this:
Save those IP addresses for the next step.
Experiment 1, Step 2: Run a DNS attack to block Cloudflare
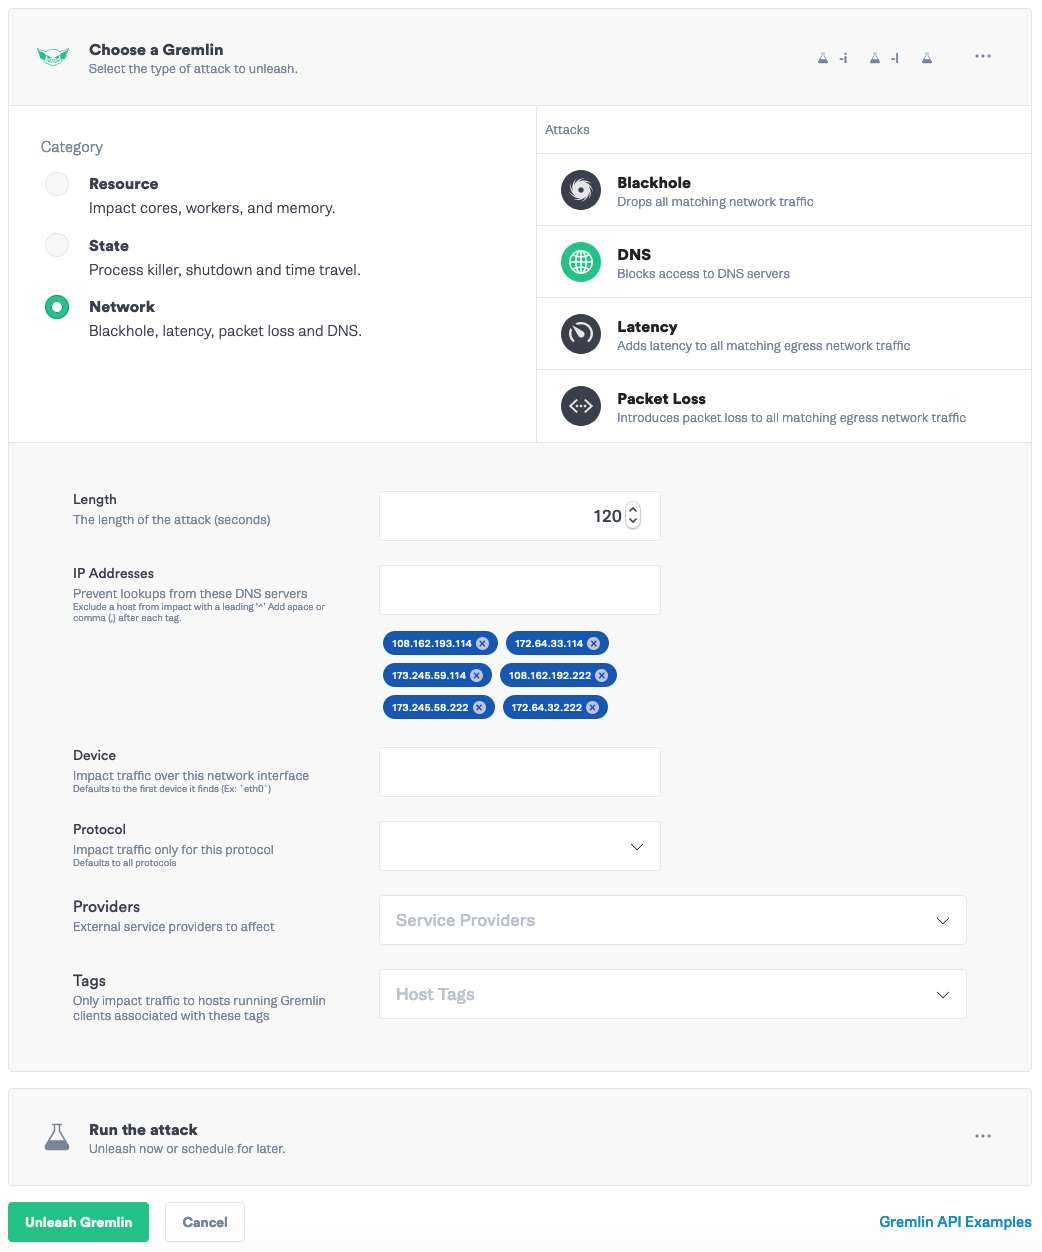
Now we’ll run an experiment to drop all DNS traffic to those IP addresses. In Gremlin, go to “Create Attack”. Select your Ubuntu server. Then go to “Choose Gremlin” -> Network -> DNS. Length <span class="code-class-custom">600</span> seconds, add the 6 IP addresses from the previous step:<span class="code-class-custom"> 108.162.193.114, 172.64.33.114, 173.245.59.114, 108.162.192.222, 173.245.58.222, 172.64.32.222</span>
Click “Unleash Gremlin”. Head over to your Datadog dashboard to see the impact.
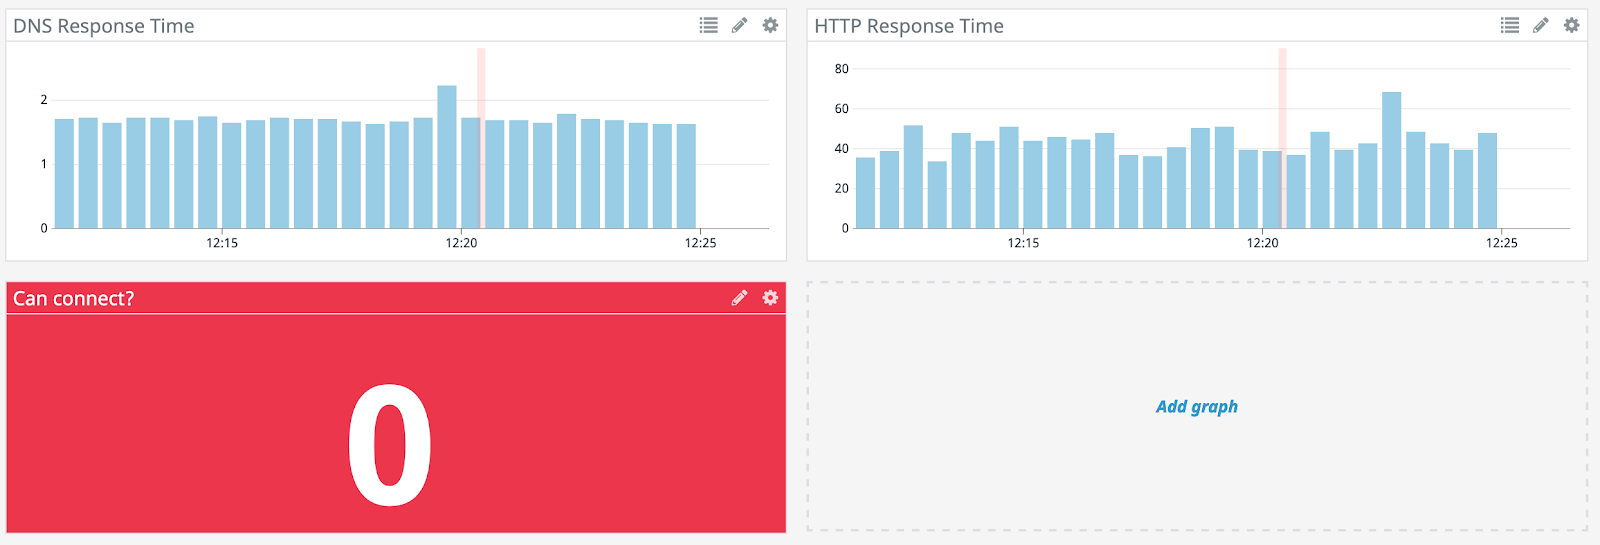
When Datadog moves to 0 for “Can connect?”, head back to Gremlin and hit “Halt” to safely stop and rollback the impact of the attack. You can see it took about 4 minutes for Datadog to pick up the DNS outage. You can shorten that time by tweaking the cache settings in your BIND resolver. We now know our DNS monitoring is working.
Experiment 2, Step 1: Reconfigure the Datadog agent to monitor Etsy
For Experiment 2, we need to grab a website with multiple DNS providers, such as Etsy.com, or your own website if you have redundant providers. Head back to your Ubuntu server and update the Datadog DNS and HTTP listeners to point to <span class="code-class-custom">etsy.com</span>.
Start with the DNS check:
Update the hostname to Etsy.
Then, edit the HTTP check:
Update the URL to point to Etsy.
Restart the Datadog Agent:
Check out the new baseline in Datadog. It looks like the DNS resolving is taking about 2ms, and the HTTP response is taking about 300 ms.
Experiment 2, Step 2: Gather Etsy’s name server addresses
We need to get the IP addresses to block for the DNS attack. Let’s run:
We’ll see 2 different providers, NS1 and AWS’ Route 53:
Let’s get the IP addresses for those name servers.
Look for the “ANSWER SECTION” for each. The results will look like this:
We’ll attack NS1 and then AWS’ Route 53 to make sure if either provider fails, we’ll remain up.
Experiment 2, Step 3: Run a DNS attack Scenario
We’ll create a Scenario with a Status Check to make sure that Etsy (or our website) can handle a 5 minute outage from either provider. Status Checks allow us to run scenarios safely by automatically halting an attack once impact is detected or if the service is already in an alarm state. Head back over to Gremlin and click “Create Scenario”. Give it a name and a hypothesis, such as <span class="code-class-custom">DNS provider outage check</span> and <span class="code-class-custom">The website will stay up, even if one DNS provider goes down</span>.
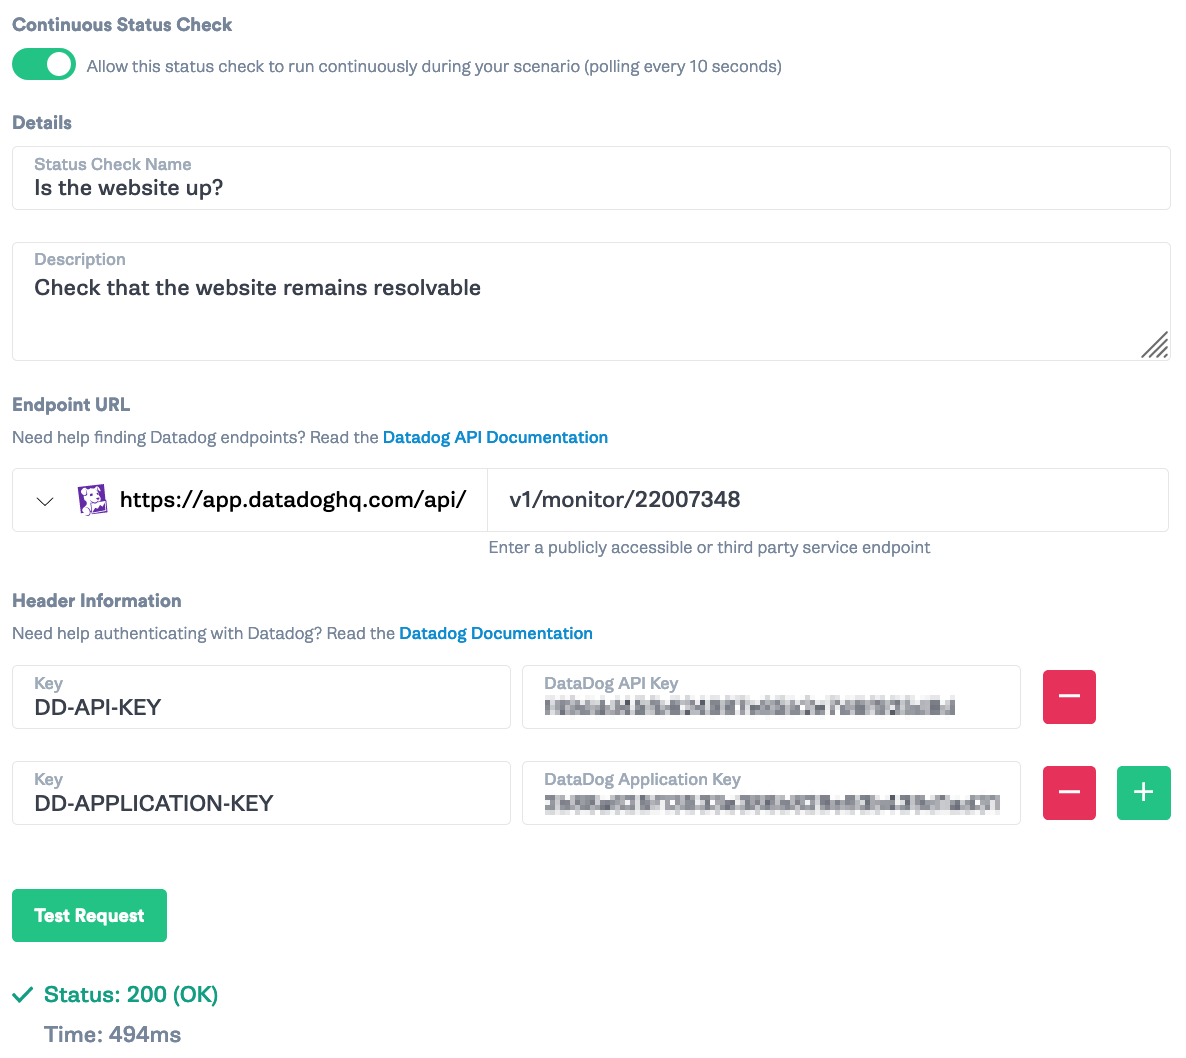
Then, click “Add a Status Check.” Check the “Continuous Status Check” dial. Add a title and description for the Status Check, such as <span class="code-class-custom">Is the website up?</span> and <span class="code-class-custom">Check that the website remains resolvable</span>. Grab the monitor id from Step 3 and add <span class="code-class-custom">v1/monitor/{monitor_id}</span> as the endpoint. Enter your Datadog API key and Datadog Application Key. If you don’t have those, you can get them from Datadog -> Integrations -> APIs. Then click “Test Request” and you should see a green 200 if your alert is currently firing.
Next, we want to make sure that the attack halts if the website is unreachable. Set the Status Code to <span class="code-class-custom">200</span>, Timeout to <span class="code-class-custom">1500</span>, and key:value to <span class="code-class-custom">body.overall_state String = OK</span>. Then add that to the Scenario.

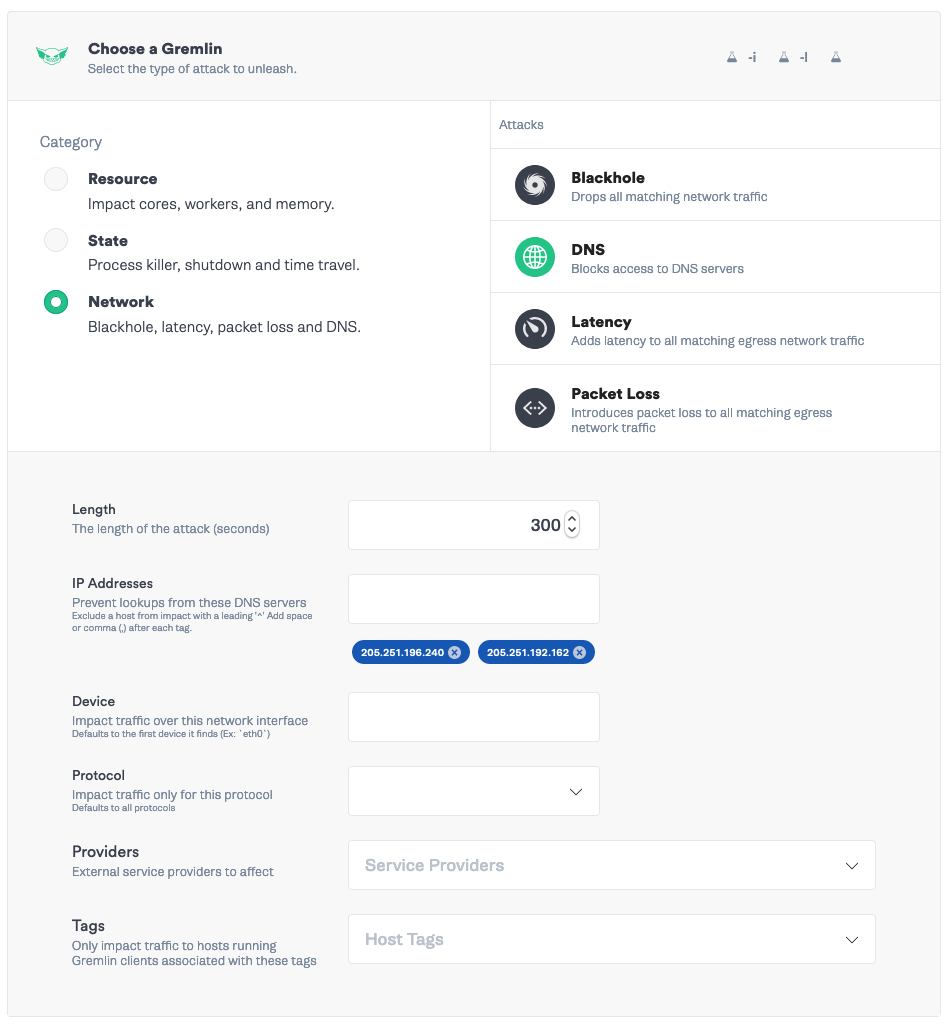
Then click “Add a new attack”. Target your Ubuntu server and select Choose a Gremlin. Select Network -> DNS. Set the length to <span class="code-class-custom">300 </span>seconds, IP addresses to the NS1 IP addresses: <span class="code-class-custom">198.51.44.67, 198.51.44.3.</span> Save the attack.
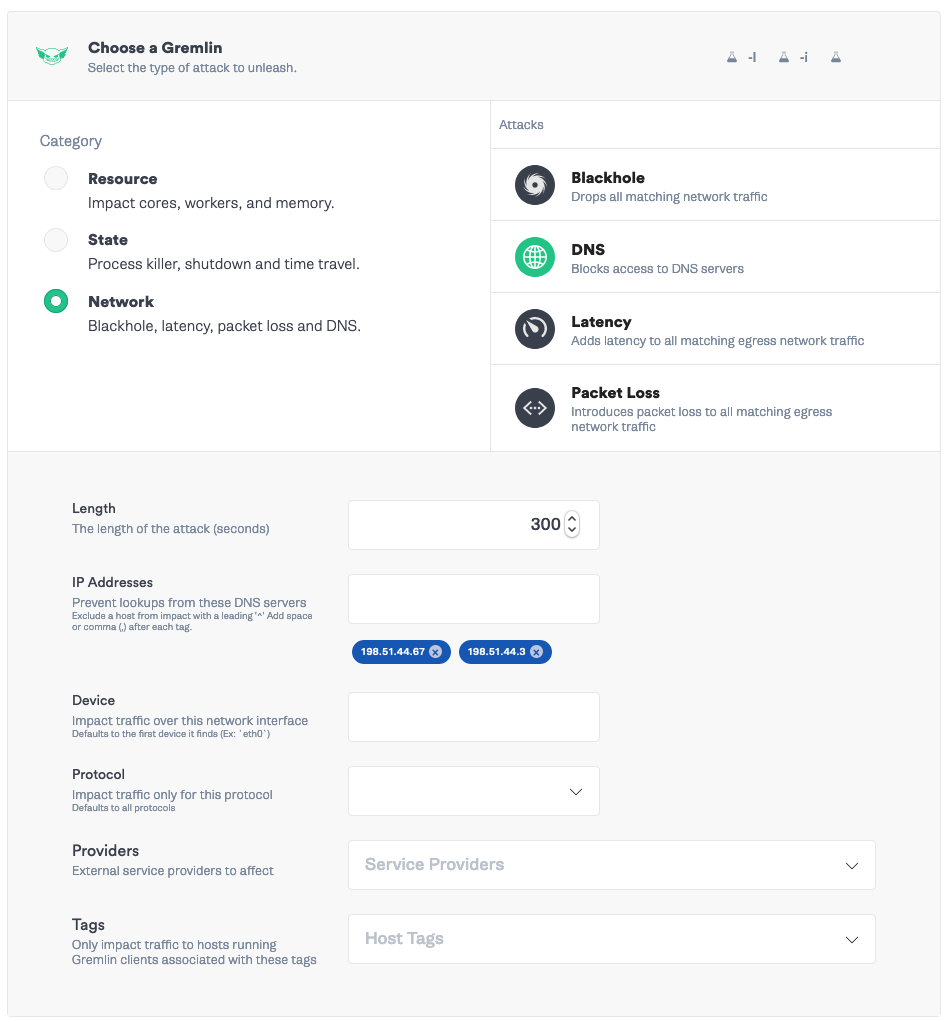
Add a second attack to block the Route 53 servers. Select your Ubuntu server as the target, Network -> DNS attack. Remove the NS1 IP addresses and add the AWS IP addresses:<span class="code-class-custom"> 205.251.196.240, 205.251.192.162</span>. Save the attack.
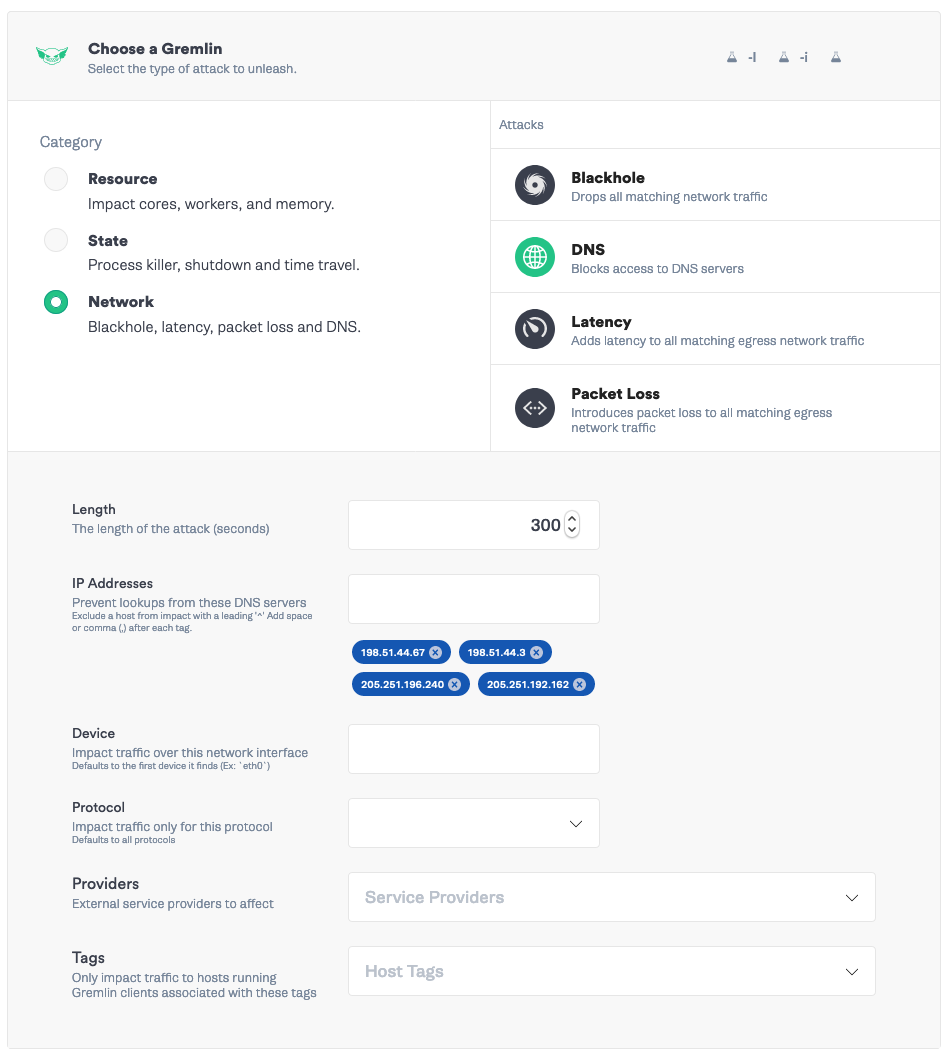
Finally, add a third attack that blocks both providers. Select your Ubuntu server, select Network -> DNS attack. Add both sets of IP addresses: <span class="code-class-custom">198.51.44.67, 198.51.44.3, 205.251.196.240, 205.251.192.162</span>.
Save the Scenario and click Run Scenario. Watch Datadog for any anomalous behavior (while grabbing coffee and watching TV. Testing DNS is not a short process, and the continuous status check will safely stop the experiment if something goes wrong).
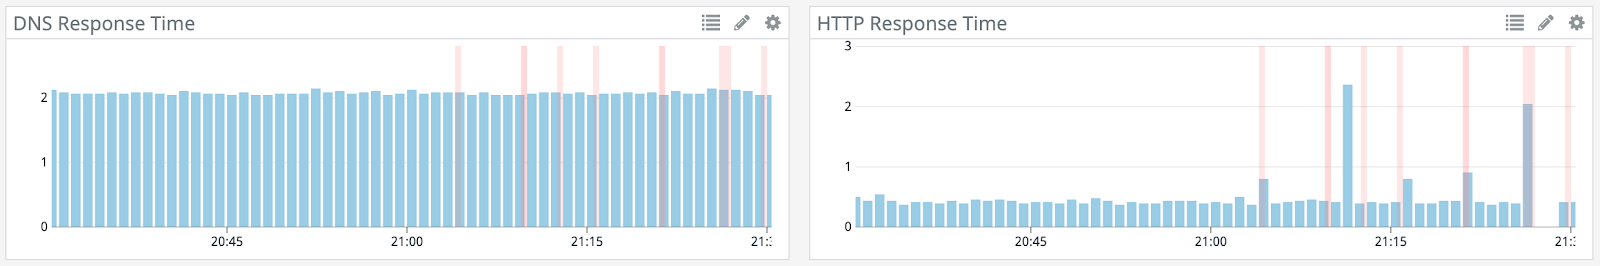
Once the attack halts, head over to the Gremlin Scenario page. Notice we are able to block the connection to NS1 and Route 53 independently and the website remains up, but when we block both, Datadog picks up on the website being unresolvable and fires an alert.

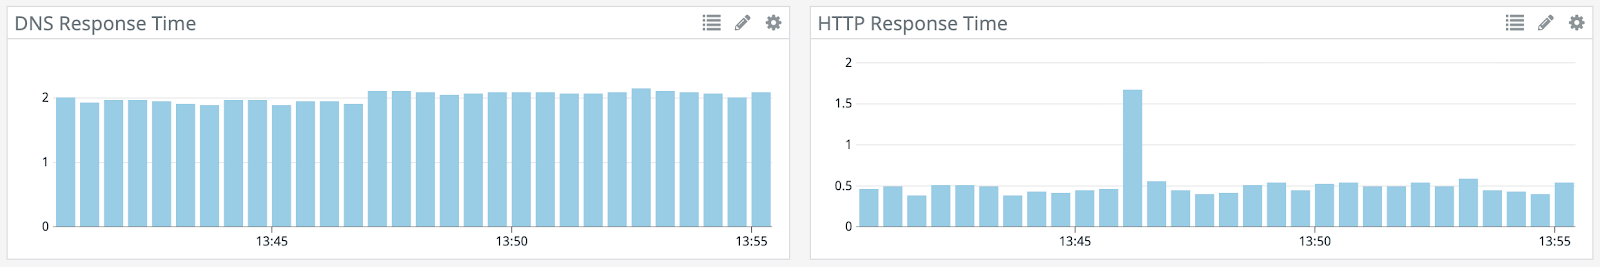
In Datadog, you can see with the second attack, there’s a long HTTP response, but the requests all come through as the name server is switched. With the third attack, however, there’s a gap where the responses fail. The agent is not able to resolve the IP address of Etsy and traffic drops off.
Conclusion
Thanks to Chaos Engineering and Datadog, we’ve confirmed that if Cloudflare goes down, Discord goes down, but if NS1 or Route 53 goes down, Etsy will remain up. This testing allows us to feel comfortable that our reliability mechanisms are in place and working properly. To ensure configuration drift doesn’t lead to a service becoming unreachable, schedule this and other scenarios to run periodically, especially if you rotate IP addresses. Additionally, we now have a server where we can run other client-side Chaos Engineering experiments, to ensure our customers have a seamless experience in spite of common issues like latency.
Avoid downtime. Use Gremlin to turn failure into resilience.
Gremlin empowers you to proactively root out failure before it causes downtime. See how you can harness chaos to build resilient systems by requesting a demo of Gremlin.

.svg)