How to run an experiment on AWS Lambda using Failure Flags and Node.js


.svg)
.svg)

 This is an older tutorial
Introduction
In this tutorial, we'll show you how to run a Chaos Engineering experiment on a serverless application using Failure Flags. Failure Flags lets you run experiments on applications and services, particularly those that limit access to the underlying infrastructure, such as AWS Lambda, Azure Functions, Google Cloud Functions, and others. This includes:
- Adding latency or errors to applications
- Injecting data into function calls without having to edit or re-deploy source code
- Simulating partial outages behind API gateways or reverse proxies
- Customizing the behavior and impact of experiments
For this tutorial, we'll run a Node.js application on AWS Lambda. These same general steps apply to all of our supported platforms and languages, which you can learn about in our documentation.
Overview
This tutorial will show you how to:
- Install the Failure Flags Node.js SDK
- Deploy an application and the Failure Flags agent to AWS Lambda
- Run a latency experiment using Failure Flags
Prerequisites
Before starting this tutorial, you’ll need the following:
- A Gremlin account (sign up for a free trial here).
- An AWS account with access to Lambda.
- ~Note: You can use the lowest-tier x86 or Arm instance for this tutorial to save on costs.
- Node.js installed on your local computer. We also support Go, Python, and Java, but for this tutorial we'll use Node.js.
Step 1 - Set up your application with Failure Flags
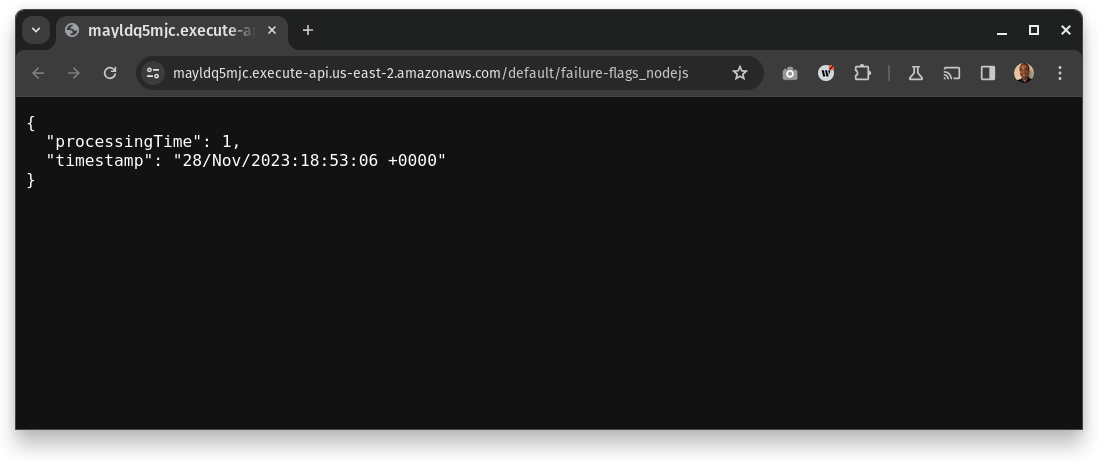
In this step, you'll create a Node.js application and add a Failure Flag. This is a simple application that responds to HTTP requests with the current timestamp and the time needed to process the response.
Lines 6—12 are where we define our Failure Flag. This is an entrypoint where we can inject faults into the application, but it won't do anything unless we have an experiment running. For example, if we run an experiment that introduces 500ms of latency, the application will run normally up to this point, then delay execution by 500ms before continuing. If there are no active experiments targeting this application, nothing will happen and the code will run normally.
At a minimum, we need to give this Failure Flag a name using the name attribute. This example uses http-ingress, but you can change this to whatever you'd like. You can also add custom labels for more advanced targeting (i.e., targeting specific kinds of application traffic), but that's beyond the scope of this tutorial. You can learn more in the documentation.
Step 2 - Download your client configuration file
We need a way to authenticate our Failure Flag with Gremlin. We can do this by creating a file with our Gremlin team ID and secret keys and deploying it alongside our Lambda function. This file can also contain additional labels like the application name, version, region, etc.
- Download your client configuration file from the Gremlin web app and save it in your project folder as <span class="code-class-custom">config.yaml</span>.
- Optionally, add any labels to your configuration file. You can use these labels to identify unique deployments of this application, letting you fine-tune which deployments to impact during experiments. For example, you could add the following block to identify your function as being part of the <span class="code-class-custom">us-east-2</span> region and the <span class="code-class-custom">http-ingress</span> project, letting you target all functions running in <span class="code-class-custom">us-east-2</span> or that belong to the <span class="code-class-custom">http-ingress</span> project:
The configuration file supports other options, but the defaults are all you need for this tutorial.
Step 3 - Deploy your application to Lambda
Now we get to deploy our application to Lambda. This step also includes deploying the Failure Flags Lambda layer. So far, we've been focused on the SDK, which is responsible for injecting faults into the application. The layer is responsible for communicating with Gremlin's backend servers and orchestrating experiments. The specifics of deploying to Lambda go beyond the scope of this tutorial, so we'll link to the AWS docs where necessary.
Step 4 - Run an experiment
Now that everything's set up, we can start running experiments!
- In the Gremlin web app, select Failure Flags in the navigation pane (or click this link).
- Click + Experiment to create a new experiment.
- Enter a name for the new experiment.
- Under Failure Flag Selector, click the combo box to show a list of active applications with Failure Flags that Gremlin detected. If your app doesn't show up, confirm that it's finished deploying on Lambda and has responded to at least one request.
- Optionally, you can add any additional attributes, such as label selectors, in the Attributes box. You can ignore this field for this tutorial.
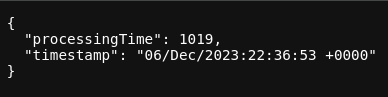
- In the Effects box, specify the impact that you want to have on your app. For example, say we want to add 1000 ms (one second) of latency to each call to this function. We can do this by adding the following JSON to this field:
JSON
- Set the Impact Probability percentage. For now, set it to 100% to ensure that every call to this function gets impacted.
- Optionally, change the Experiment Duration to your preferred time. For now, set it to 5 min so you have plenty of time to observe the impact. You can always stop the experiment using Gremlin's Halt button. Your experiment settings should look like the following screenshot:

- Click Save & Run to start the experiment.

While the experiment runs, open your Lambda URL in a web browser or a performance testing tool. How is it responding? How noticeable is the latency? Is the amount of latency more than you expected (longer than one second)? If so, why do you think that is? How might you rearchitect this app so the latency doesn't have as big of an impact?
When you're finished making observations and want to stop the experiment, simply click Halt this experiment in the Gremlin web app. Remember to throttle or delete your Lambda function when you're done!
Conclusion
Congratulations on running your first serverless Chaos Engineering experiment on AWS Lambda with Gremlin! Now that you have Failure Flags set up, try running different kinds of experiments. Add jitter to your network latency, impact a larger or smaller percentage of traffic, generate exceptions, or perform a combination of effects. For more advanced tests, you can even define your own experiments or inject data into your app.
If you want to learn about the different configuration options available in the Failure Flags SDK, or to see how it works, check out our Github repository. Failure Flags also has language-specific features, but this is currently only available for Go.
If you'd like to try Failure Flags outside Lambda, we also have a sidecar for Kubernetes. Just deploy the sidecar, then define and run your experiment. Remember that Failure Flags has no performance or availability impacts on your application when not in use, so don't be afraid to add it to your applications.
Avoid downtime. Use Gremlin to turn failure into resilience.
Gremlin empowers you to proactively root out failure before it causes downtime. See how you can harness chaos to build resilient systems by requesting a demo of Gremlin.

.svg)