Gremlin Scenarios Walkthrough

.svg)
.svg)

 This is an older tutorial
Gremlin is a simple, safe and secure service for performing Chaos Engineering experiments through a SaaS-based platform. Scenarios is a new Gremlin feature that allows you to map real world outage scenarios to Chaos Engineering experiments.
Prerequisites
- A Gremlin account (sign up here).
- An AWS EKS cluster with the Hipster Shop application running. You can set it up using this tutorial.
If you're not able to set up an EKS cluster, you can still follow along with the tutorial using your own hosts or containers. The info on what you target when you run the scenarios will be different. You can find info on installing Gremlin agents in the Quick starts on the Gremlin Docs site.
Overview
This tutorial will walk you through using Gremlin Scenarios.
- Step 1 - Create and run a Custom Scenario
- Step 2 - Run a Recommended Scenario
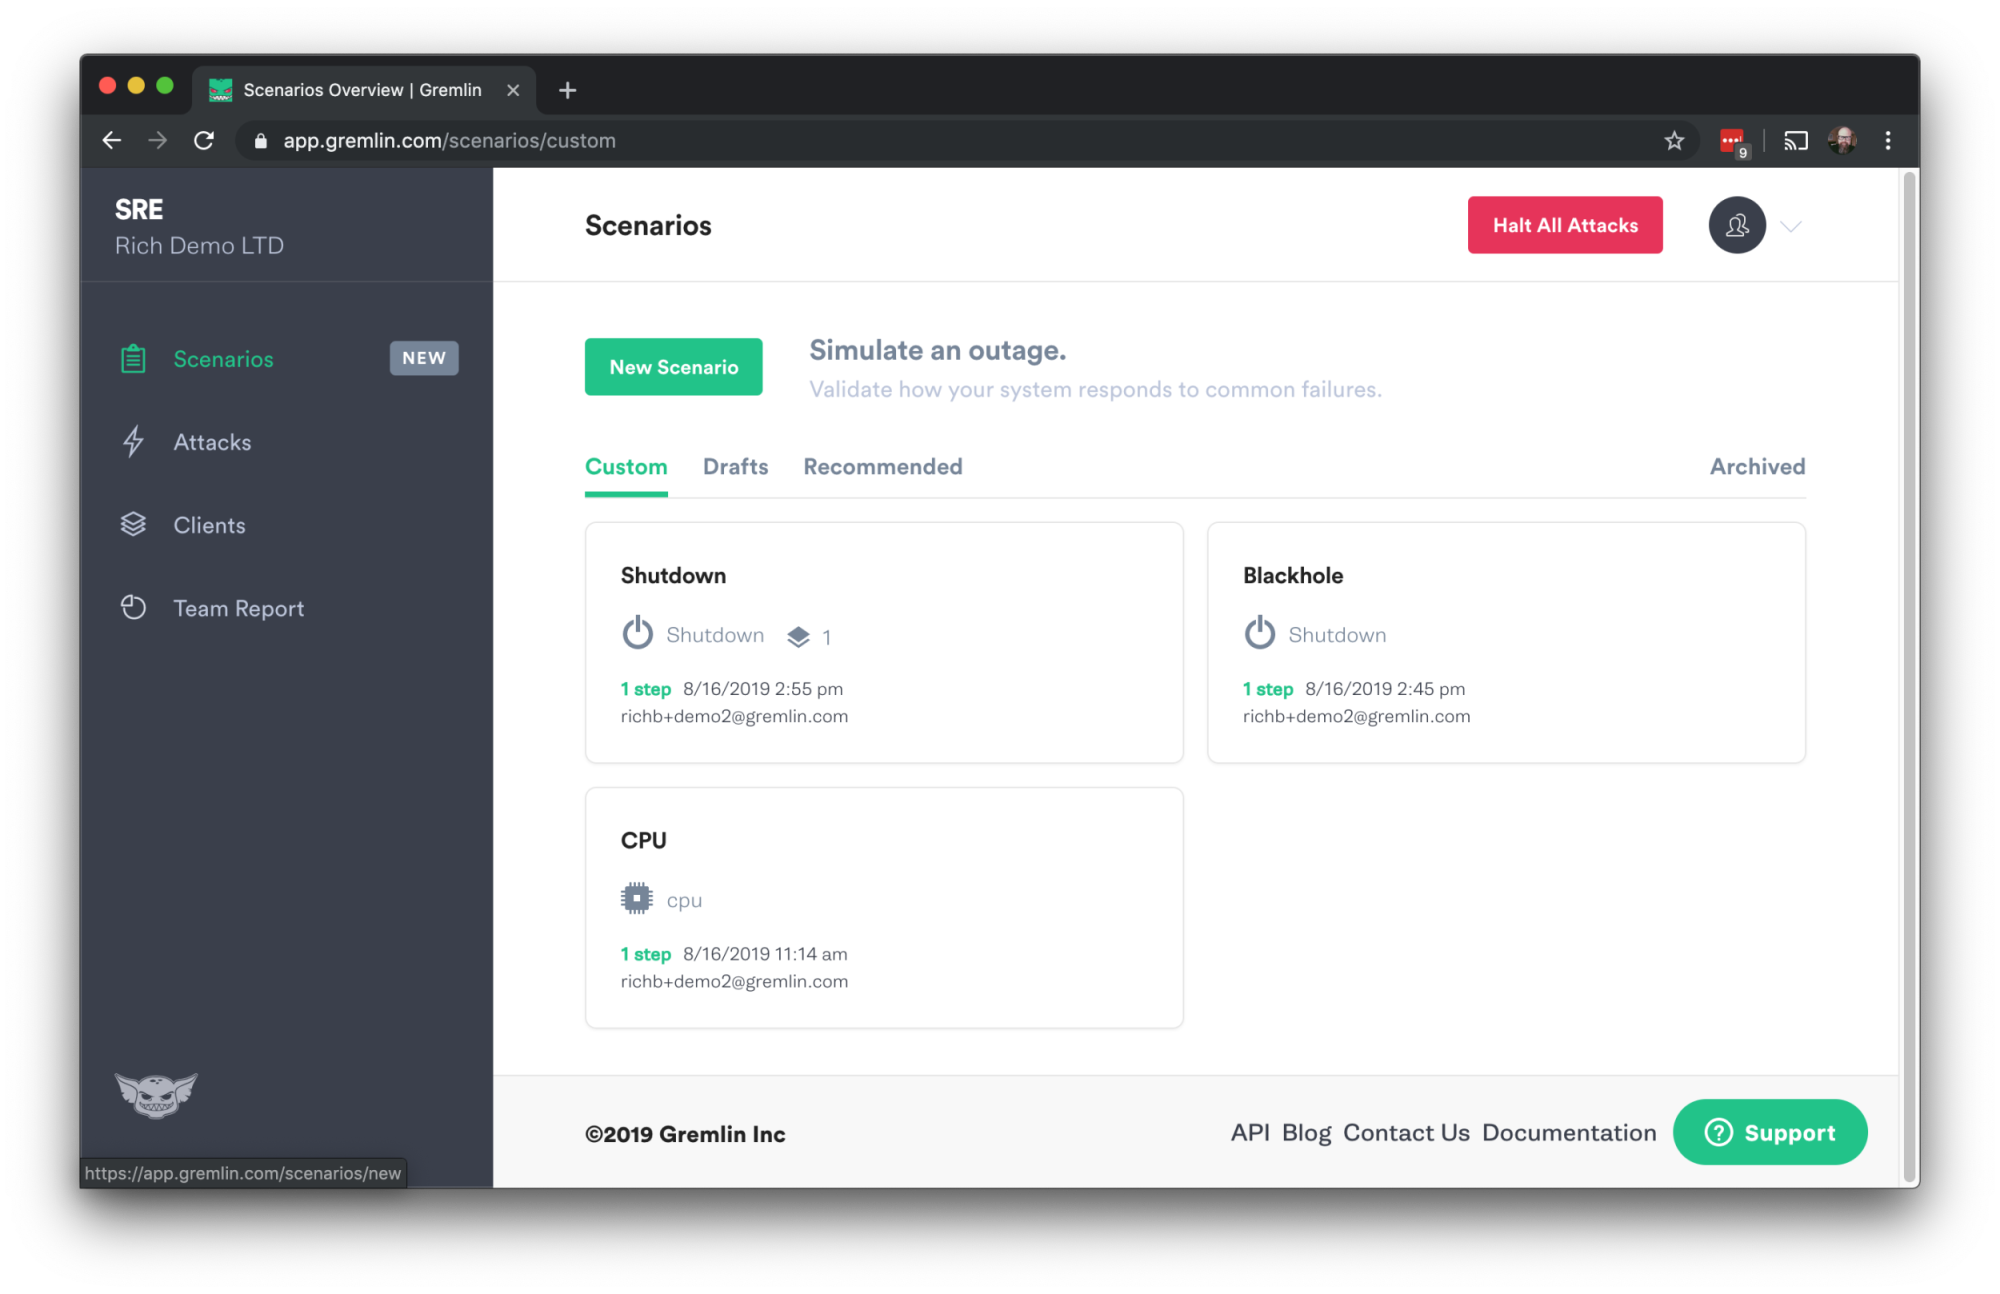
Step 1 - Create and run a Custom Scenario
Custom Scenarios allow users to define their own Scenarios. We will create a Custom Scenario now.
Click on Scenarios in the left navigation bar, and the New Scenario button in the upper left.
Add a Name, Description and Hypothesis. All three are required. The Hypothesis is what we expect the result of the experiment to be.
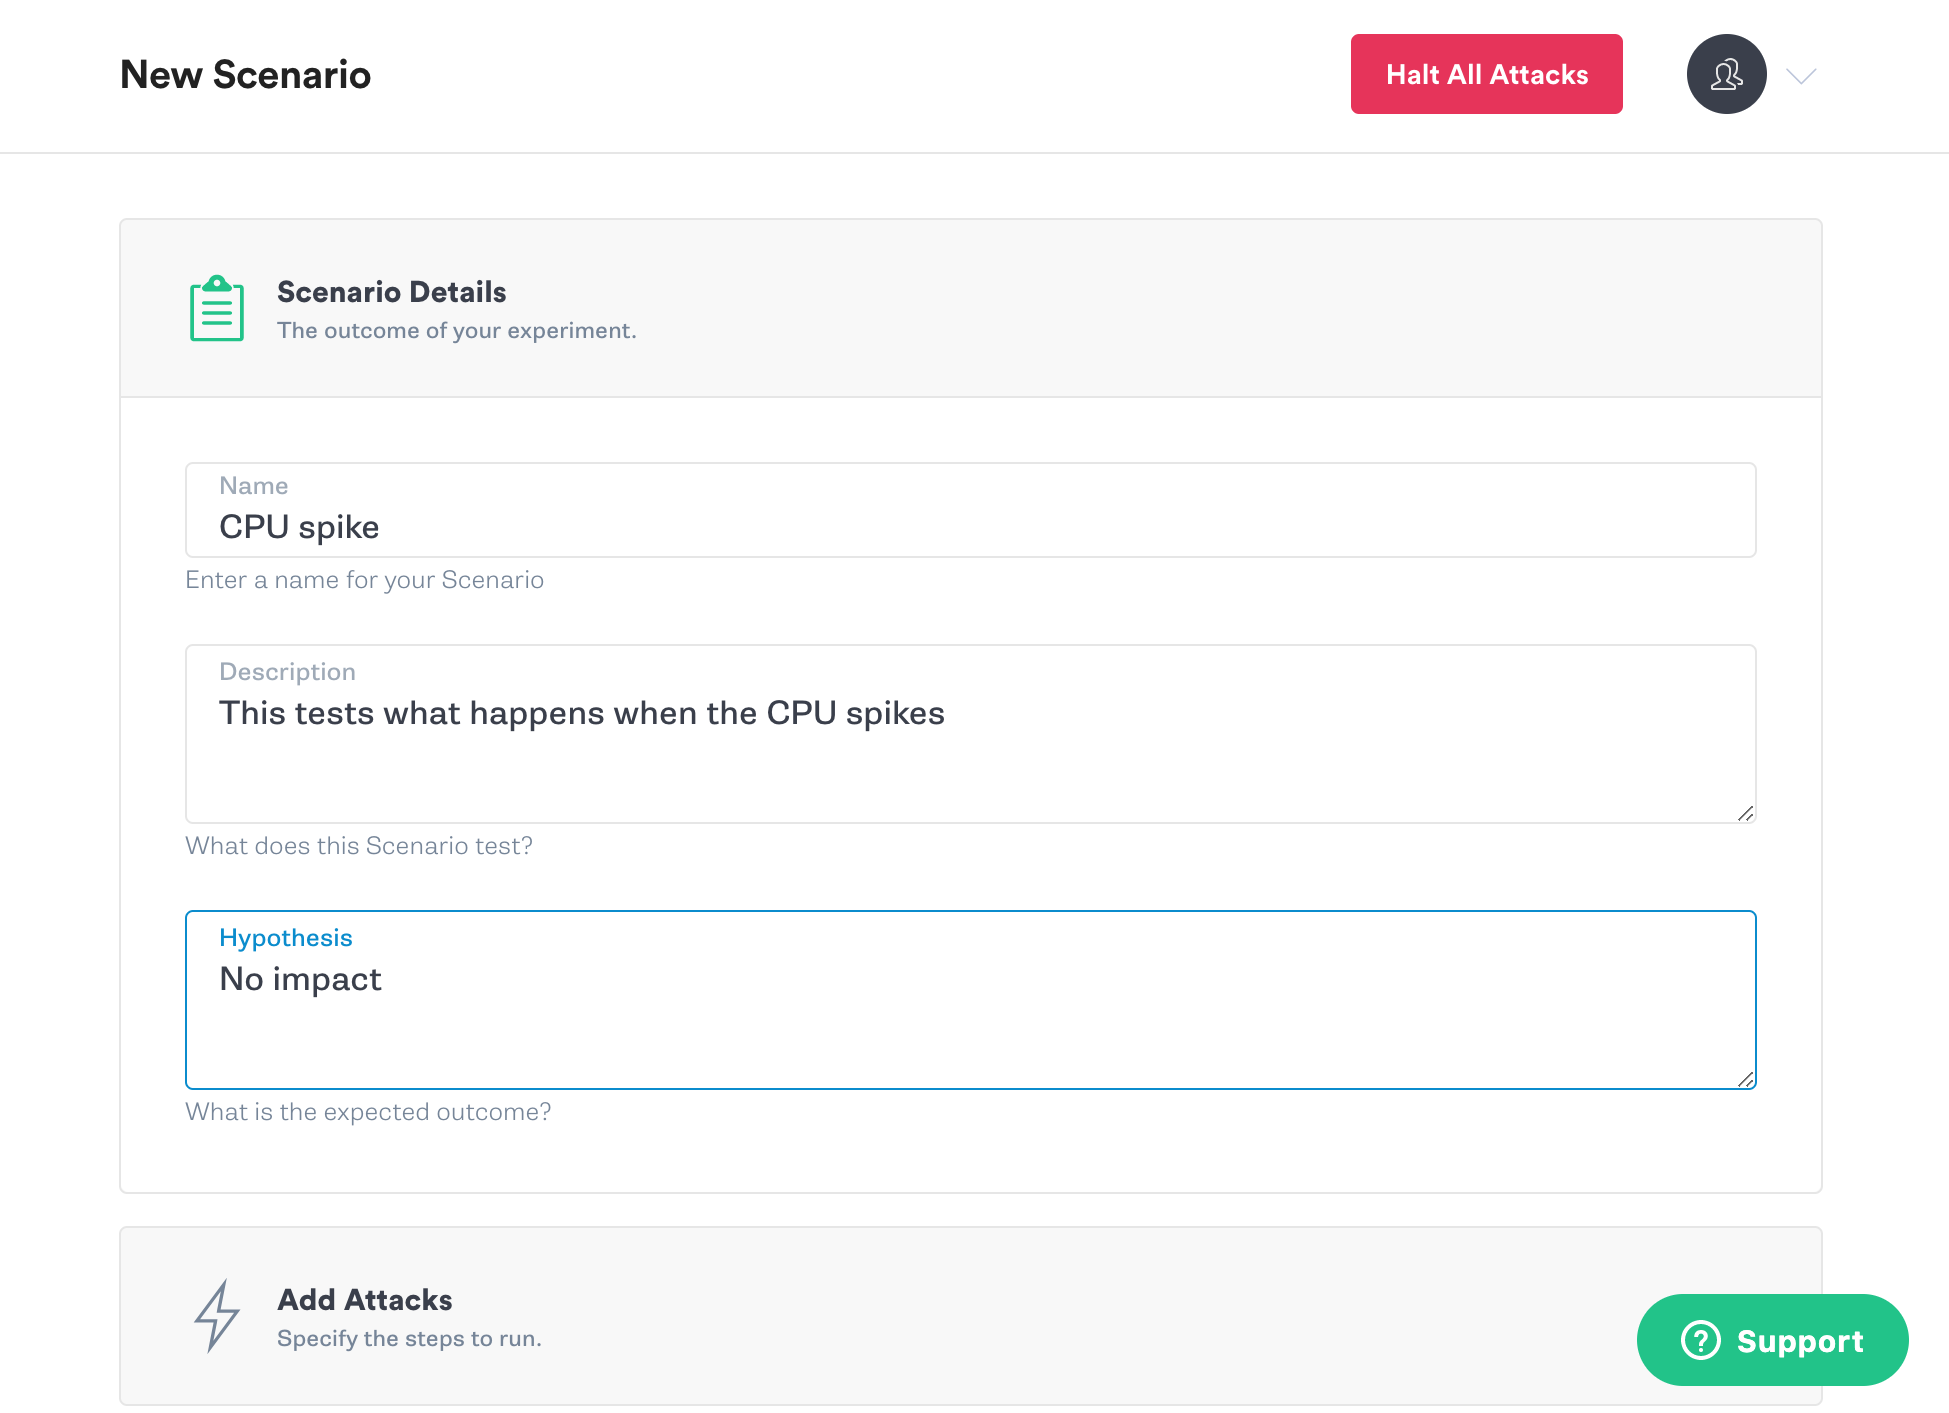
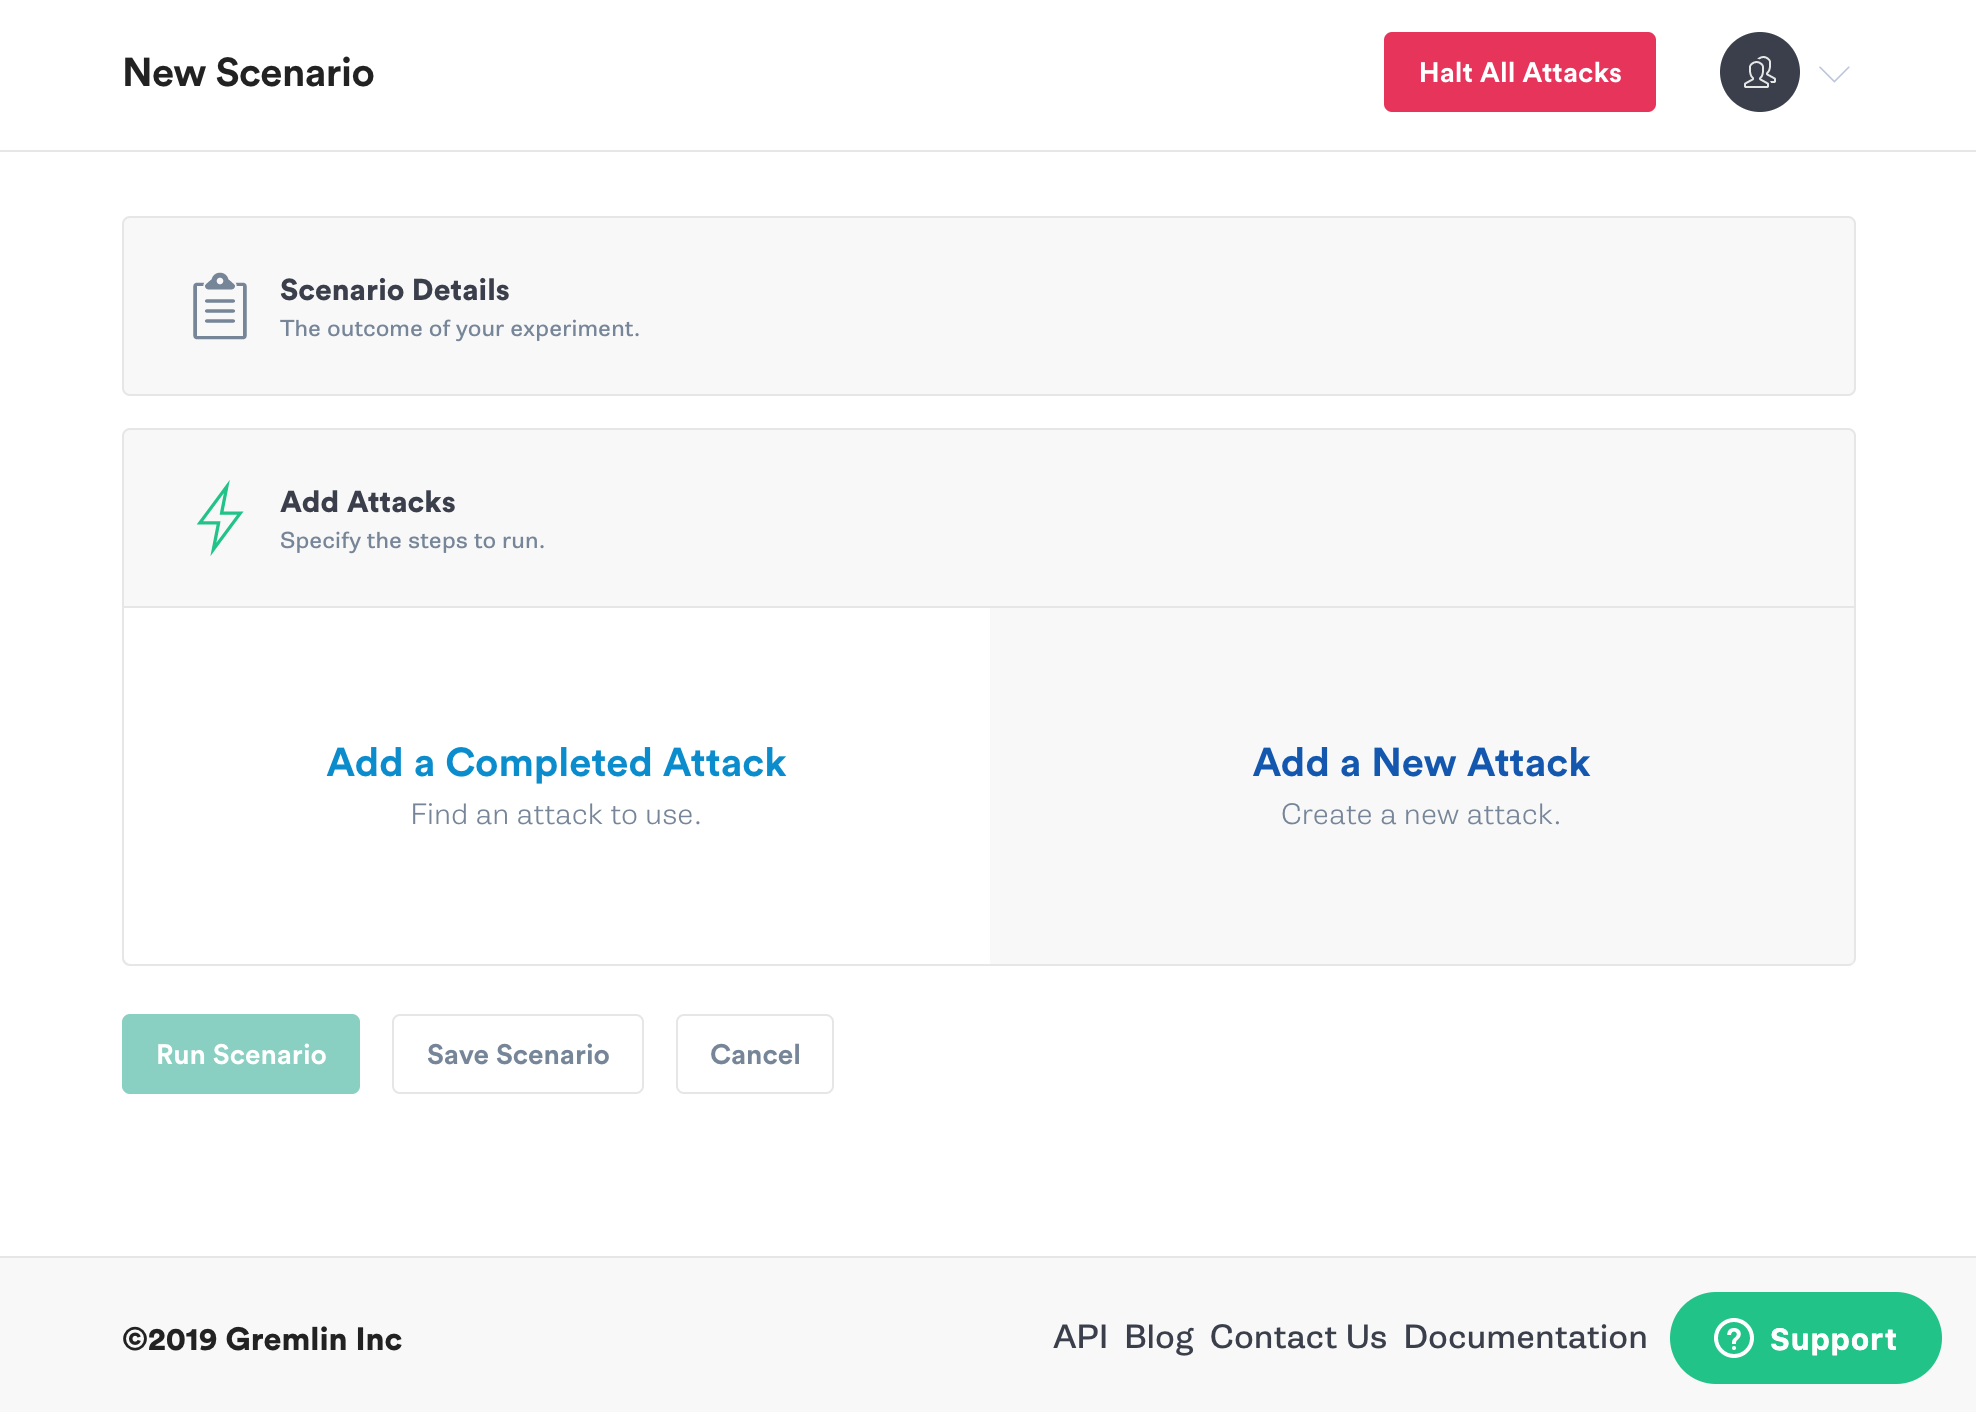
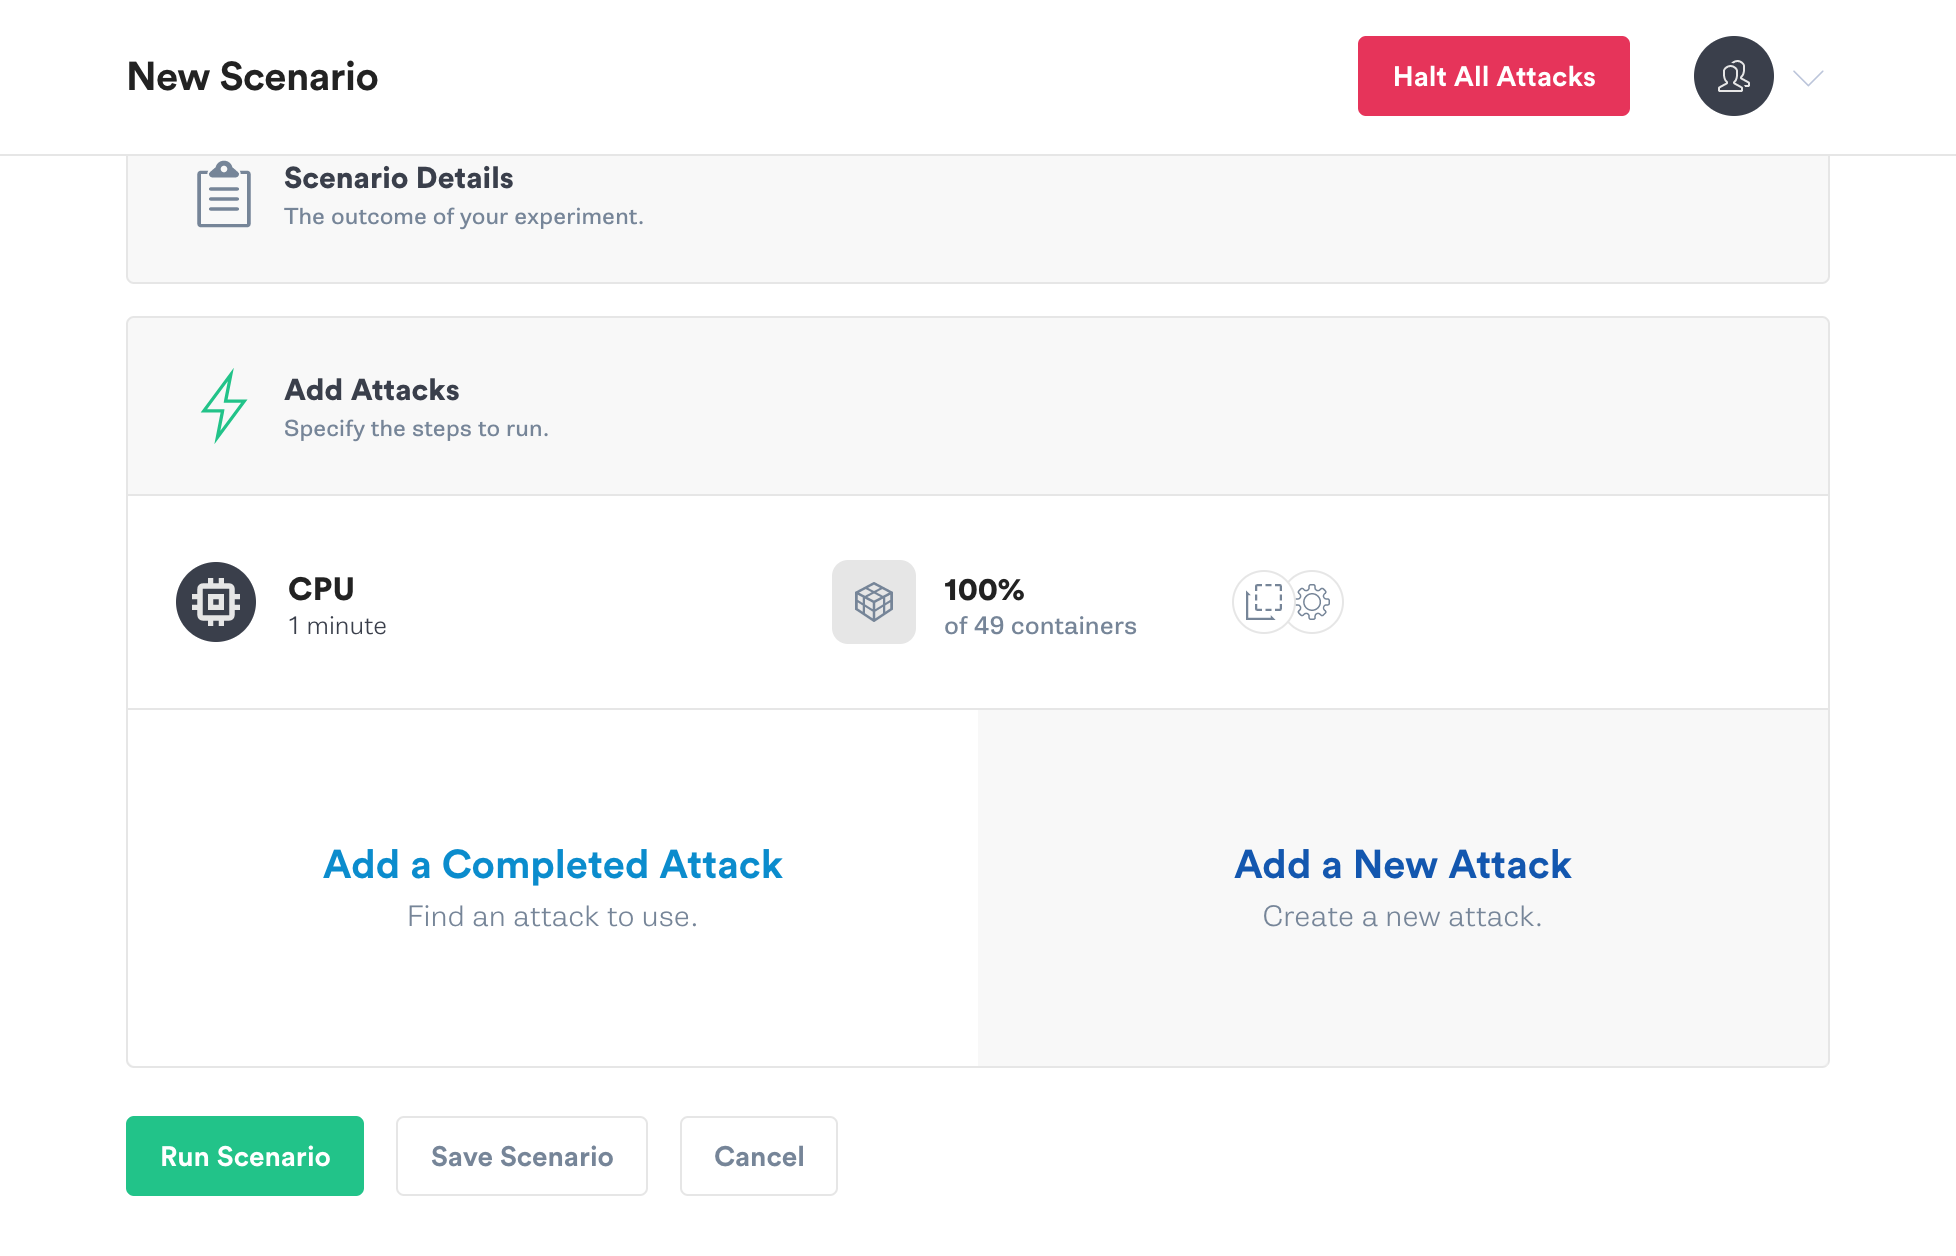
Scroll down and Click Add Attacks, and then Add a New Attack.
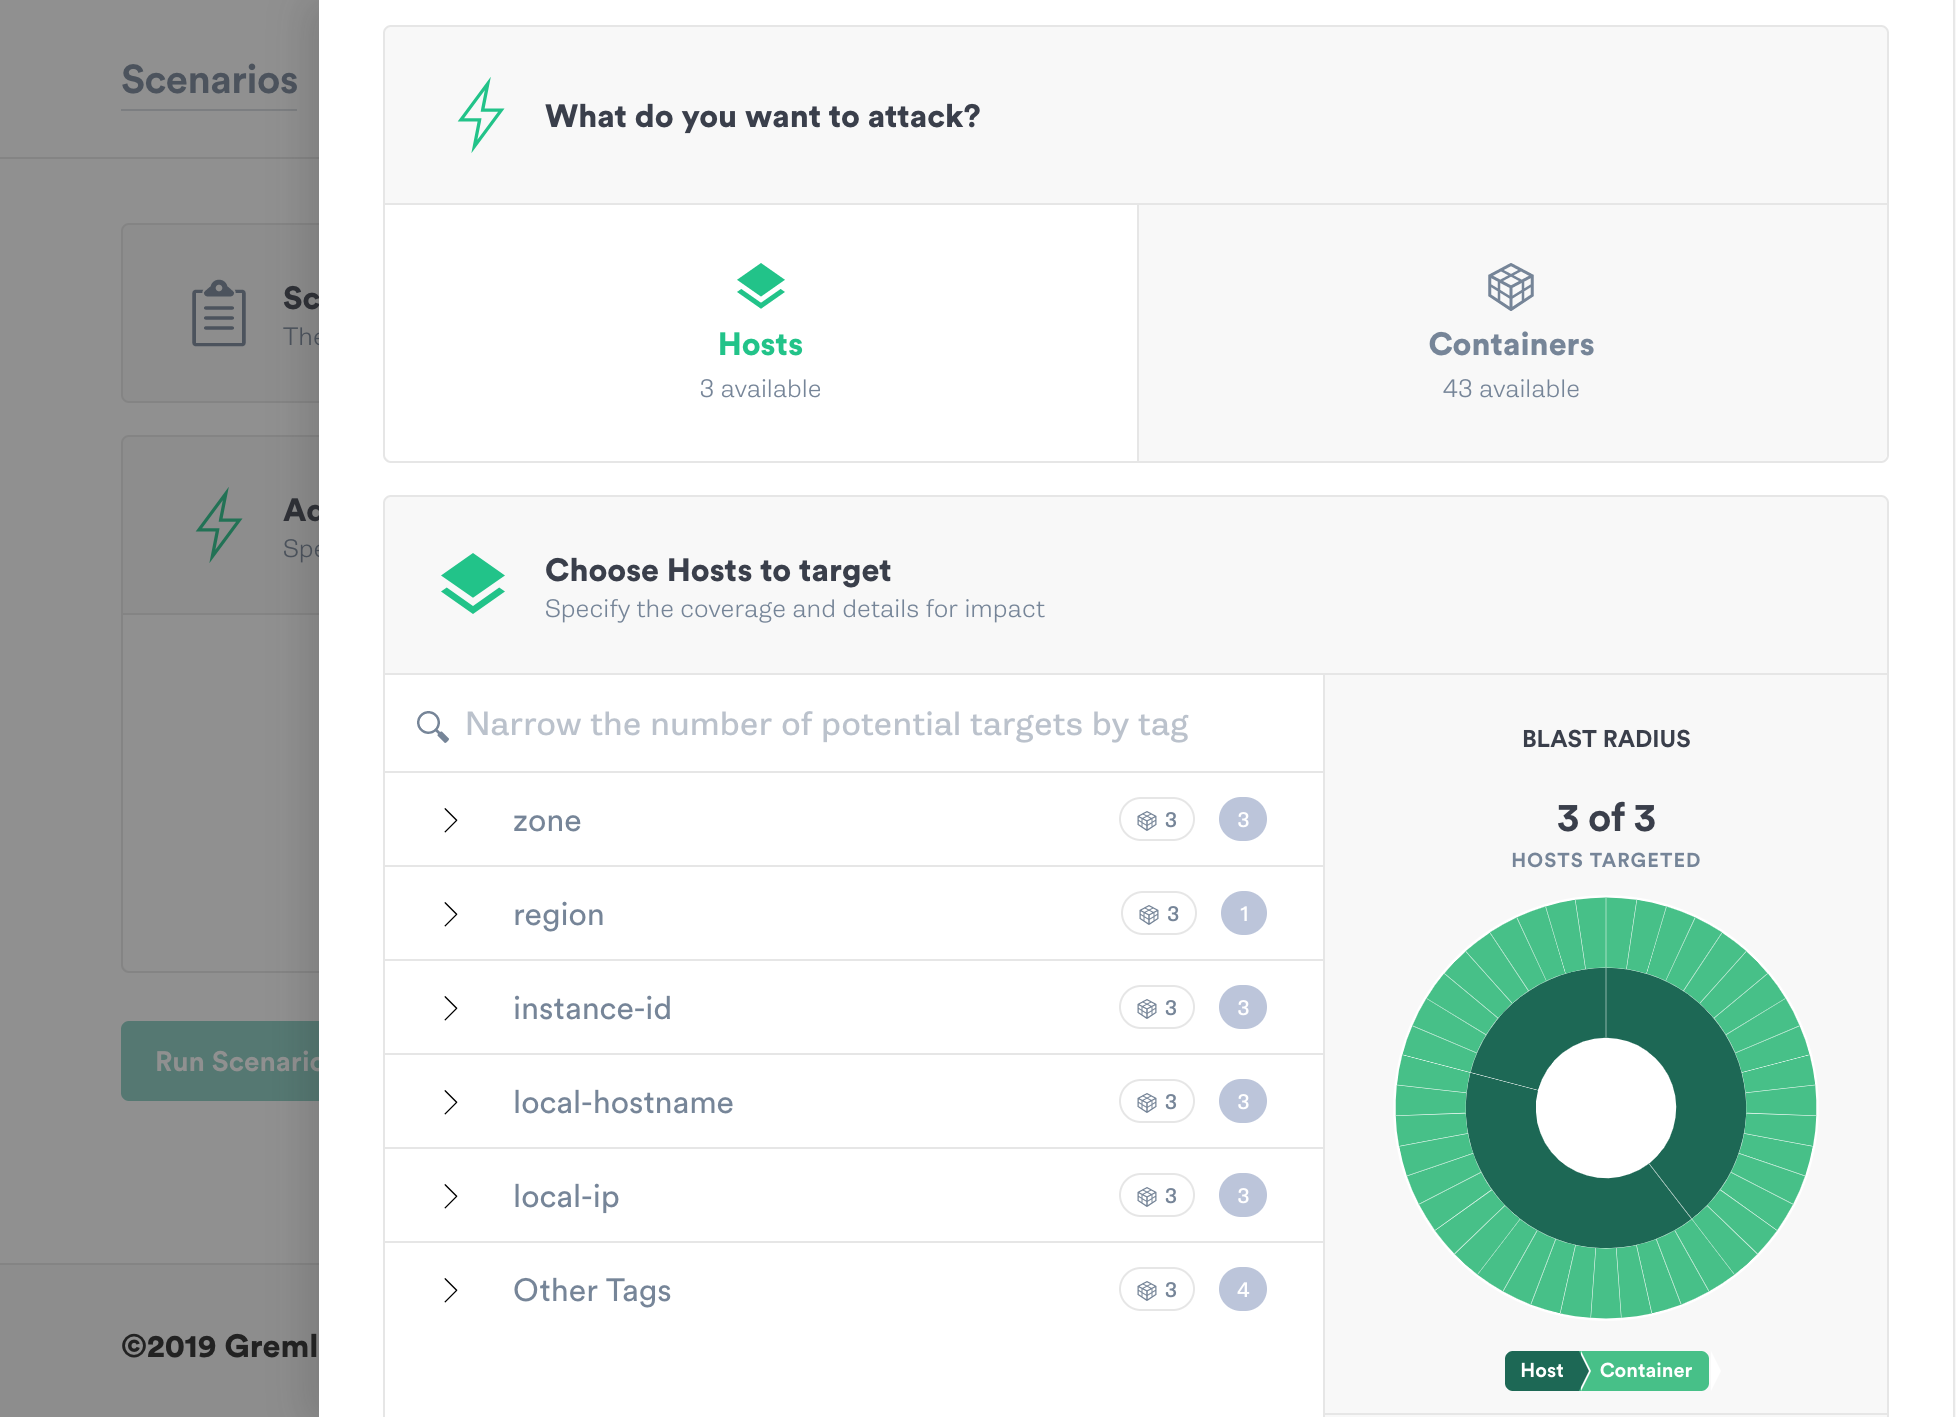
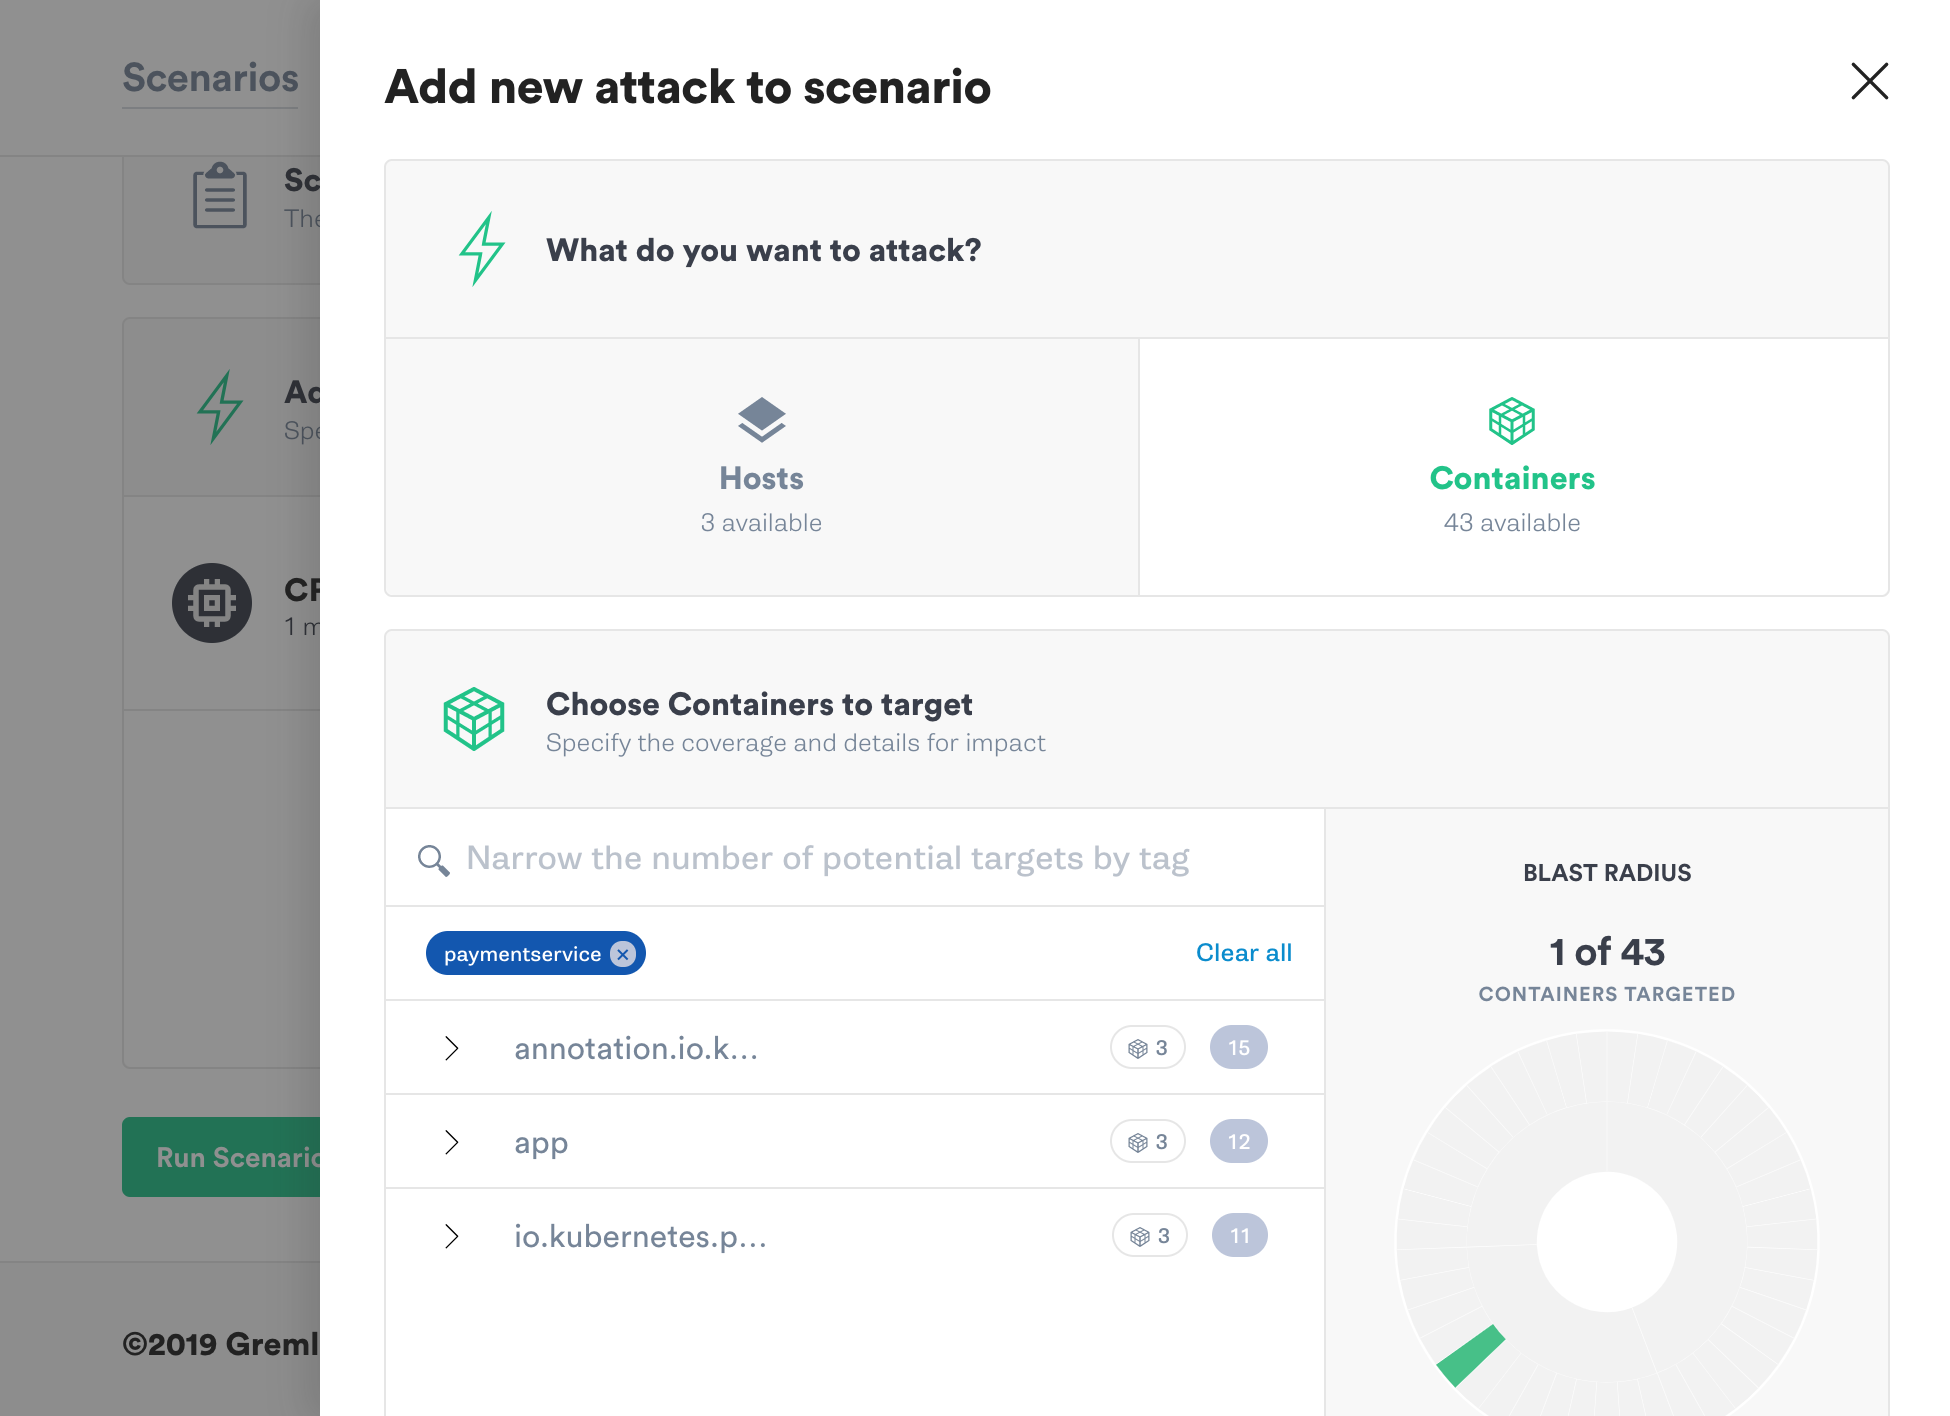
The next step is to select targets. If you’ve used Gremlin before, you’ll see that the targeting interface has changed quite a bit. You can now select hosts or containers by tags, and there’s a new graphic that shows the number of hosts or containers that will be impacted by the Scenario. We call this the blast radius.
Take a moment to click one some of the categories of tags and expand them to see what they contain.
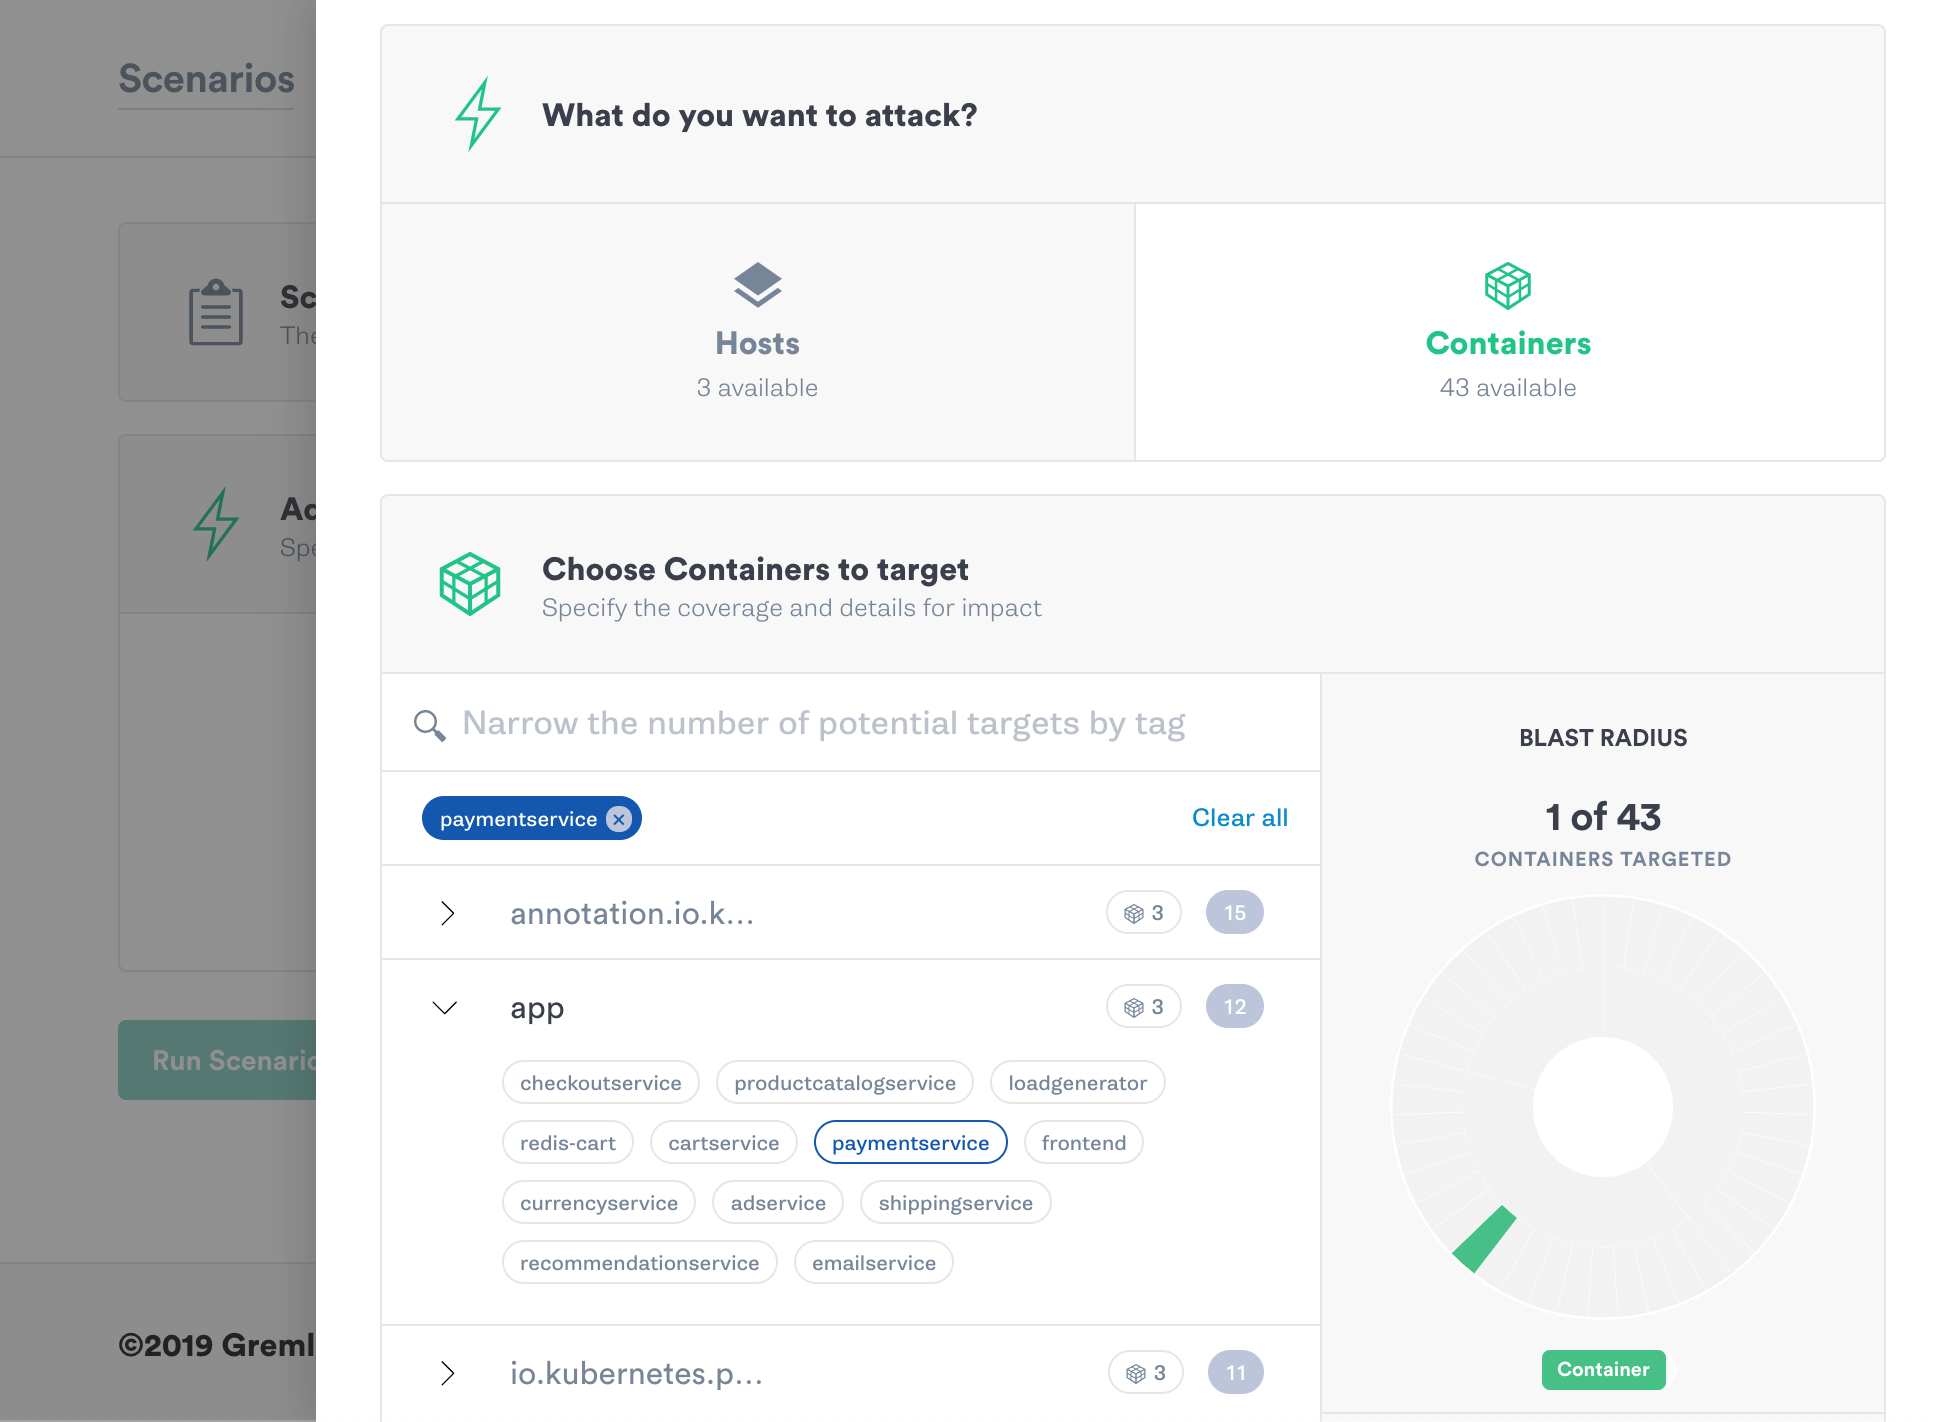
Next, click on Containers, on the right. Click to expand “app” in the categories of tags, and then click on paymentservice.
You’ll see the blast radius is reduced from all of the containers to just one.
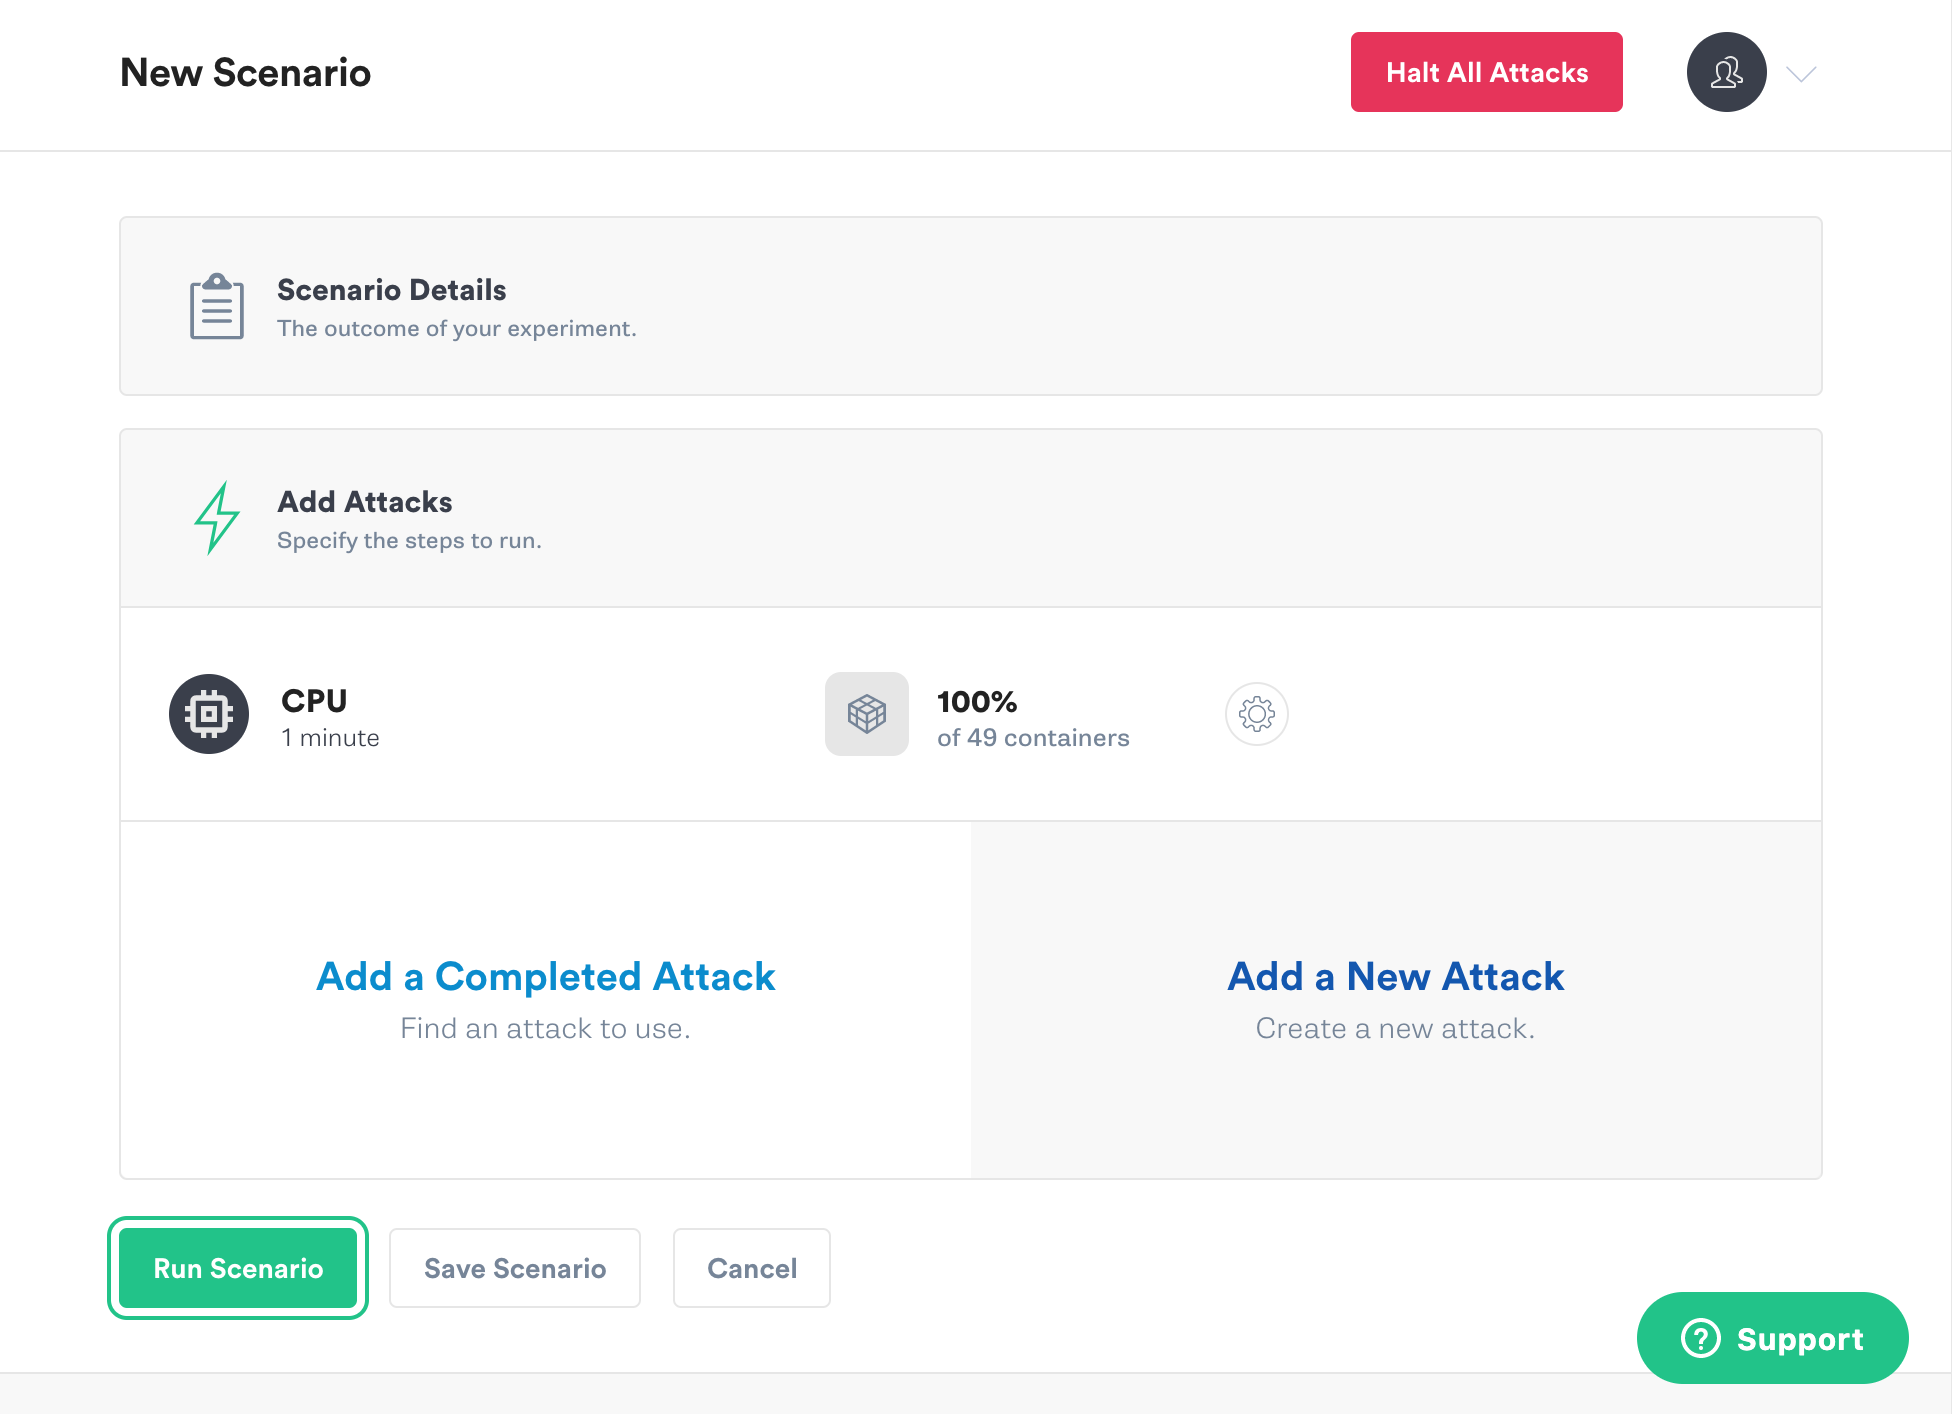
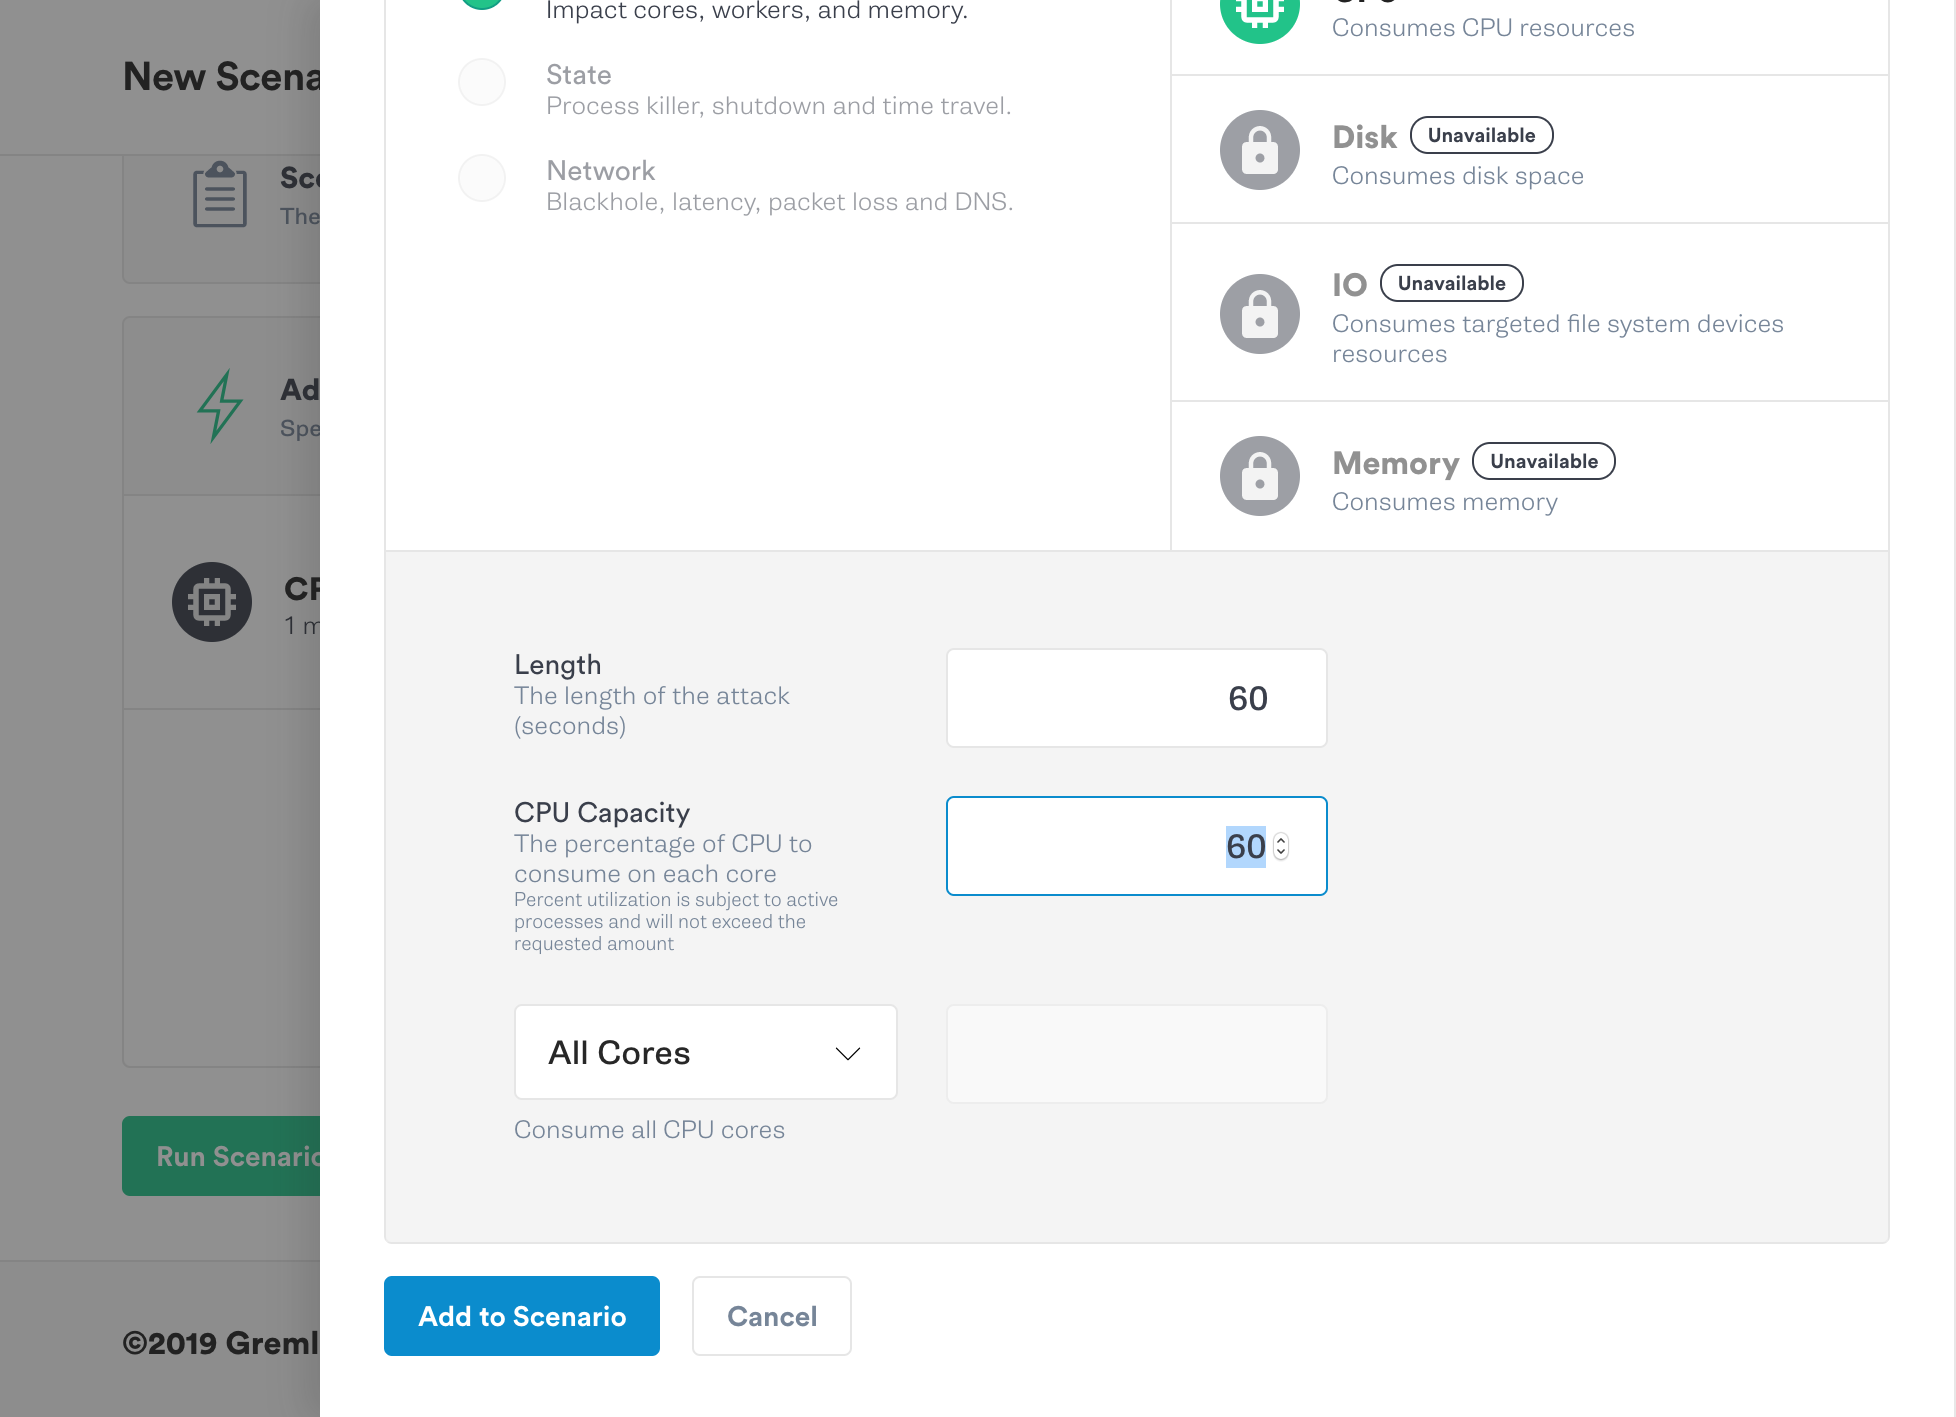
Click Choose a Gremlin, Resource, and then CPU.
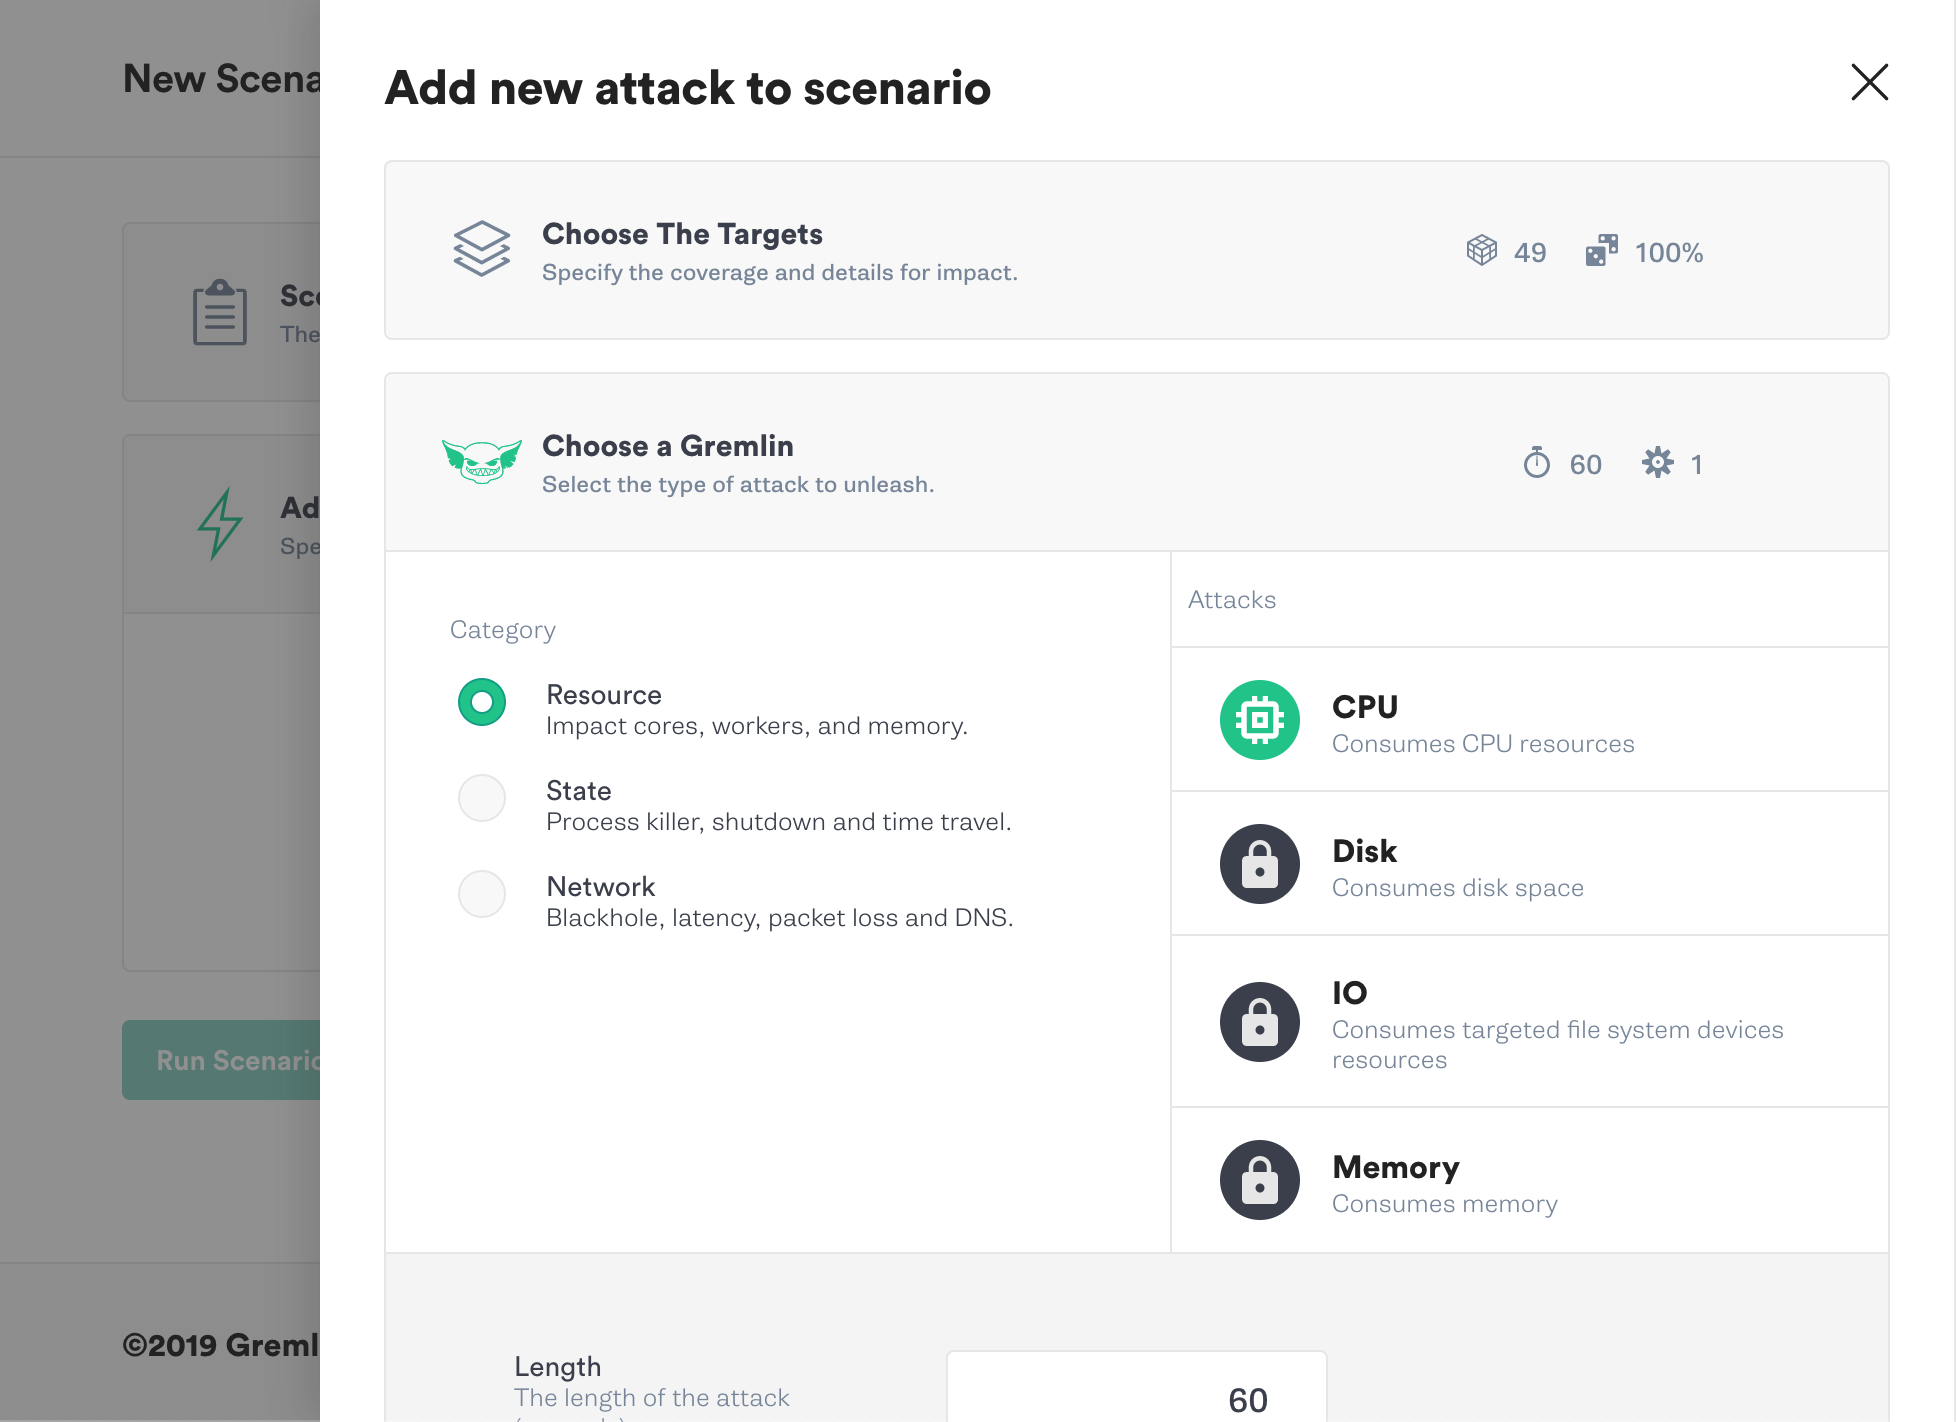
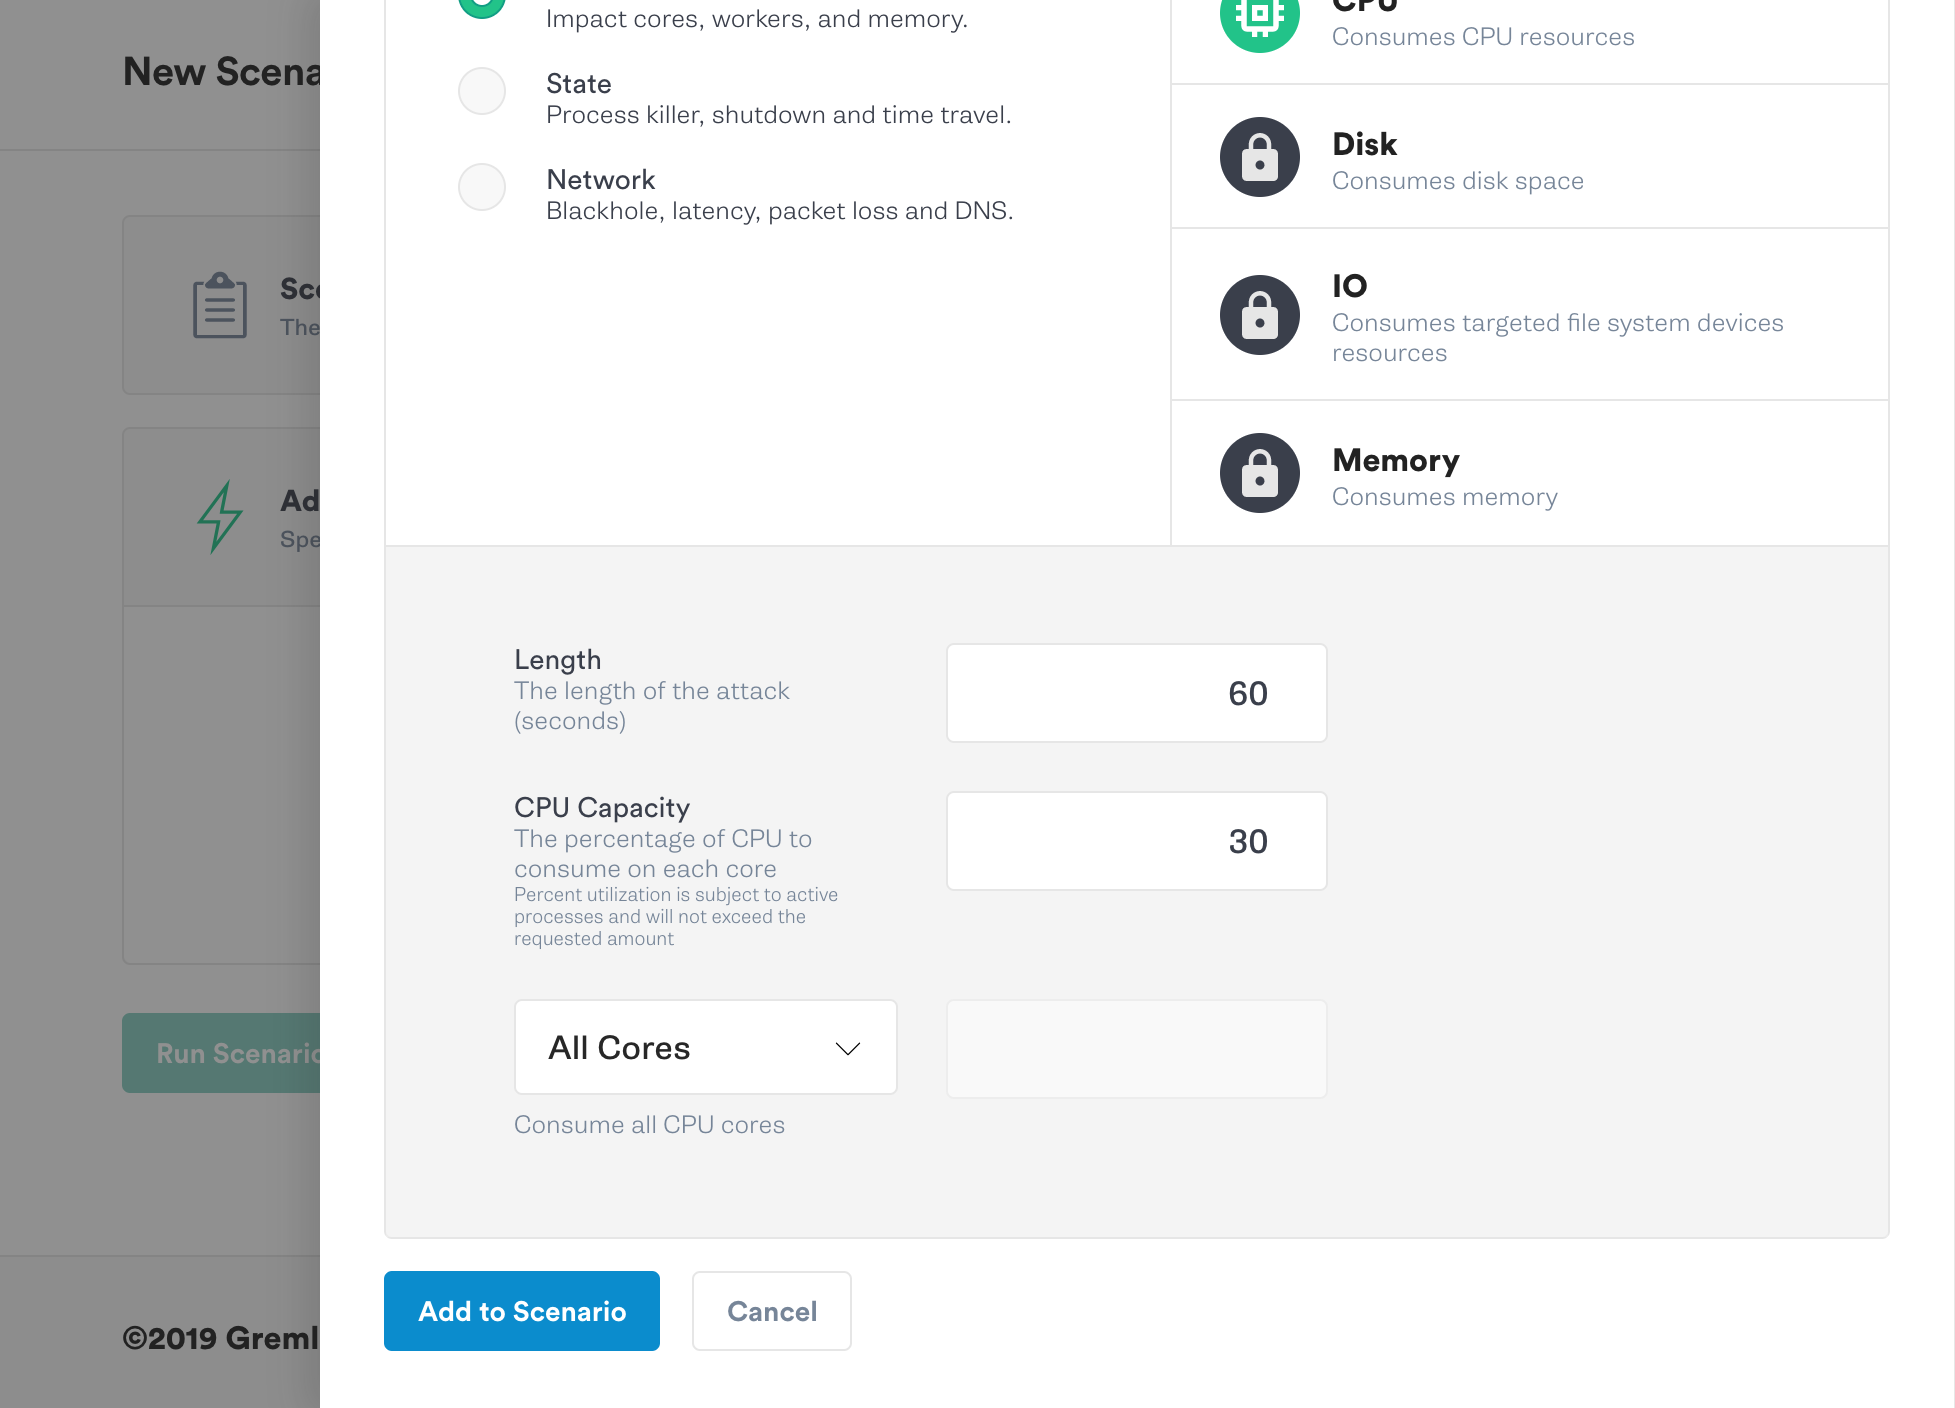
Scroll down to the CPU attack settings. Leave the length set to 60. Set the CPU Capacity to 30 percent, and pick All Cores from the pulldown list. Then click Add to Scenario.
Click the Run Scenario button in the bottom left.
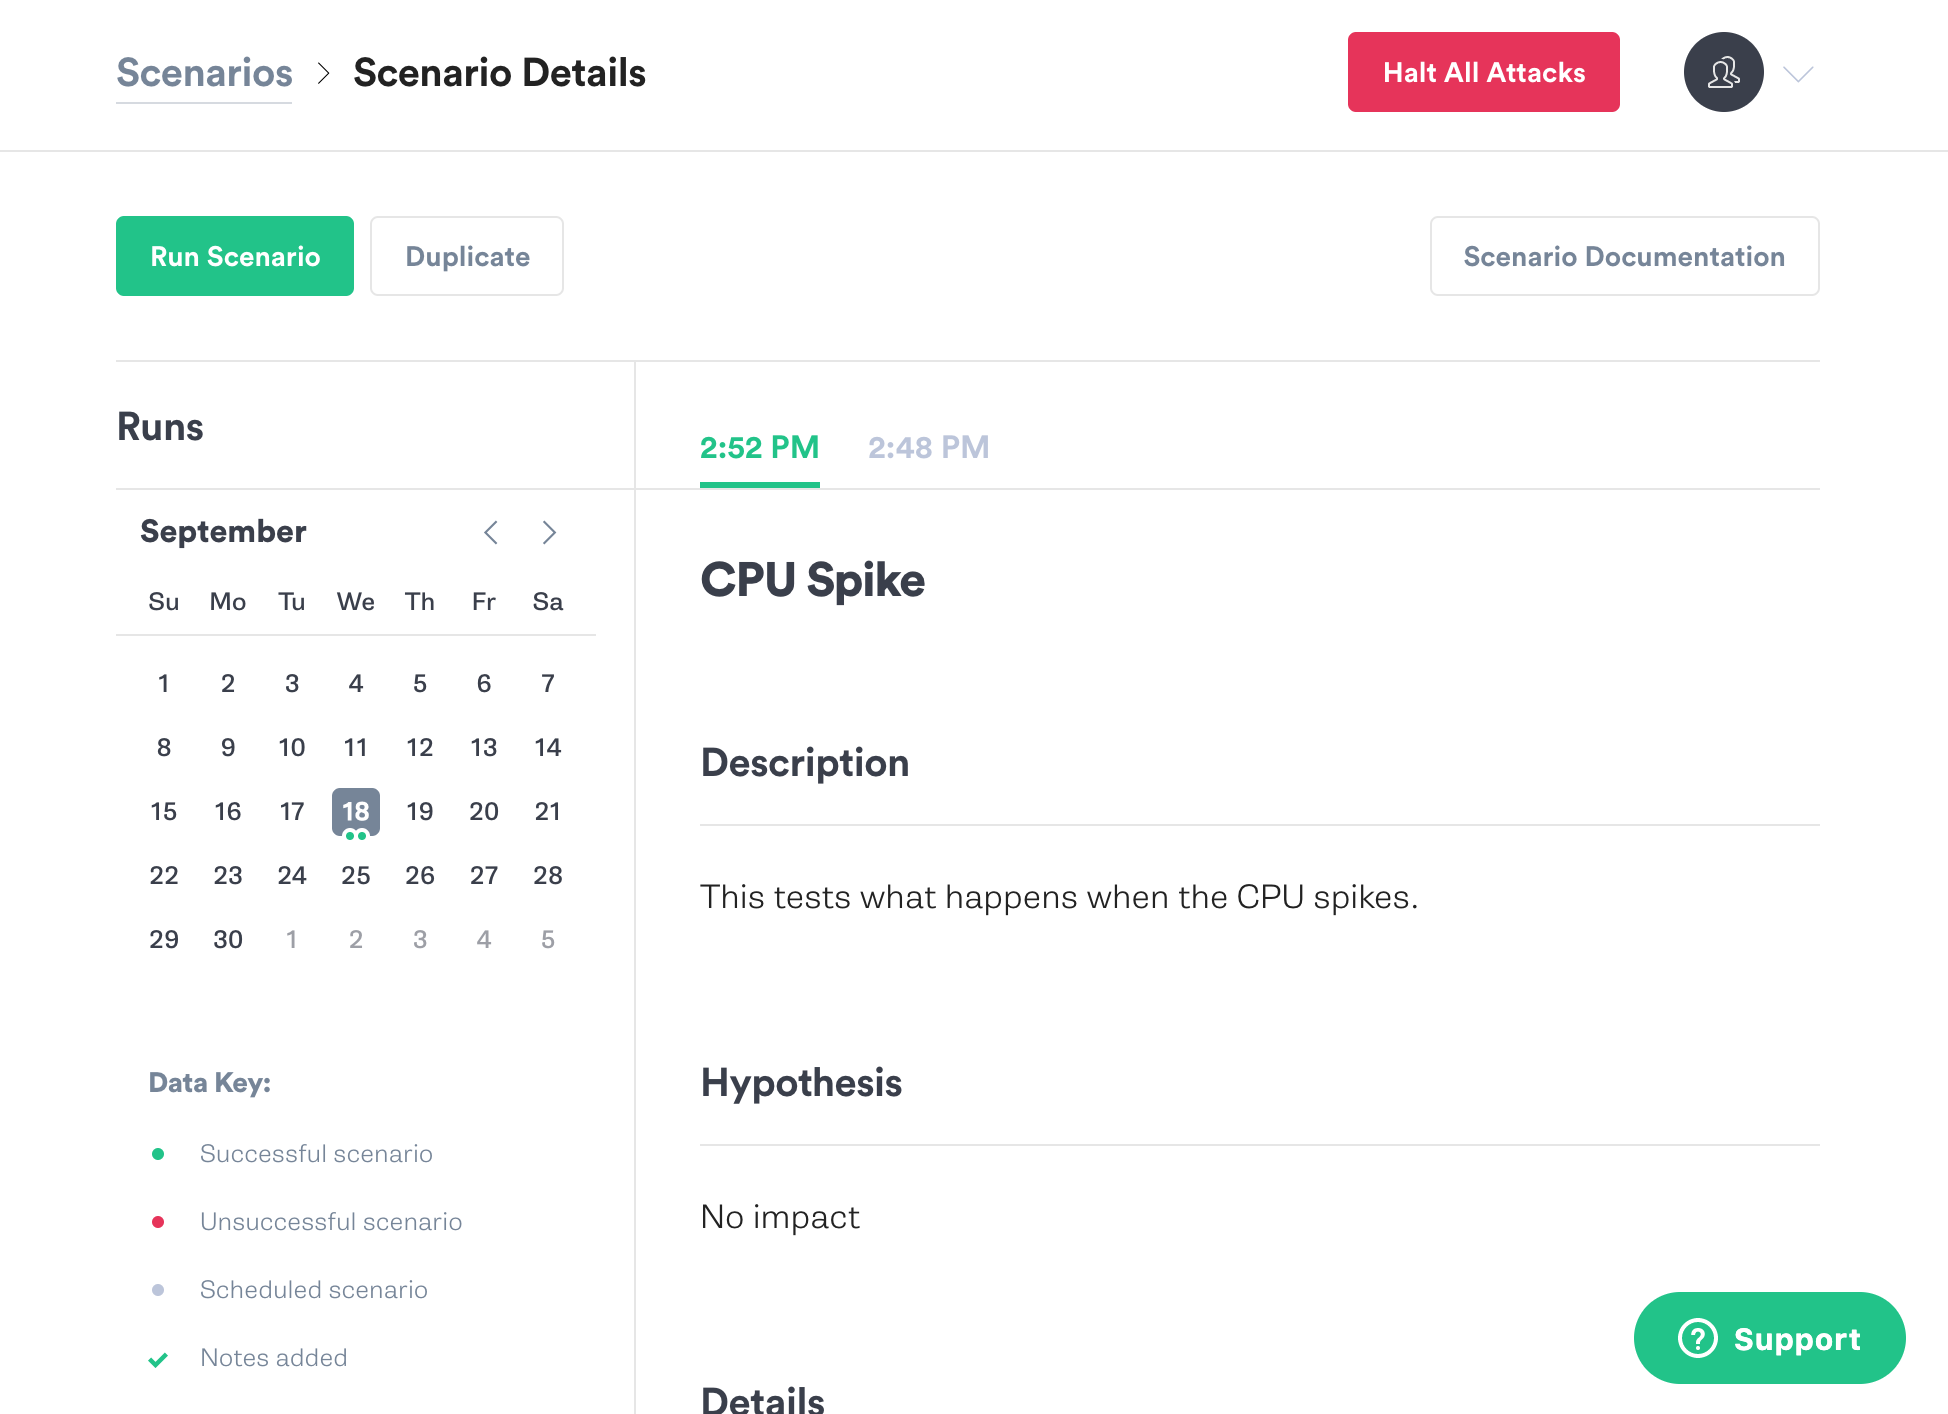
You’ll be taken to the Scenario Details page. Notice the Halt Scenario button in the upper left, and the status of the Scenario to the right of it. There’s also a link to the Scenarios documentation on the right of the screen.
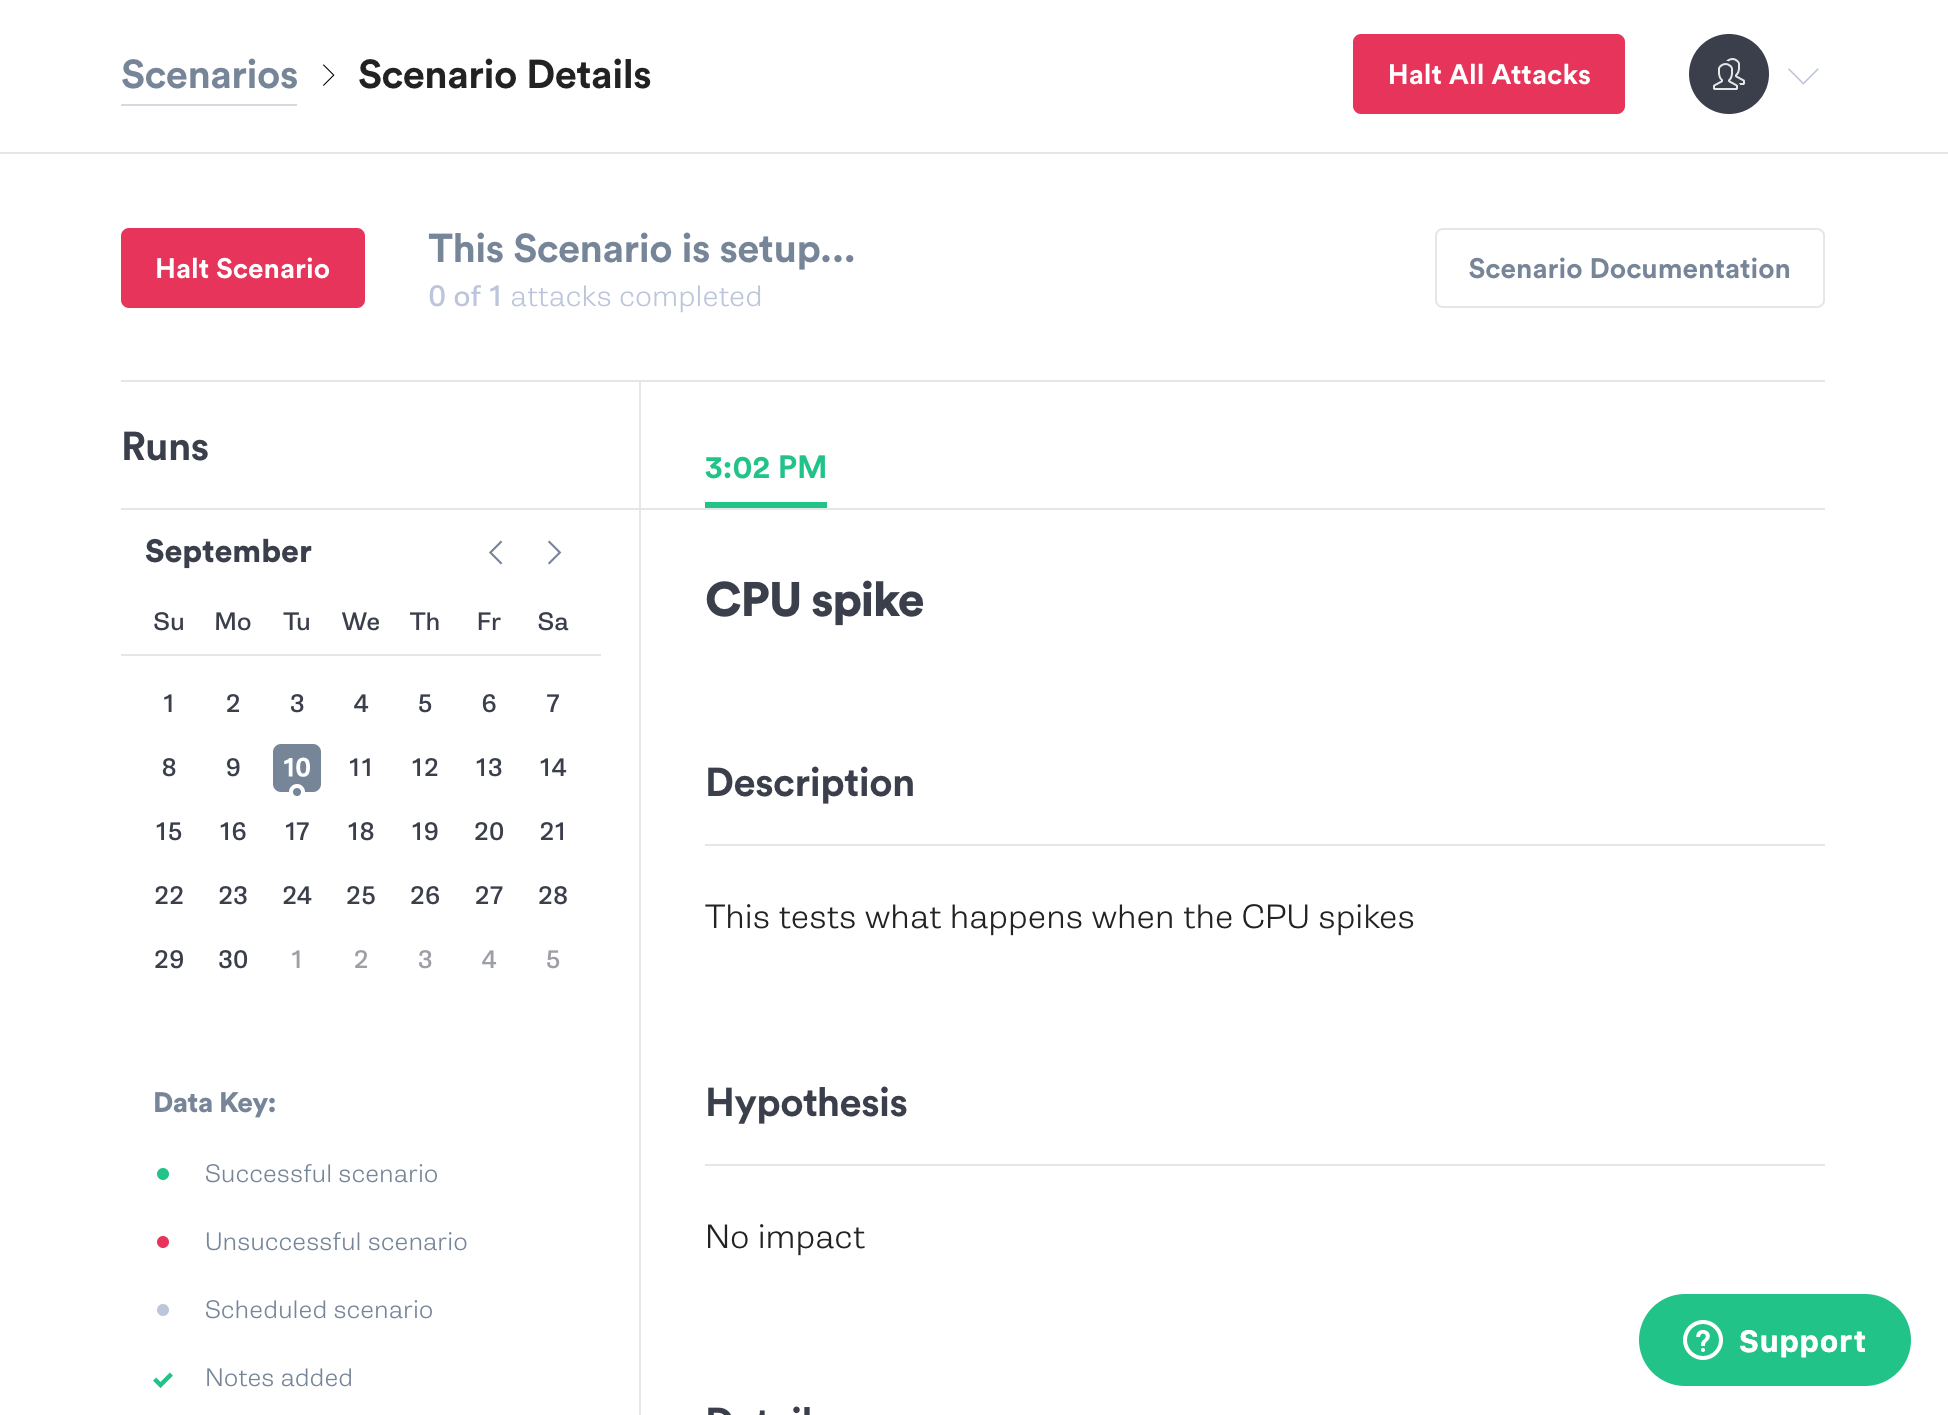
There’s also a calendar view that shows previous runs of this Scenario. You can see from the Data Key below the calendar that it displays successful and unsuccessful runs, scheduled runs, and scenario runs where notes have been added. This is a great way to see what’s happened with the scenario historically.
Scroll down a bit and you’ll see additional details, like who created the scenario and when it ran last.
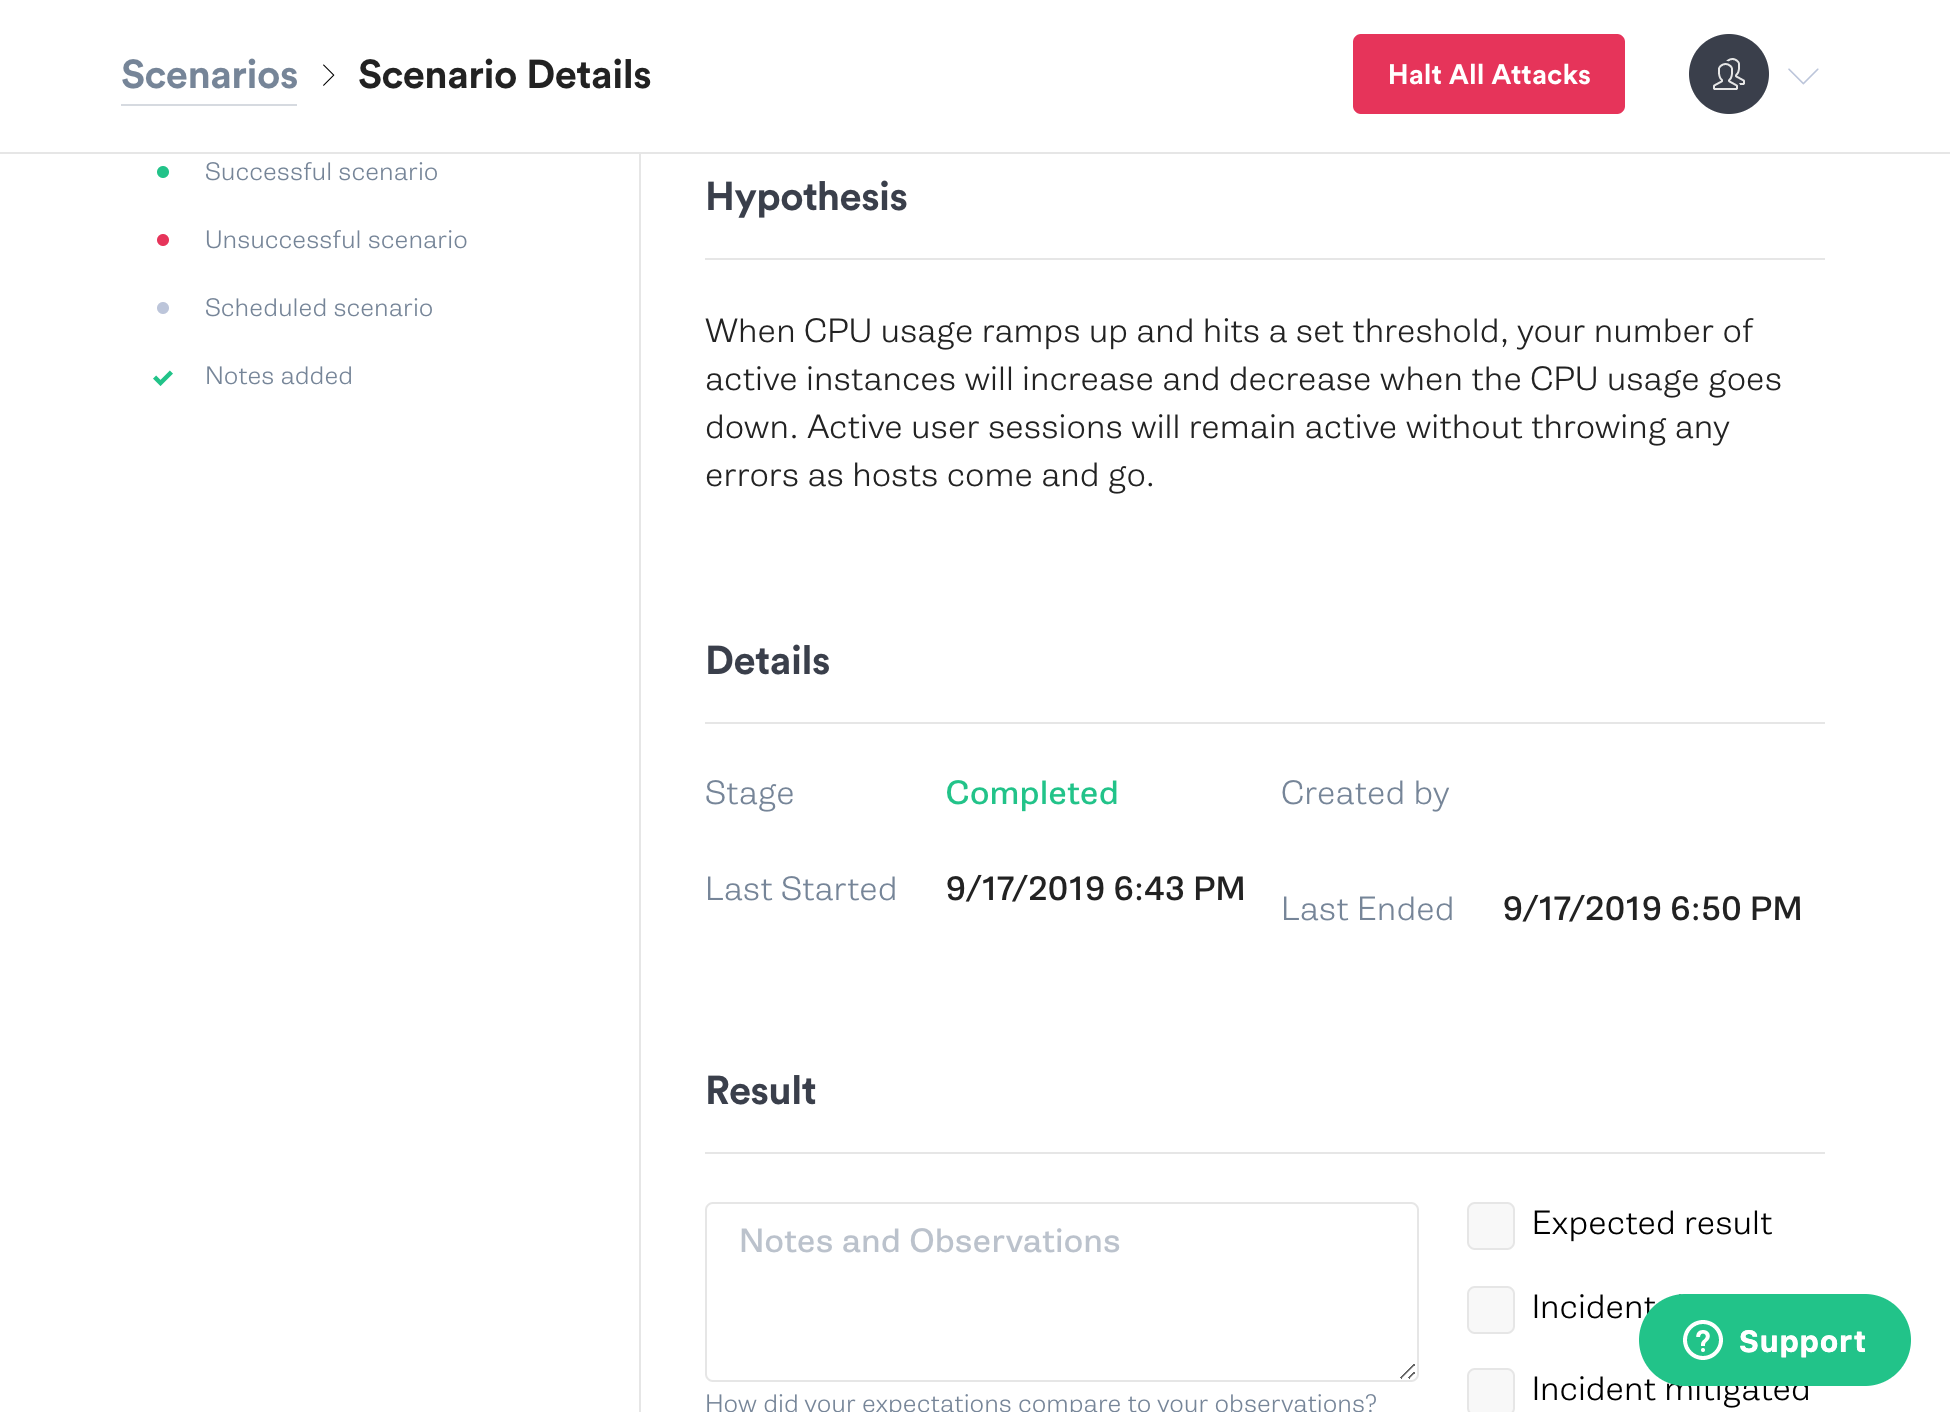
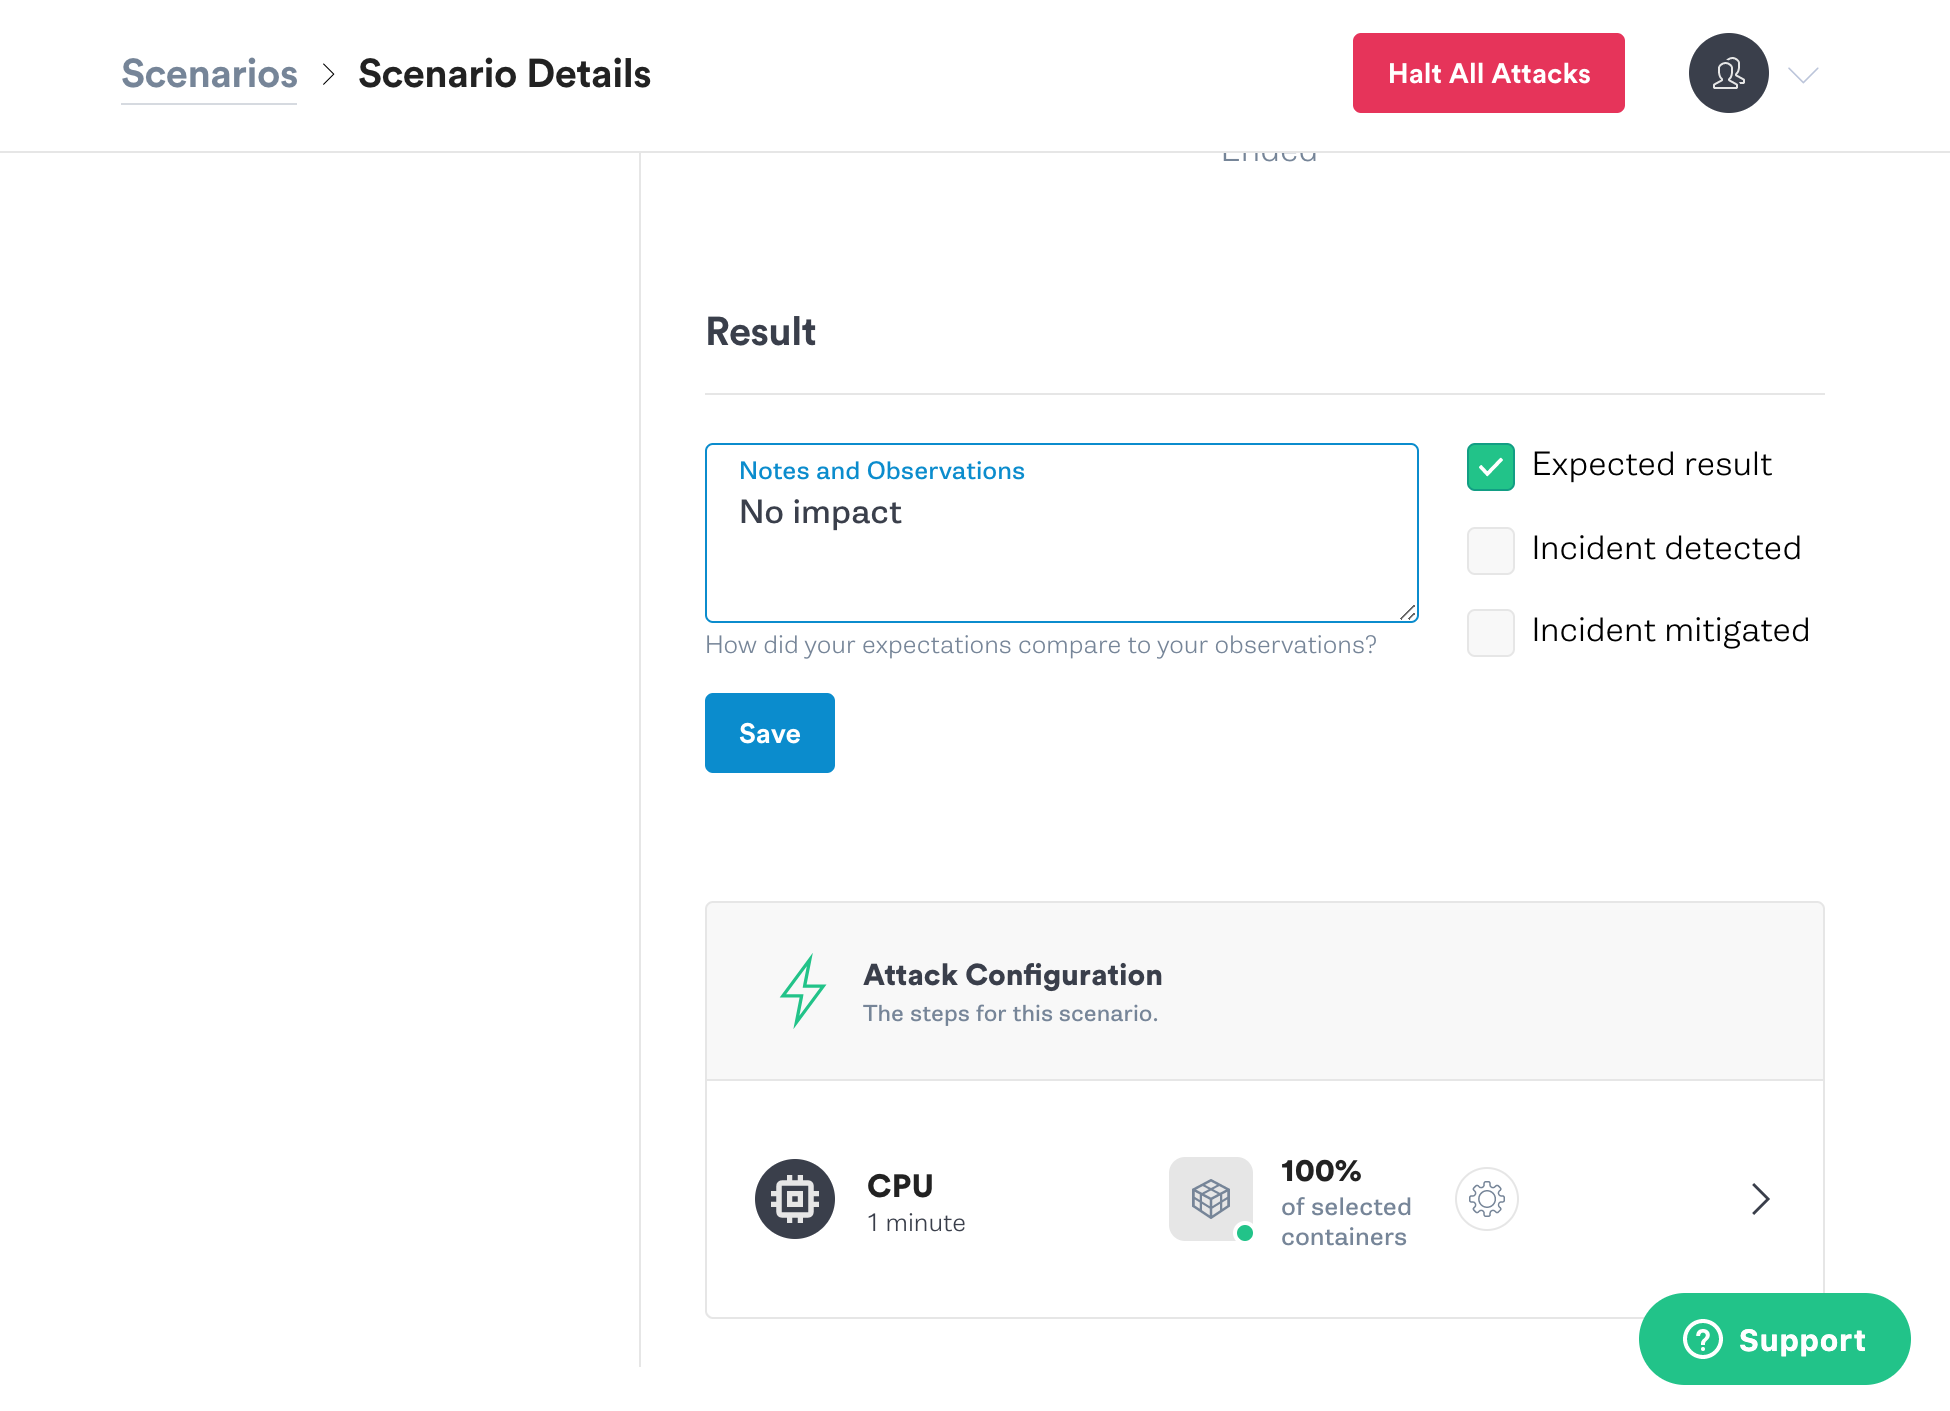
Still on the Scenario Details page, scroll down to the bottom. Type in a result in the Notes and Observations box, check the Expected Result checkbox, and hit Save.
As you can see, the Attack Configuration is displayed at the bottom of this screen.
Scroll up to the top of the Scenario Details page, and click on the Duplicate button. The Duplicate button won’t appear until the previous Scenario run completes. If it’s not there yet, it will appear in less than a minute, when the CPU attack finishes.
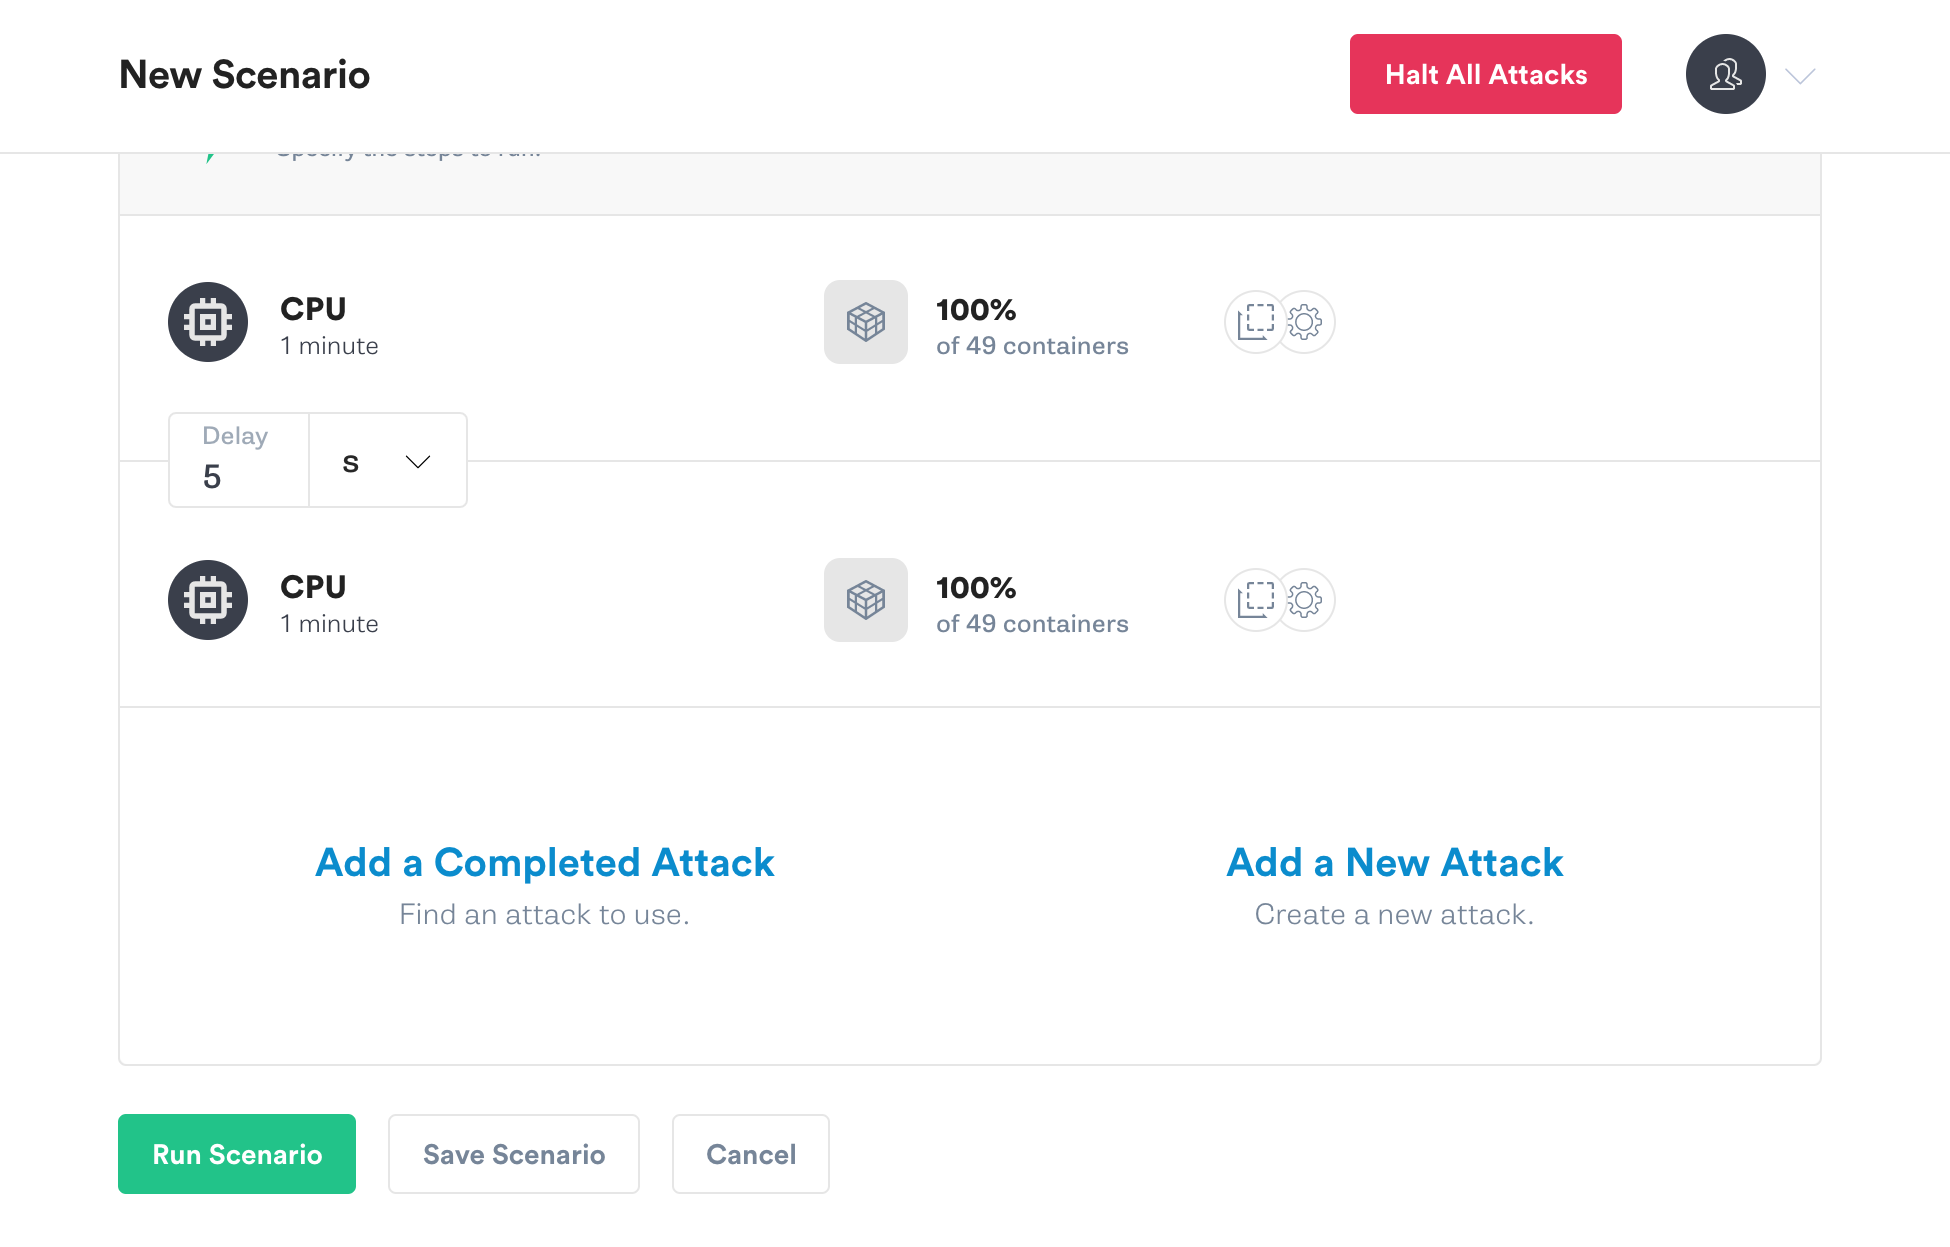
Clicking Duplicate will put you back on the New Scenario screen, into the customization workflow. We’re going to add a second CPU attack to this scenario, to escalate the magnitude of the attack. Scroll down to Add Attacks and click on Add New Attack, like we did the first time.
You’ll be taken to the targeting interface. The payment service should already be selected. If not, click on the app tag to expand it, and then paymentservice.
Scroll down to the CPU attack settings at the bottom of the screen. Change CPU Capacity to 60, and click Add to Scenario at the bottom left of the screen.
You’ll now see there are two CPU attacks chained together in the scenario. If we were to run the scenario again, there would be two separate CPU attacks executed. If we wanted, we could add a third CPU attack or more to increase the magnitude further.
We could run the scenario from here, but instead let’s hit the Save Scenario button at the bottom of the screen.
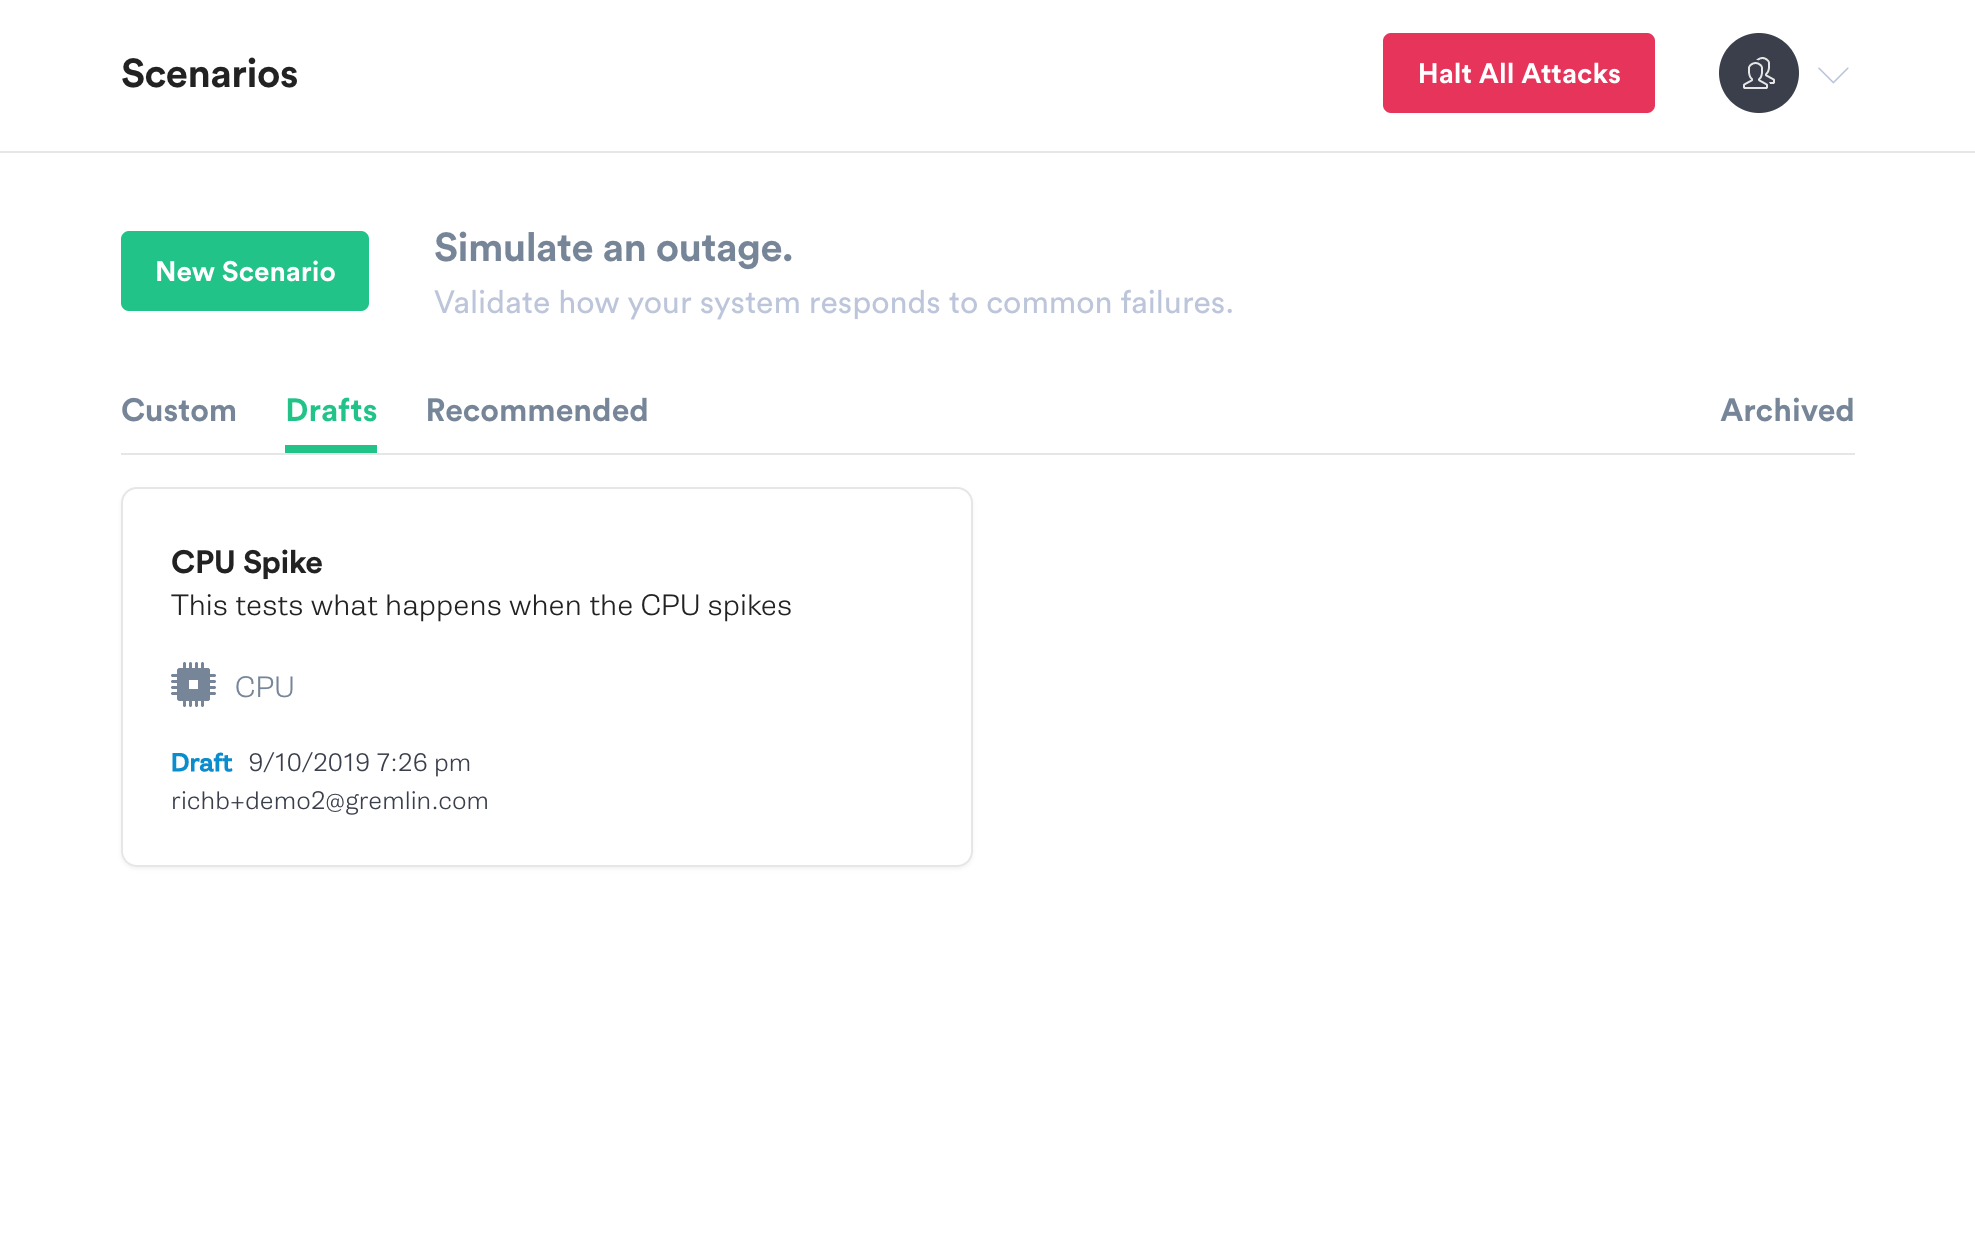
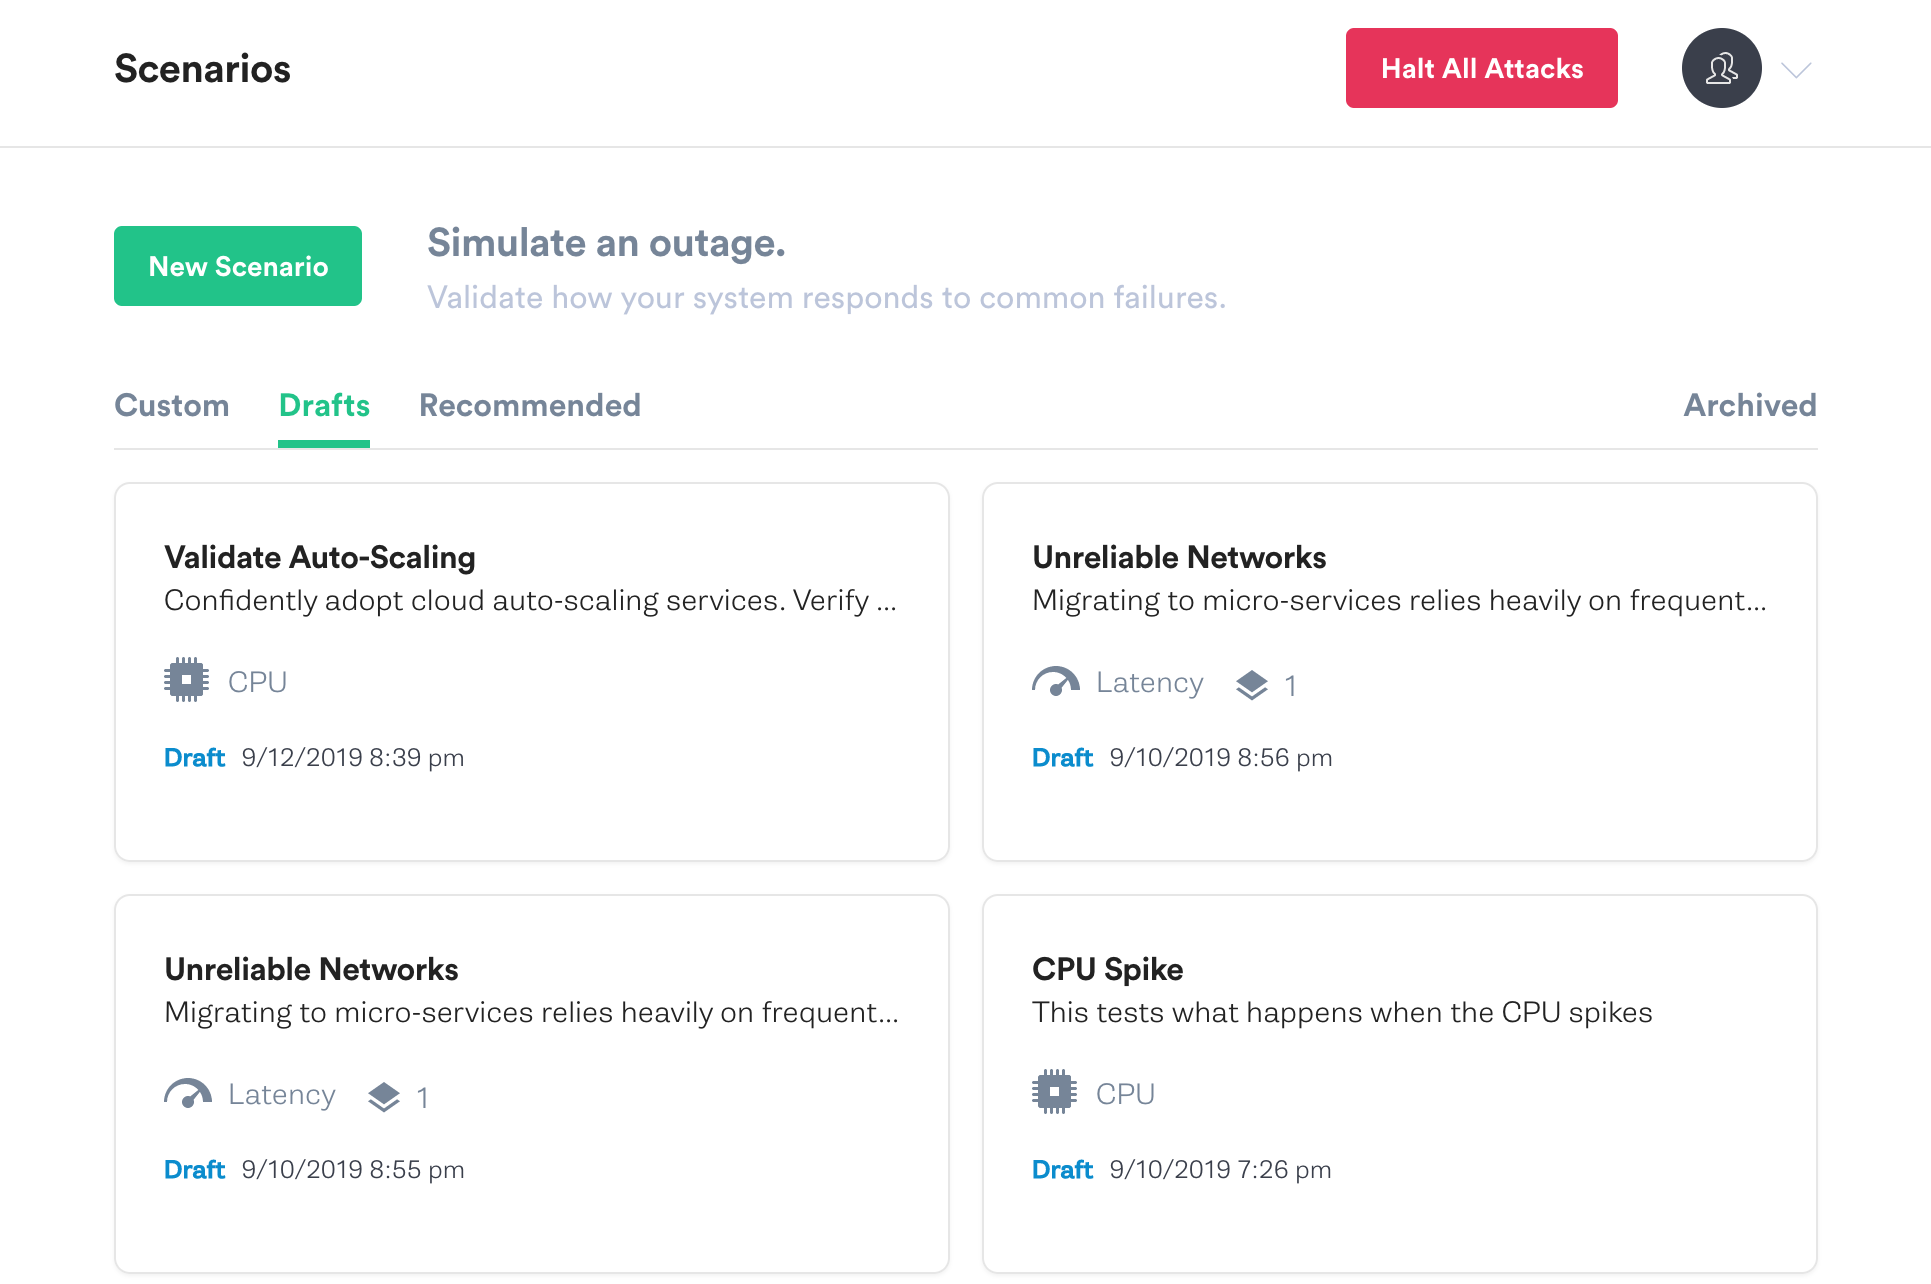
After saving the scenario, you’ll be taken to the Drafts view. You will see your scenario listed here. From here you could run it or edit it more. Drafts allow people to sketch out a scenario idea that they’d like to run at another time.
Step 2 - Run a Recommended Scenario
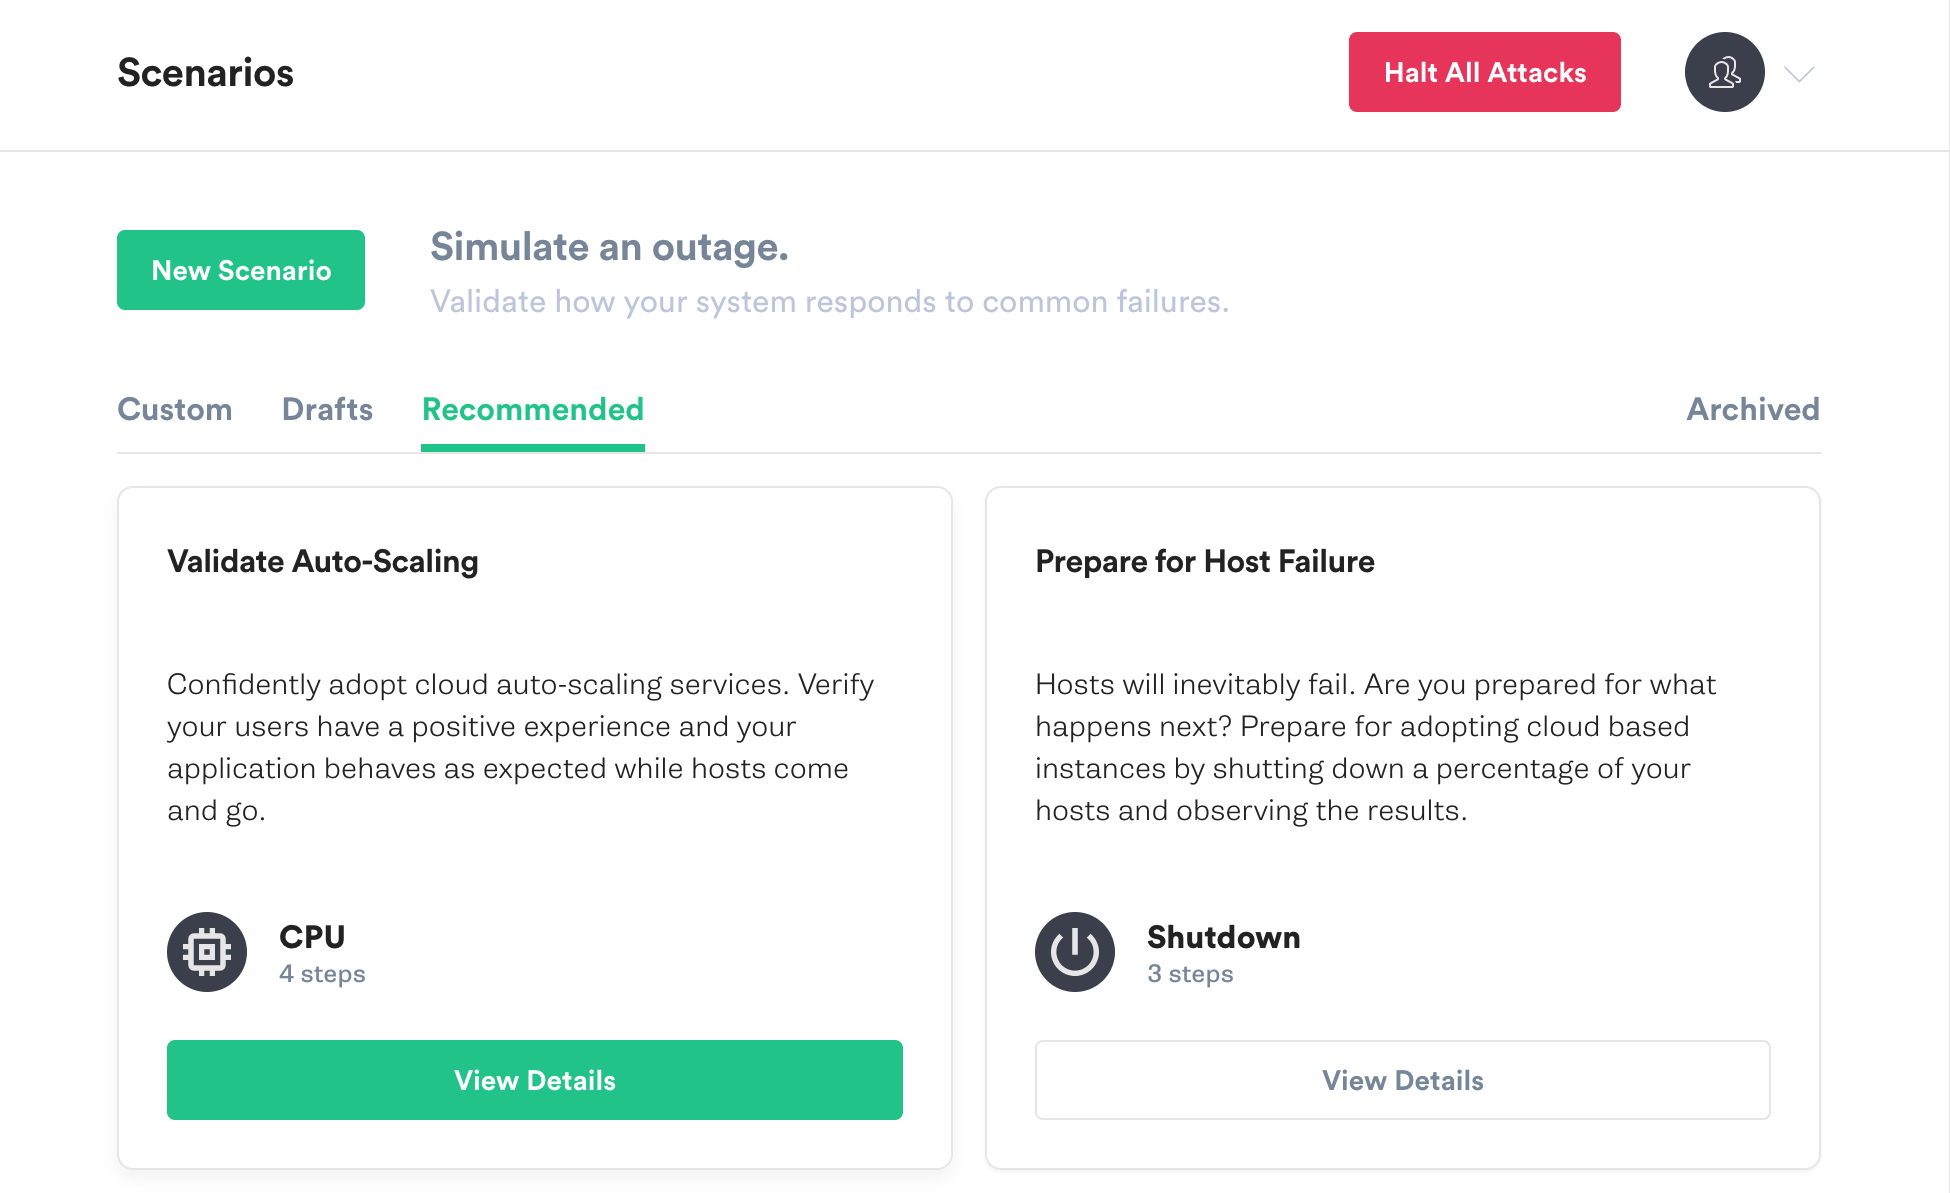
Recommended Scenarios map real-world outage scenarios to Chaos Engineering attacks. There are 6 Recommended Scenarios at launch, and more will be added.
On the main Scenarios screen, click on the Recommended tab. Scroll down and view the 6 Recommended Scenarios. Take a moment and read their descriptions.
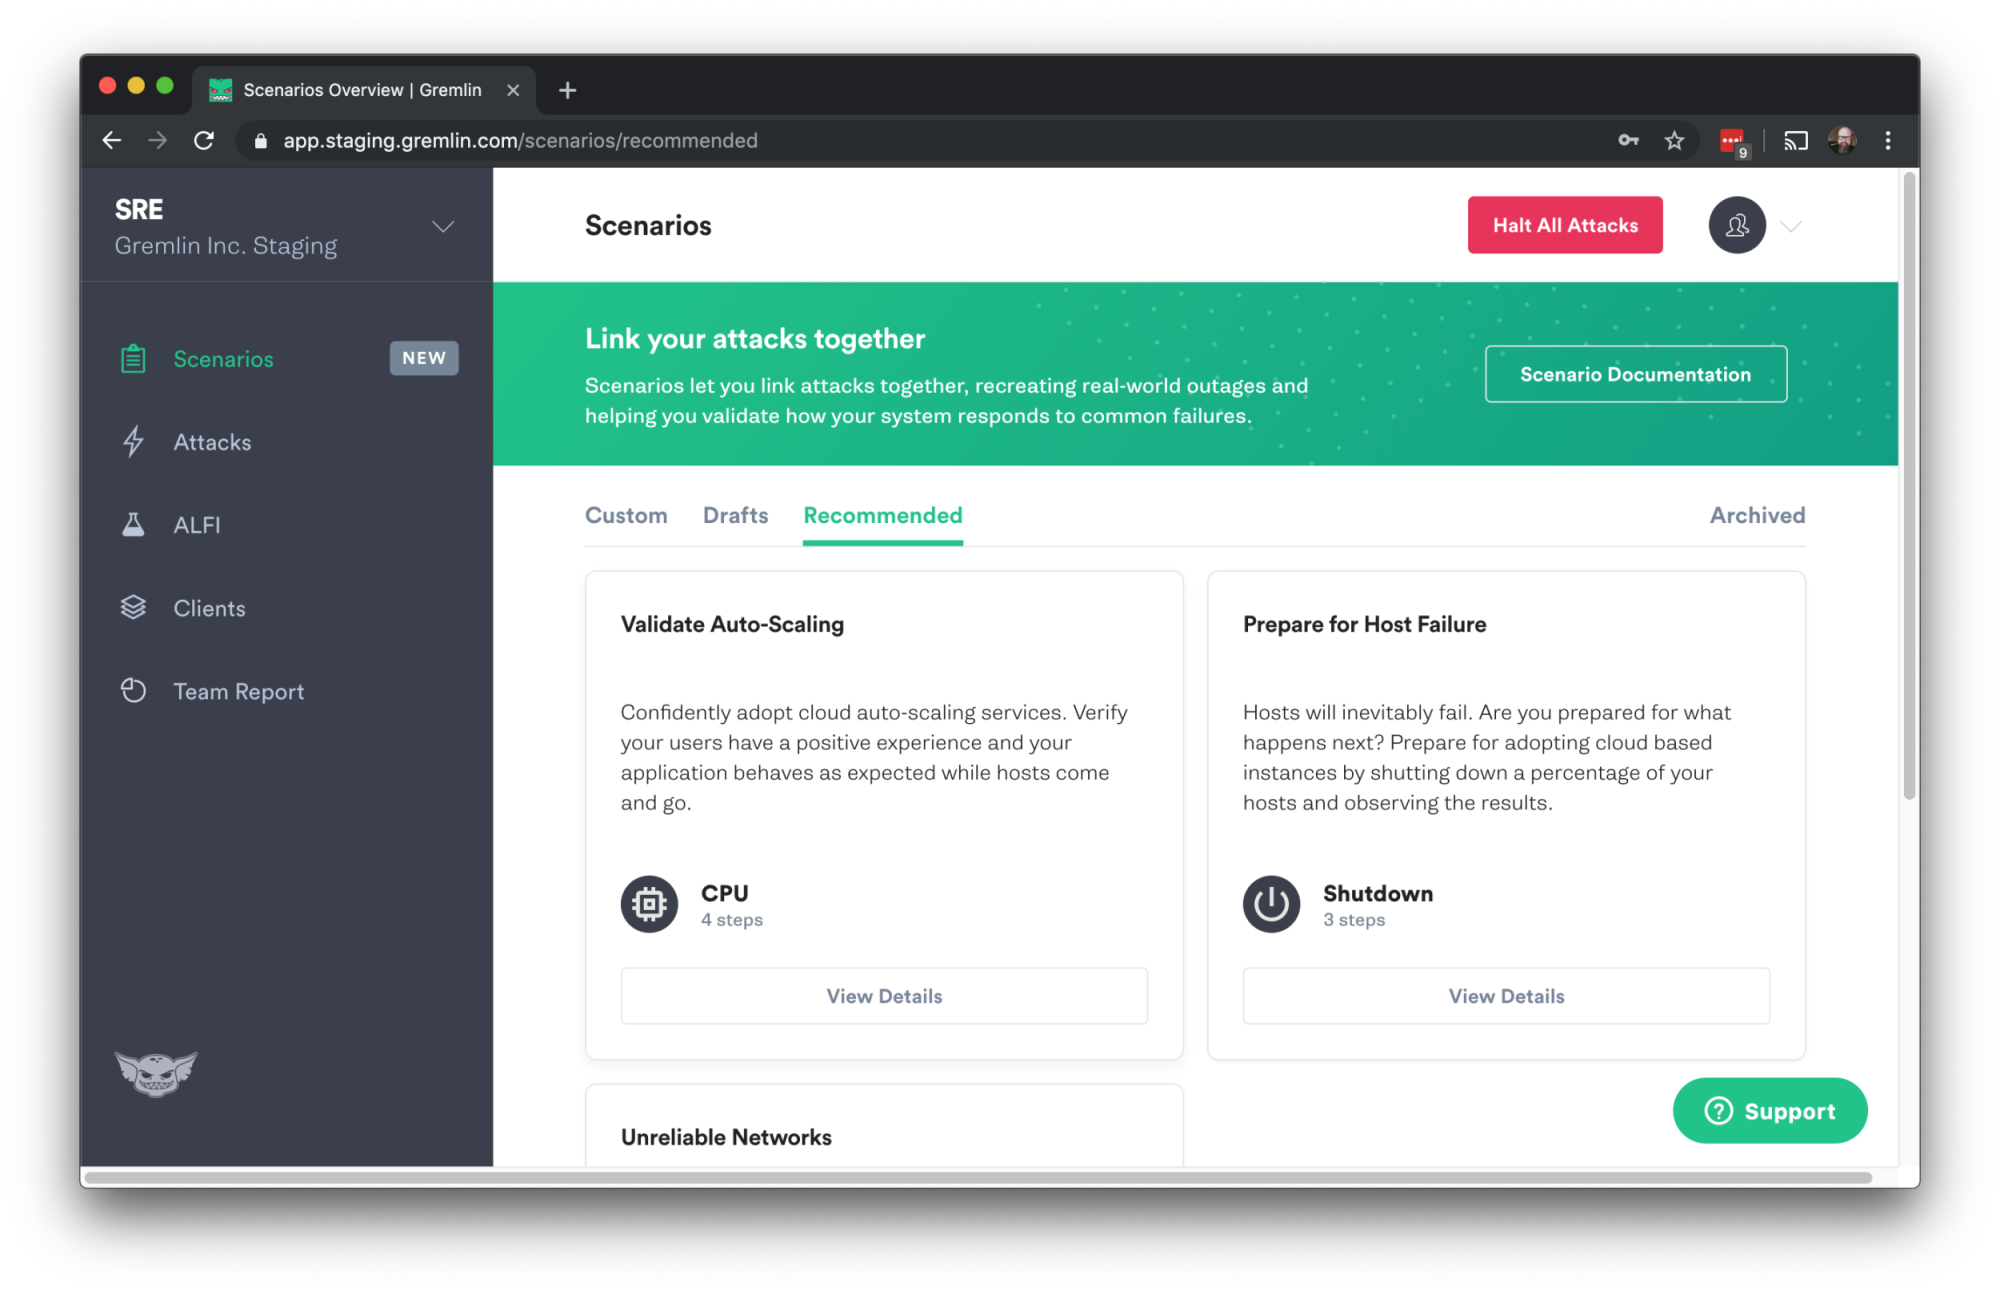
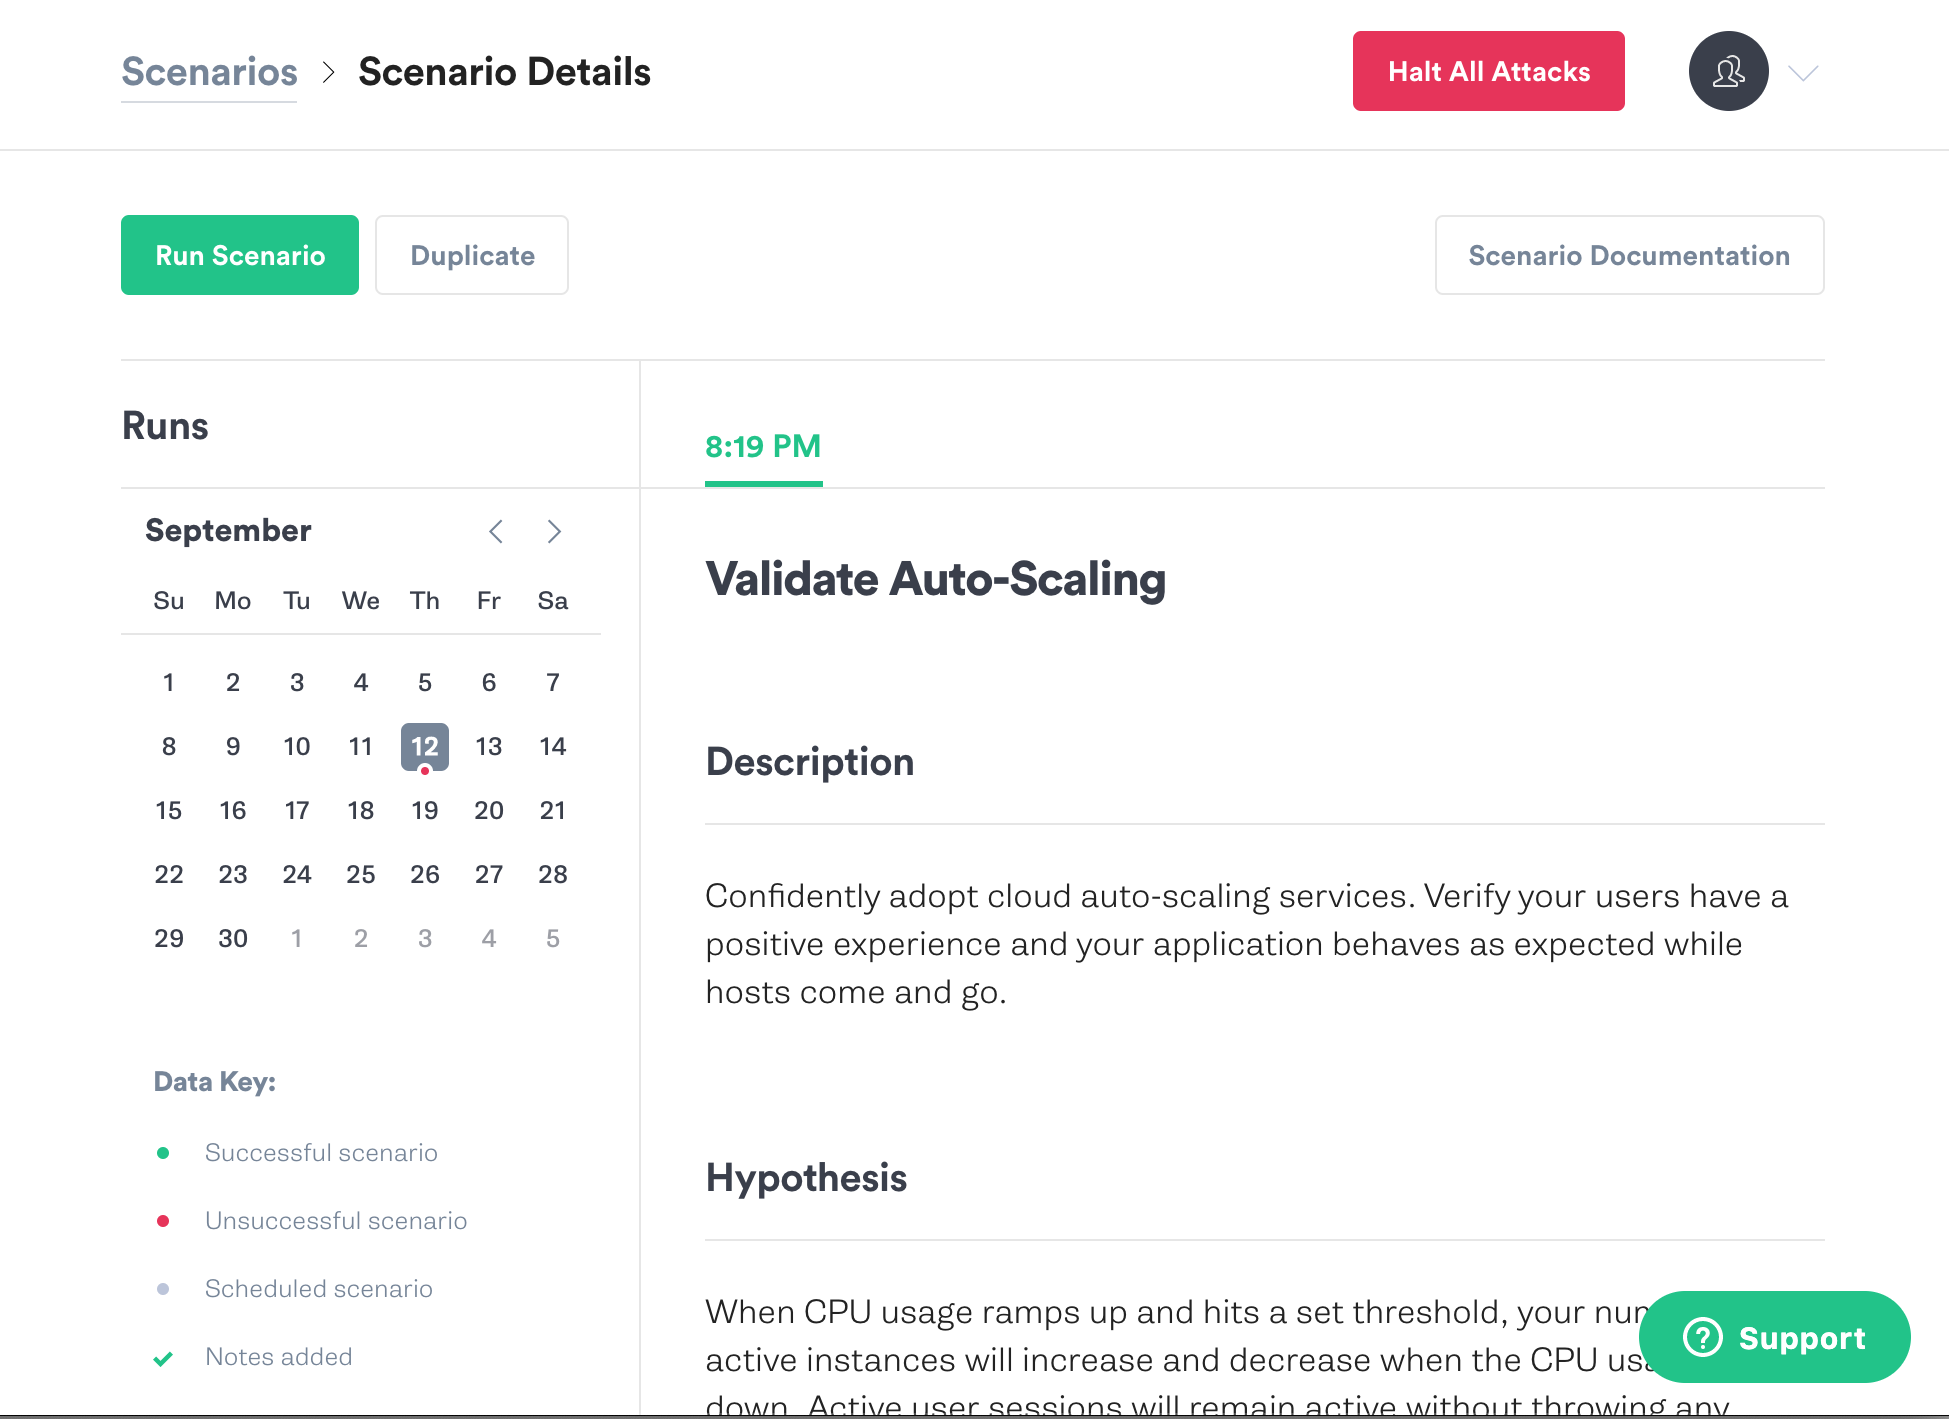
Find Validate Auto-Scaling in the Recommended Scenarios and click the View Details button.
Read the Description and Hypothesis. Scenario Descriptions map the Gremlin Attacks (CPU, Memory, Shutdown, etc.) to real world scenarios that you should relate to.
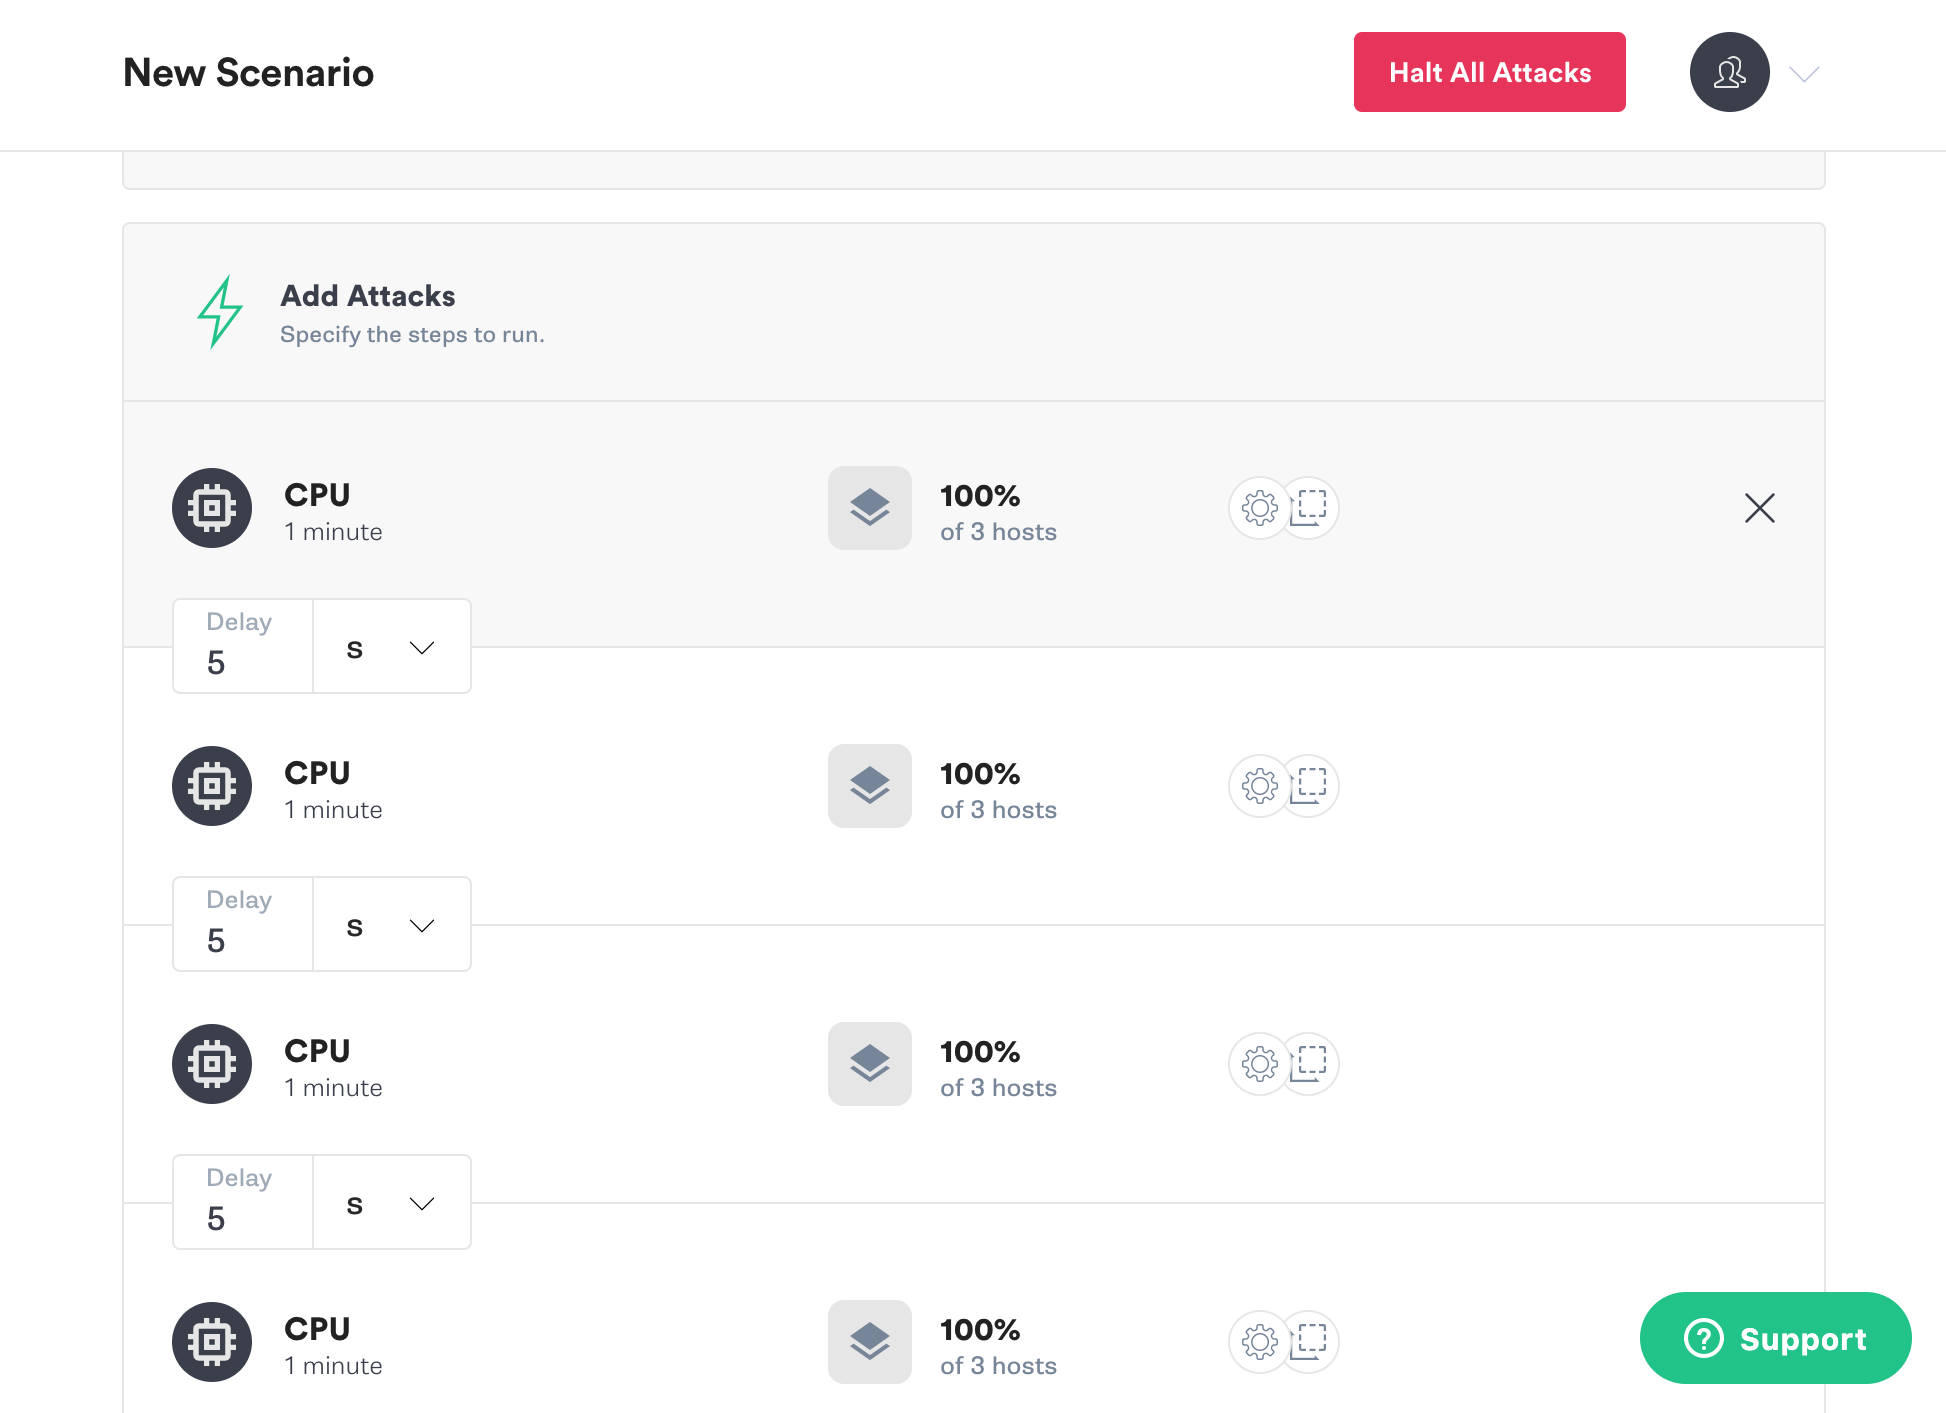
Scroll down. You’ll see there are a number of chained CPU attacks in this scenario. It’s similar to our custom CPU scenario where we chained the attacks, but this time we didn’t have to do that extra work.
Click the “Add targets and run” button.
This will take us back to the Targeting interface again. Click Containers. We can specify a service or tags to narrow the blast radius of the attack, but let’s run it against all the containers. Notice the Blast Radius image shows all containers are targets (the outer ring), but the hosts are not.
Scroll down to the bottom of the screen and click Run Scenario. Click Run Scenario on the popup confirmation screen.
You will be returned to the Scenario Details page. This Scenario will take 4 minutes to run, as we have chained 4 CPU attacks of 1 minute each.
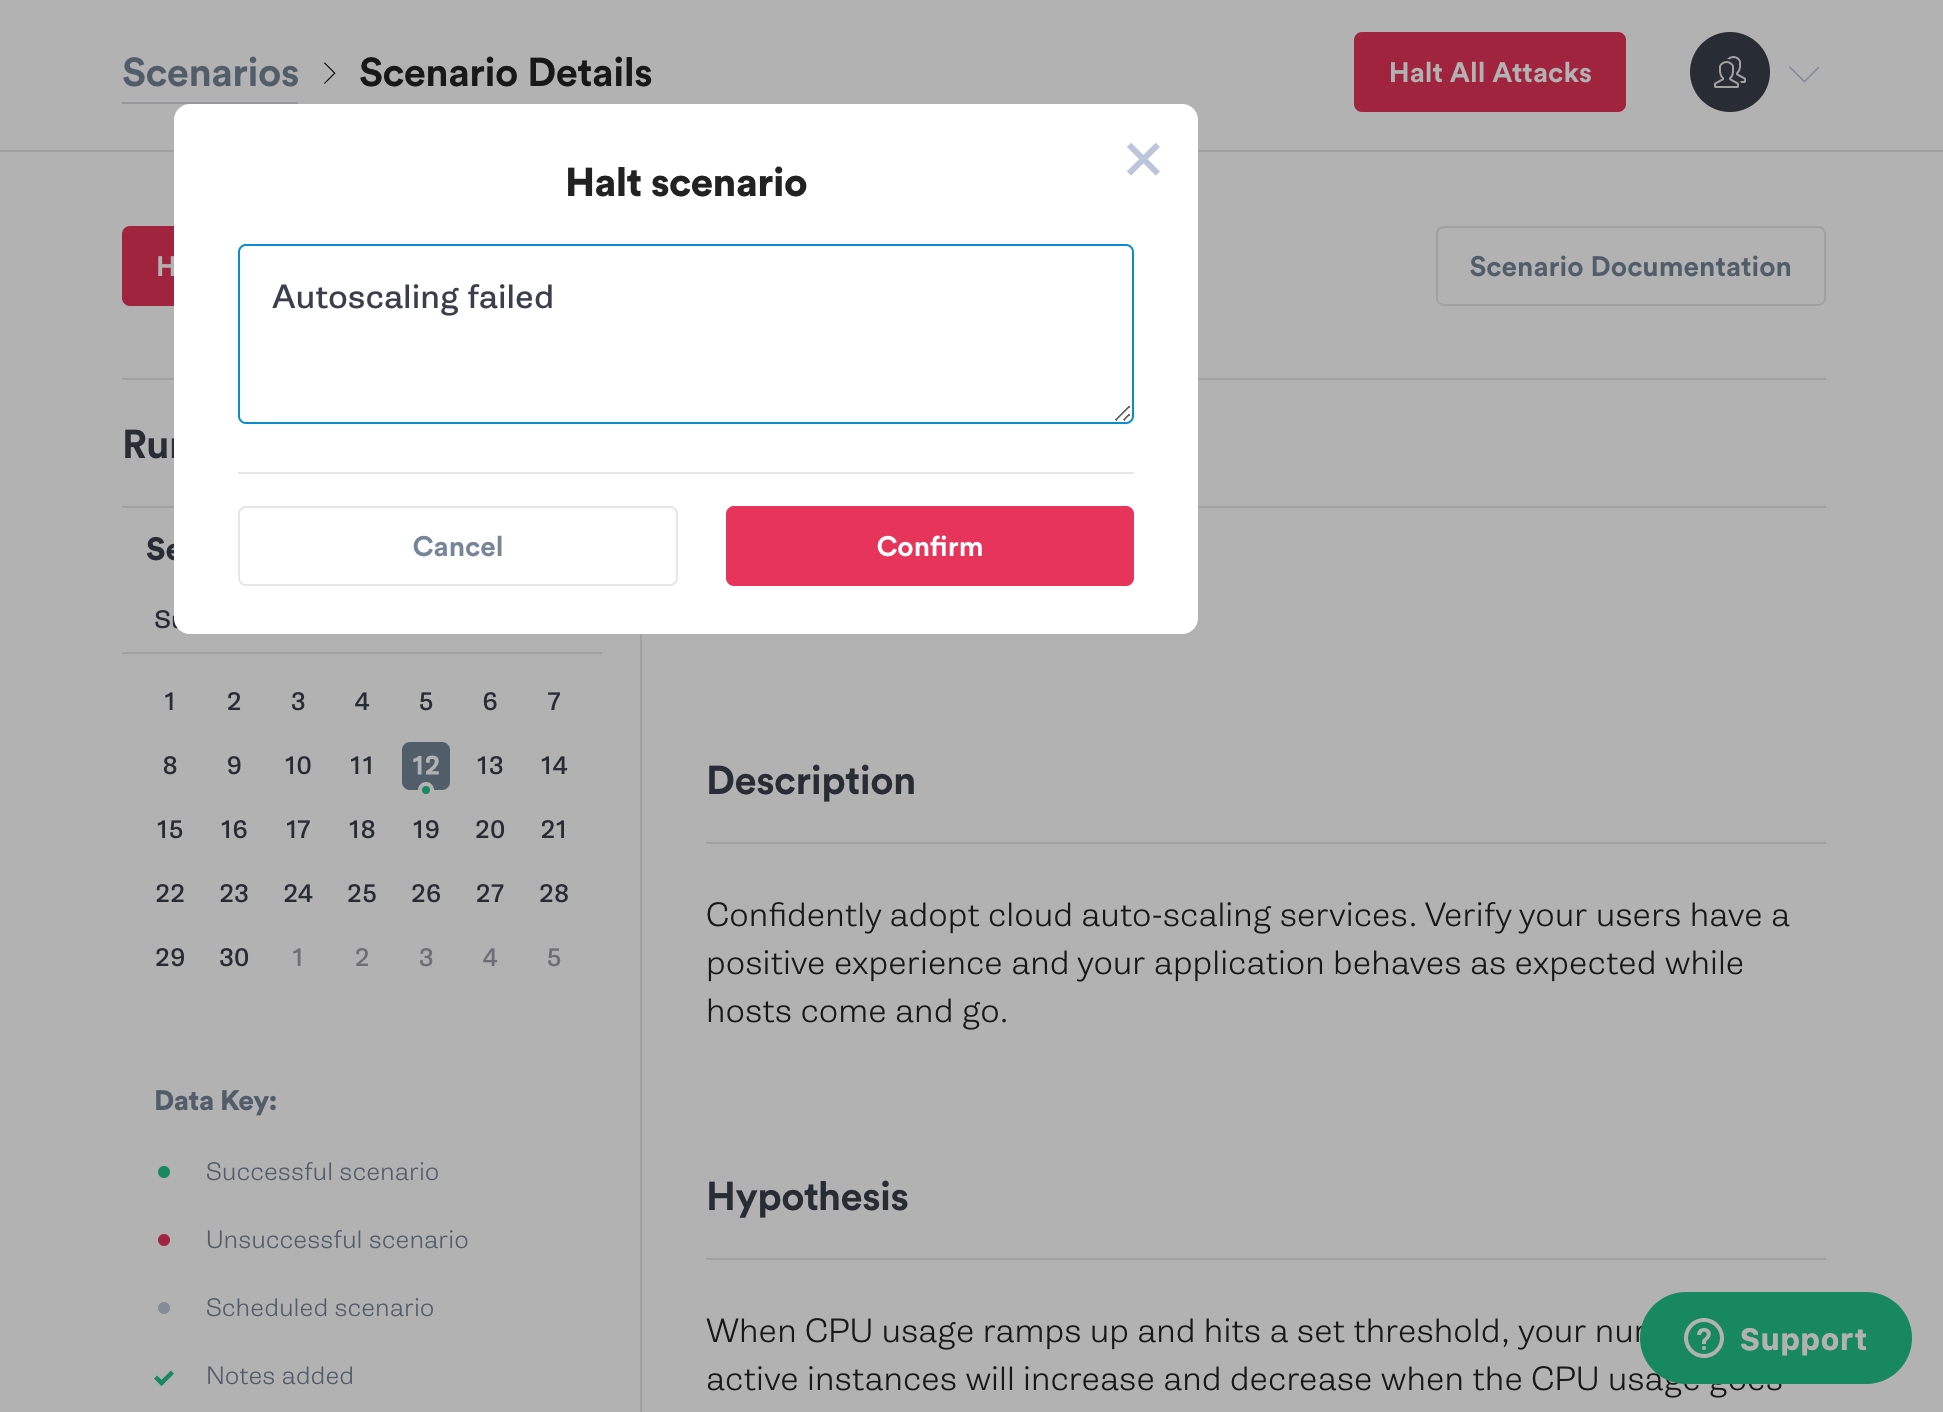
Let’s imagine that our autoscaling group failed to provision more hosts to handle the extra CPU load. We want to halt the scenario to avoid impacting production traffic.
Click the red Halt Scenario button in the upper left, and enter “Autoscaling failed” as the reason in the popup window. Hit the red Confirm button.
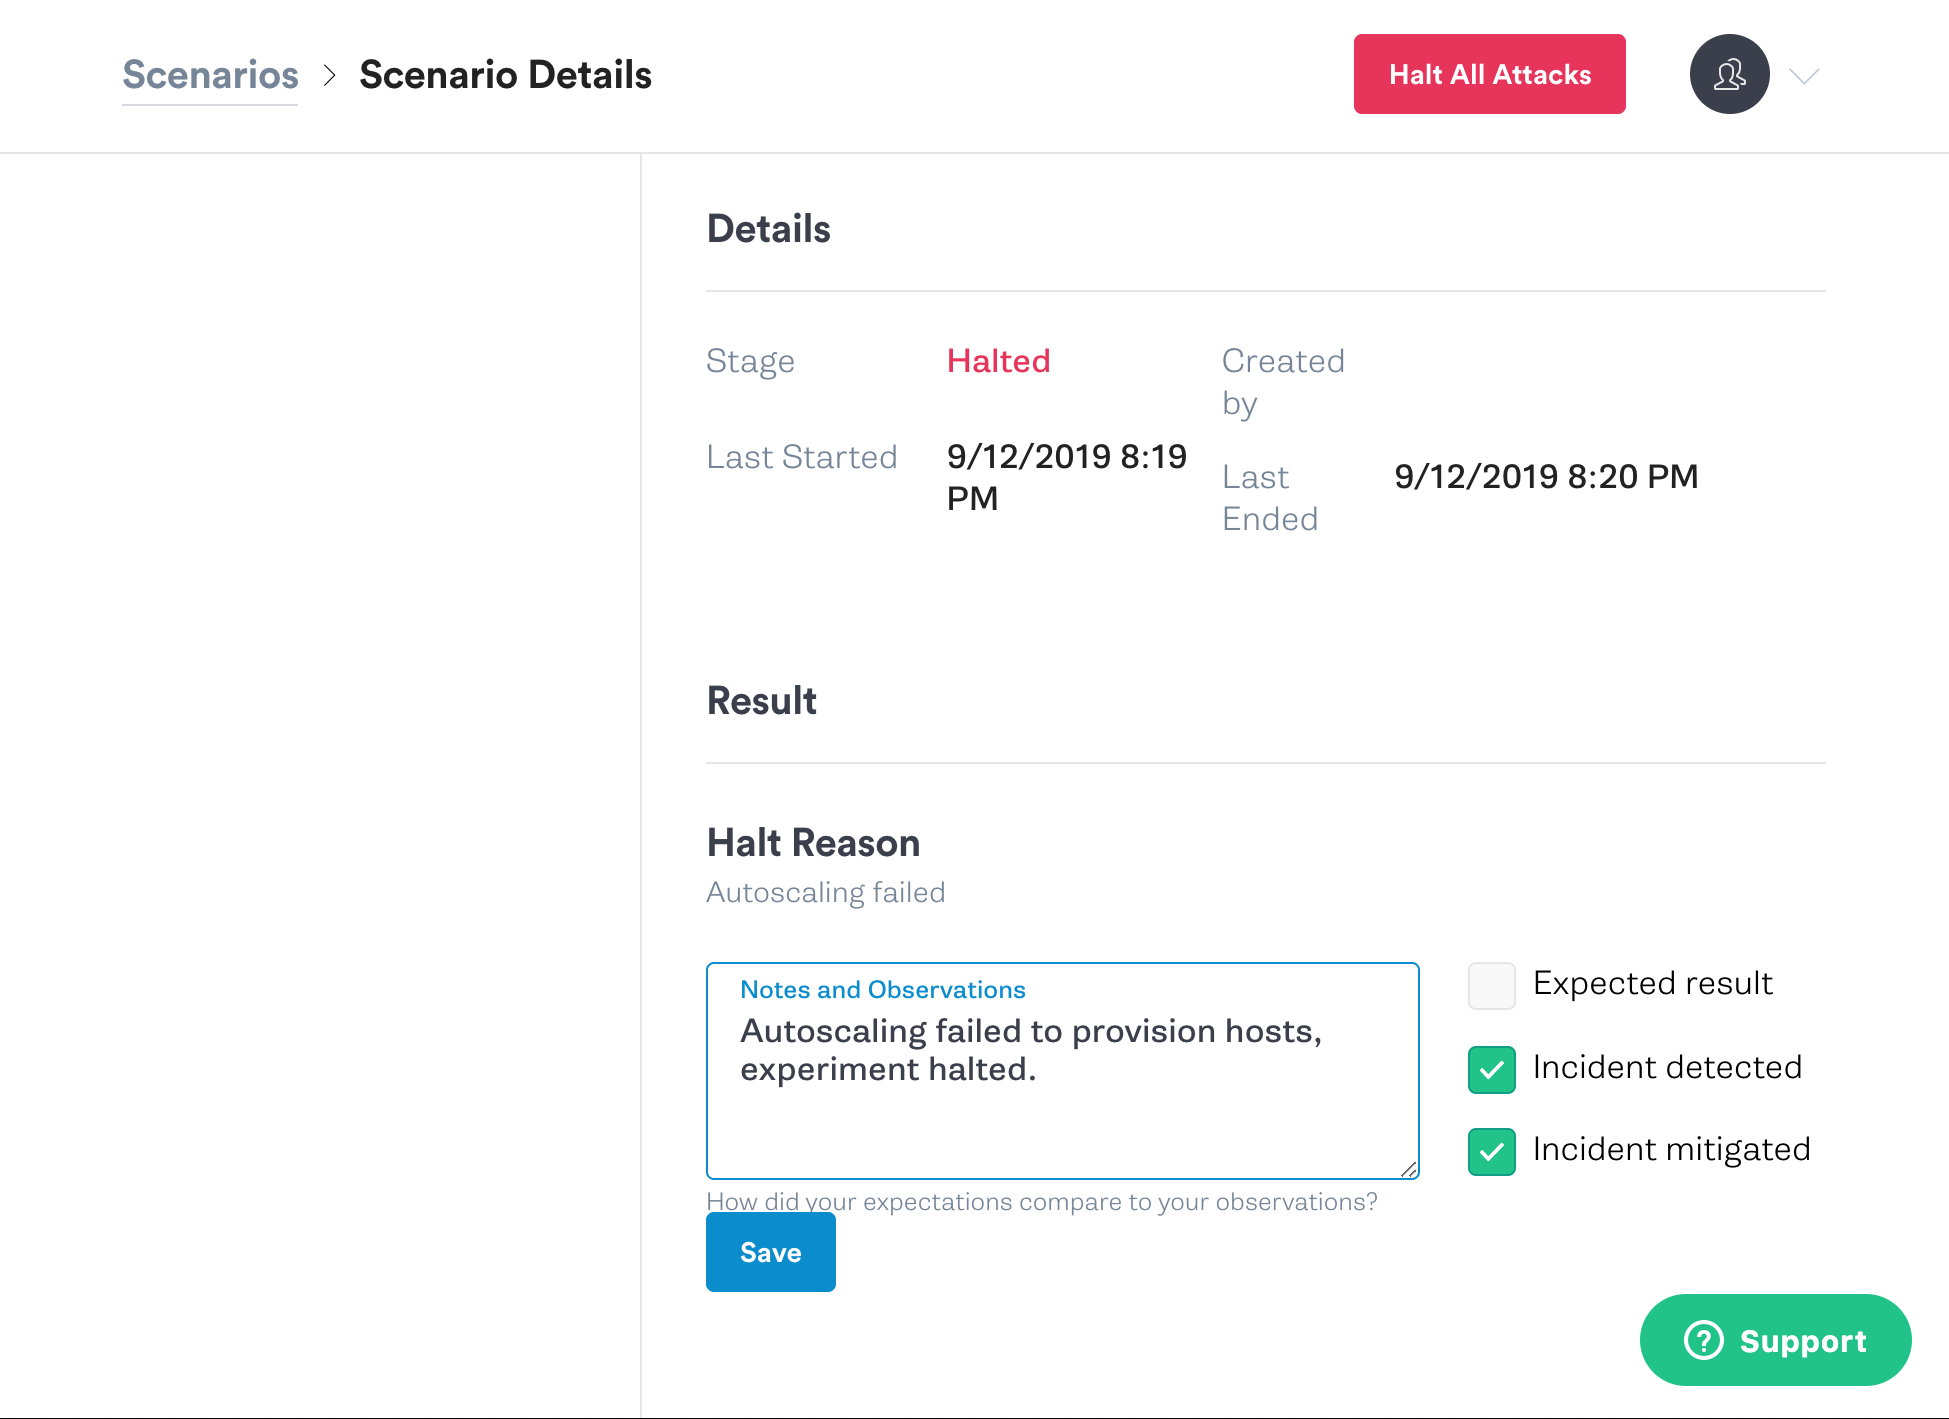
Scroll down on the Scenario Details screen. This time you’ll see the scenario is marked as Halted.
We detected an incident and mitigated it by halting the scenario. Click the “Incident detected” and “Incident mitigated” check boxes. Enter the result in the Notes and Observations box and hit Save.
Next, click the Duplicate button near the top of the screen.
That places us back in the customization workflow. Scroll down until you see Add Attacks, and click it.
Now hover your mouse over the first CPU attack. You’ll see an X appear on the right of the attack. Click that X to delete the first CPU attack.
Scroll down. We could run the scenario again with the new settings, but instead hit the Save Scenario button.
This will place us back in the Drafts view, with our customized scenario at the top of the list. From here we could run the customized scenario, or edit it to make more changes.
Conclusion
We’ve learned how to use Gremlin Scenarios to make our Chaos Engineering experiments easier to run and reproduce. We learned how to create, run and customize a Custom Scenario, and how to run and customize a Recommended Scenario.
Recommended Scenarios let us map real-world outages to our Chaos Engineering experiments, and get started faster. Custom Scenarios allow us to build our own scenarios that we can share with our team. We can view what happened with our Chaos Engineering experiments and view the recorded results, right in the Gremlin UI.
You can find out more about Gremlin Scenarios by reading the documentation. To learn more about Chaos Engineering join our Chaos Engineering Slack, and read more tutorials on our Community page.
Avoid downtime. Use Gremlin to turn failure into resilience.
Gremlin empowers you to proactively root out failure before it causes downtime. See how you can harness chaos to build resilient systems by requesting a demo of Gremlin.

.svg)