


Scenarios
Supported platforms:
A Scenario is a set of Health Checks and Gremlin experiments that you can define, along with a name, description, hypothesis, and detailed results. Scenarios let you run one or more experiments sequentially and/or simultaneously using branching. This makes them useful for situations like recreating past outages, simulating complex real-world outages, or testing multiple aspects of a system simultaneously. After each Scenario run, you can view the results and record your observations directly in the Gremlin web app.
Gremlin offers two types of Scenarios: Recommended Scenarios, and custom Scenarios. All Scenarios include a name, description, and sequence of actions to perform.
Recommended Scenarios
Gremlin provides a suite of pre-configured Scenarios called Recommended Scenarios. These were created to test real-world failure modes, or to use as examples to customize to your needs. To browse our library of Recommended Scenarios, log into the web app, click on Scenarios, then click on the Recommended tab.

Running a Recommended Scenario
To run a Recommended Scenario:
- In the Gremlin web app, open the Recommended Scenario you wish to run.
- Click Add targets and run.
- Select the targets you want to run the experiment on. To learn more about target selection, see Targets.
- Click Run Scenario.
Each experiment in the Scenario runs on the same set of targets. If you want to have different targets for each step of the Scenario, or mix target types, either customize the Recommended Scenario or create a custom Scenario.
Customizing a Recommended Scenario
To customize and run a Recommended Scenario, select the Scenario you want to run, and select "Customize" (you can also select "Add Targets and Run" from the Recommended Scenario's details page, then select "Customize" on the targeting slide-out). This will create a copy of the Scenario and allow you to edit any of the fields, experiments, and targets of the Scenario. You can thenbe saved as a draft or run.
When customizing the Recommended Scenario, you can select different targeting options for each of the experiment steps in the Scenario.
Creating a custom Scenario
To create your own custom Scenario:
- Open the Gremlin web app, navigate to Scenarios, and click New Scenario.
- Enter a Name for the Scenario. As a recommendation, the name should reflect what the experiment is testing for, e.g. "Test TLS Certificate Expiration."
- Enter a Description of the Scenario. While this field is optional, it's useful for describing what the Scenario is intended to test.
- This is also a good place to enter a hypothesis, which is an assumption about how your application or environment will behave while the Scenario is running. How will your system react to the failure modes you'll be exposing it to? Is your system designed to handle this type of failure? If so, is the system working as designed? A hypothesis is useful for recording and validating expected behavior and assumptions about your system to see how actual behavior may differ from what is expected.
- Configure your Scenario by adding Health Checks and nodes. These are explained in detail in the following sections.
- Click Save Scenario.
Health Checks
A Health Check is an automatic check that determines whether your system is in a healthy enough state to continue testing. Adding a Health Check is highly recommended as it creates automatic halt conditions to safely stop the Scenario, validates your system is in a steady state, and validates that your system returned to normal after an experiment before running the next experiment in the Scenario.
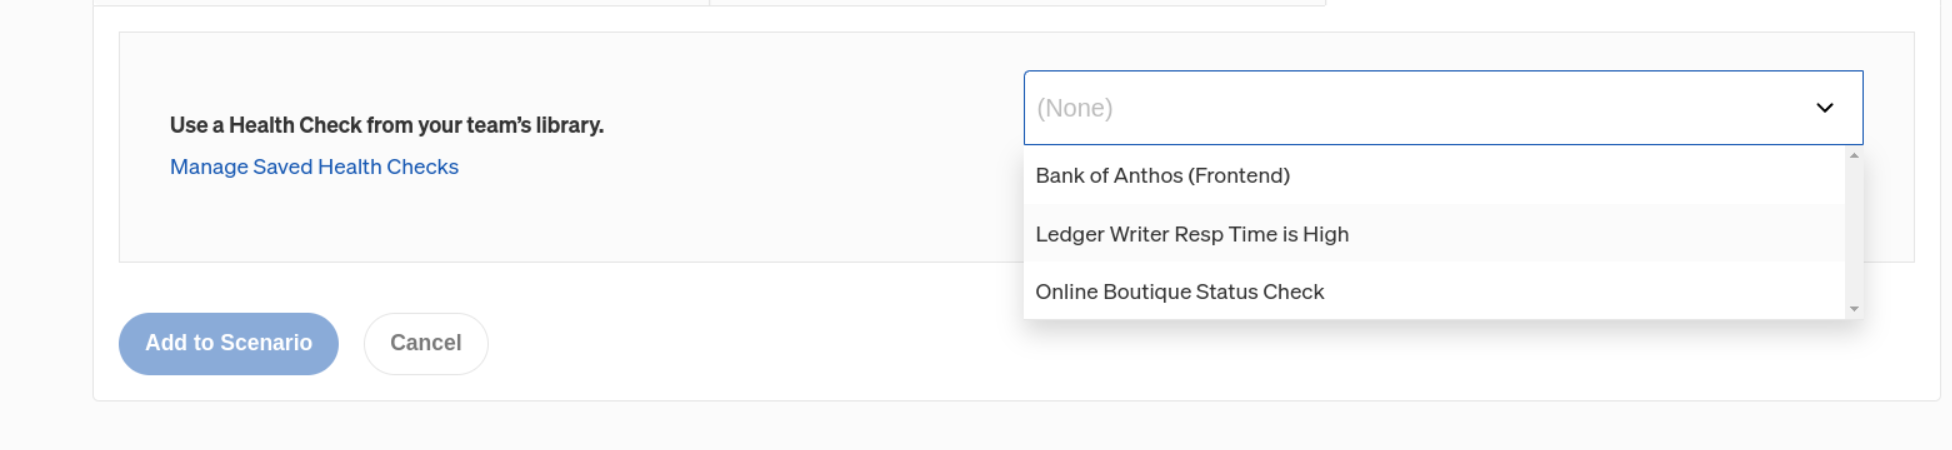
To add a Health Check, click Add Health Check. Use the drop down menu to import a Health Check from the Health Check library within the Scenario creation workflow.
Health Check periodicity
Health Checks added this way are continuous, meaning they run regularly every 10 seconds (this can be changed for custom Health Checks). You can make a Health Check a one-time event by adding it under Health Checks. We recommend using continuous Health Checks, but if you want to use one-time Health Checks, the best practice is to add a Health Check before the start of each experiment to validate your service is in a healthy state before introducing failure. In some cases you might want to add a Health Check at the end of an experiment or Scenario to validate your service returned to its steady state.
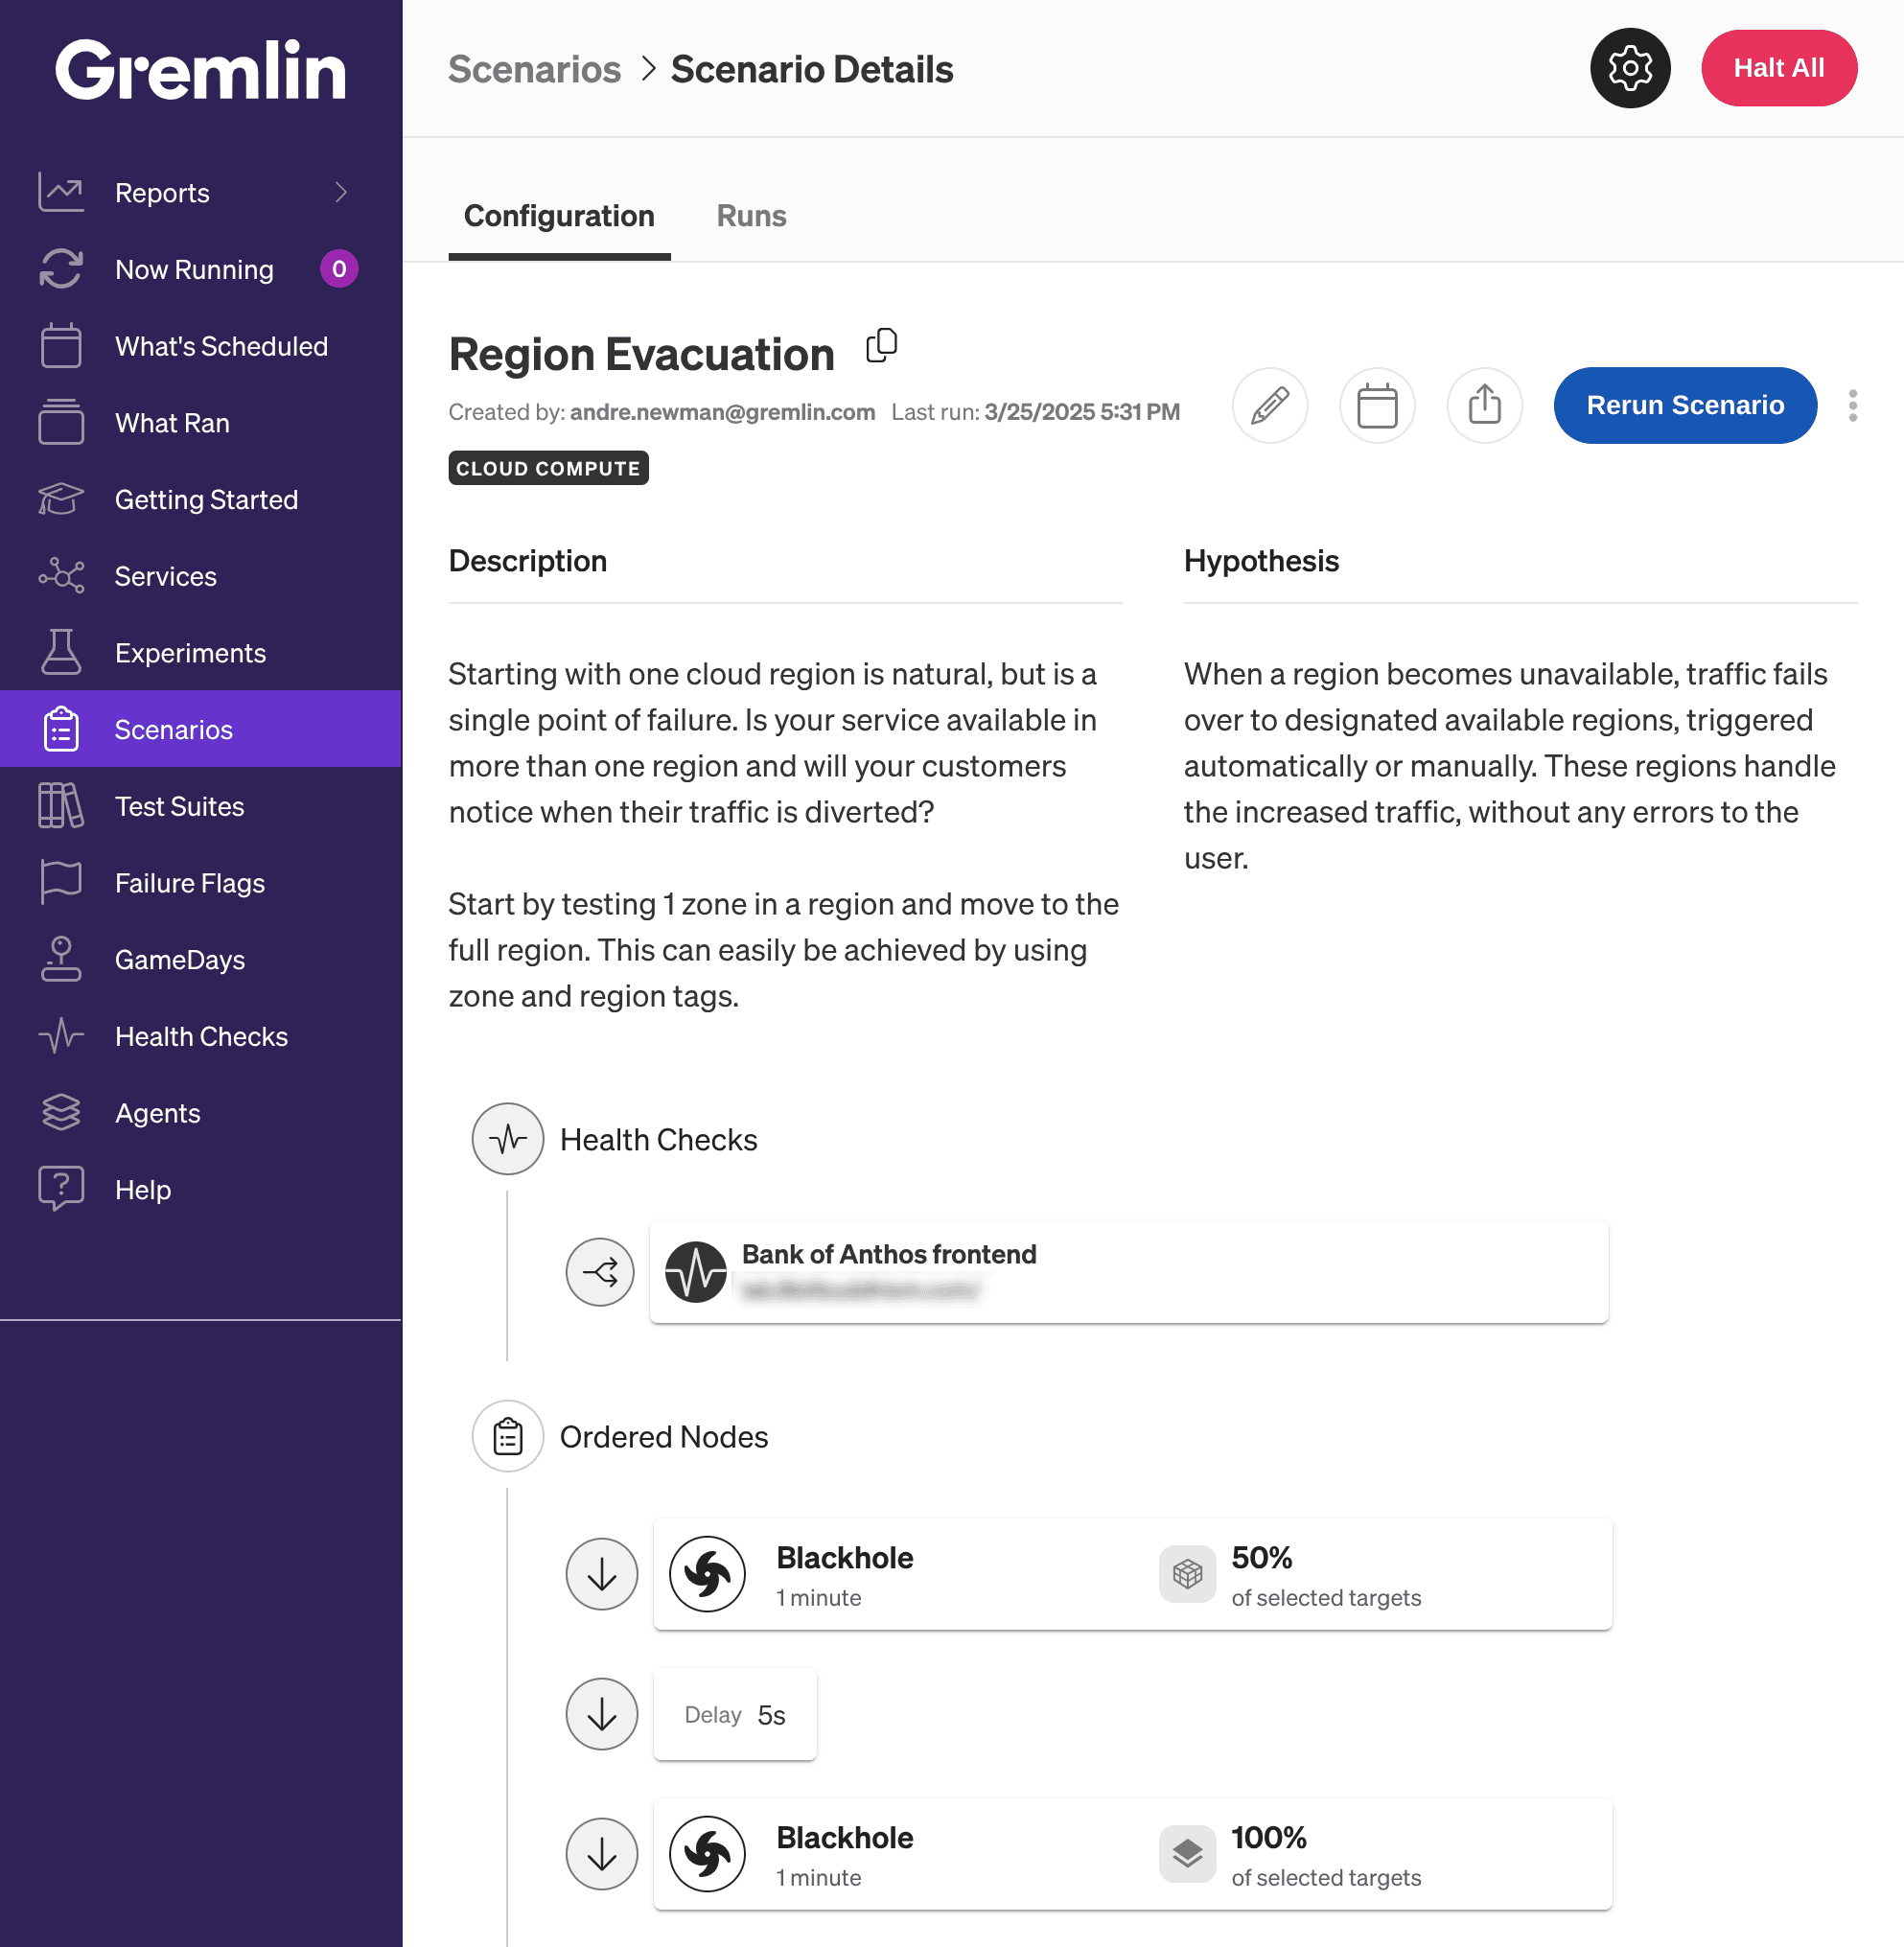
Ordered Nodes
The Scenario builder organizes experiments into nodes, which are individual steps in a Scenario. These include:
- New Experiment: define a new experiment from scratch.
- Completed Experiment: select from a list of recently completed experiments.
- New Failure Flag Impact: define a new Failure Flag experiment from scratch.
- Existing Failure Flag Impact: select from a list of recently completed Failure Flags experiments.
- Health Check: add a one-time Health Check in between experiments, instead of running a single continuous Health Check.
- Delay: pause the Scenario for the amount of time specified.
- Concurrent Node: branch the Scenario into multiple different paths that execute simultaneously.
When adding a new experiment, follow the standard process for creating an experiment: select the targets to impact, select the experiment type, customize the configuration options, then click Update Scenario. To edit an experiment after adding it, click on the menu on the right-hand side of the experiment card and click Edit. Click Delete to remove the experiment from the Scenario.
Add as many experiments as you like, changing the tags of hosts to target and experiment configuration as desired to grow the blast radius. You can also add multiple experiment types to recreate incidents with multiple failure modes, introduce cascading failure, and ultimately build Scenarios that make use cases easy to develop.
Gremlin supports up to 99 nodes per Scenario.
Targets
When running a Scenario, Gremlin lets you chose which set of hosts, containers, Kubernetes resources, or Failure Flags to target at runtime. By default, no targets are selected. This is done for safety to prevent users from accidentally experimenting on all targets. This is also why you cannot select individual targets (e.g., specific hosts or containers) when creating a Scenario. To expand the blast radius of the experiment, select one or more tags per category.
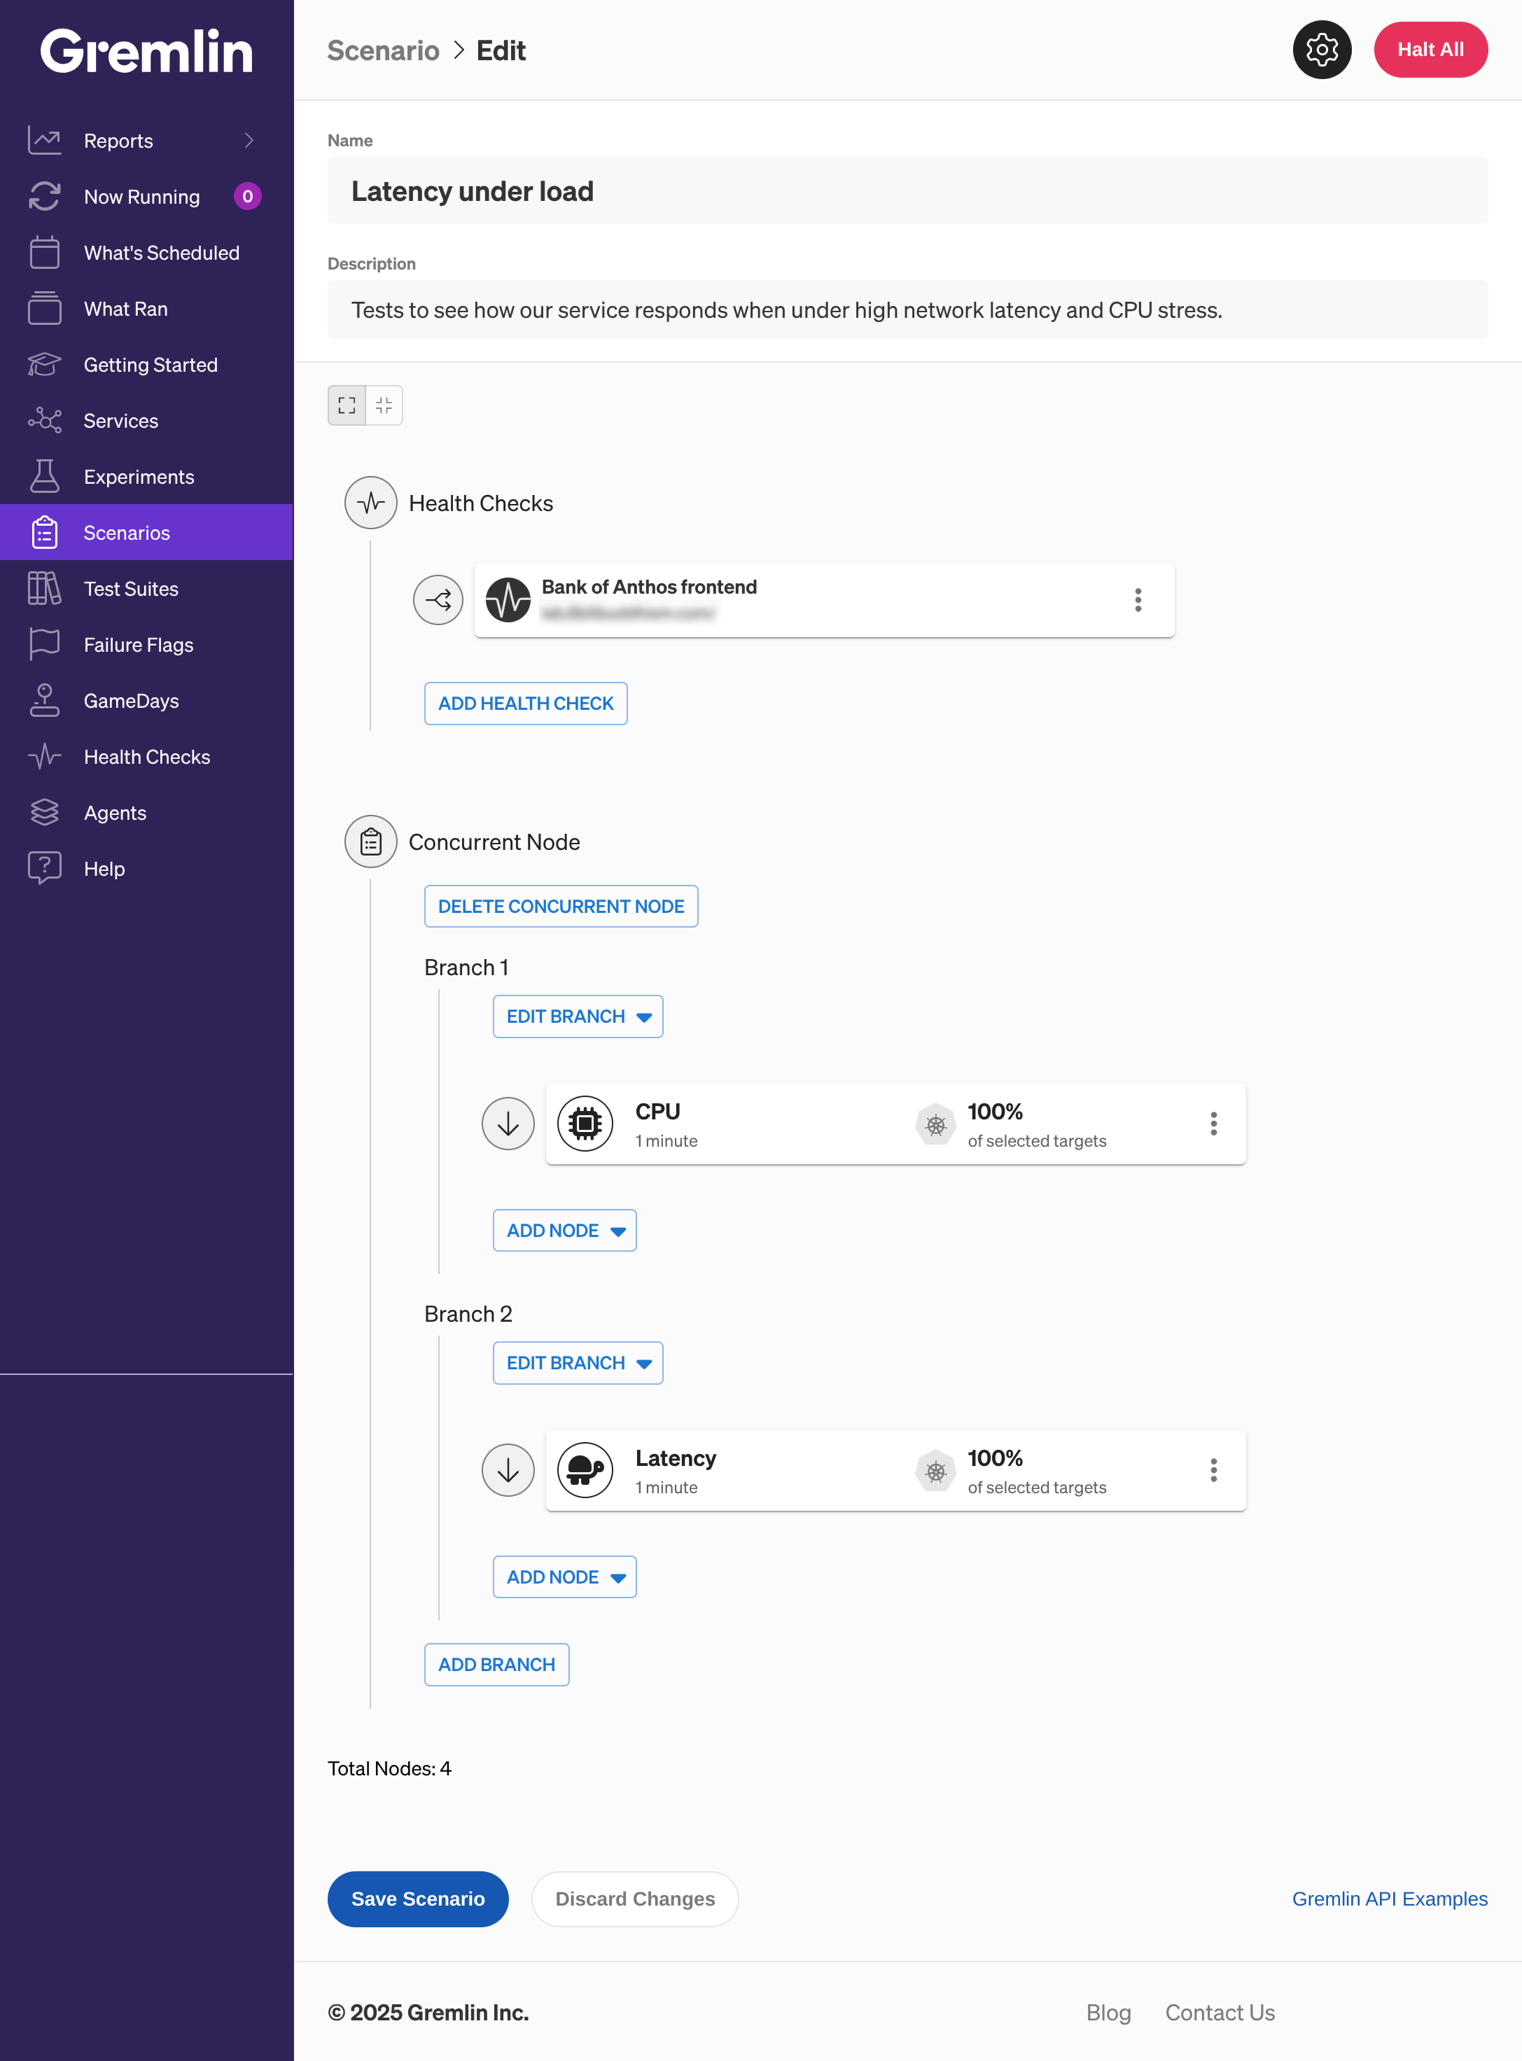
Branching
Scenarios support branching, which lets you run one or more experiments simultaneously. To create a branch:
- Click Add, then Concurrent Node. This creates two new nodes: one titled "Concurrent Branches", and one titled "Branch 1".
- Under "Branch 1", click Add to Branch and select the node you wish to add. You can keep adding nodes to the branch.
- To create a second branch to run concurrently to the first, click Append Branch. This adds a second branch titled "Branch 2".
- You can also use the Insert Branch button to specify whether to add the new branch before or after the current one.
- If you need to reorganize branches, click the Move Branch button and select whether to move the selected branch Up or Down the list.
You can move a branch along the list using the Move Branch button. To delete a single branch, click Delete Branch. To delete an entire series of concurrent branches, click Delete Concurrent Branches.
For example, the following screenshot shows a Scenario that runs two concurrent experiments: a CPU experiment, and a latency experiment. A Health Check runs continuously during the Scenario.
Saving, drafting, and deleting Scenarios
Save the Scenario to have it enter a draft state. The Scenario will be visible in the list of Scenarios and the experiment configuration can continue to be edited.
When a Scenario is no longer relevant or needed, you can delete the Scenario to remove it from your Gremlin team. To delete a Scenario, open it in the Gremlin web app, click the menu button next to Rerun Scenario, then click Delete.
Running a Scenario
You can start a Scenario from the Scenario configuration view or its card in the Scenario list. A Scenario will show that it's running with a message at the top along with a Halt Scenario button. The active experiment within the Scenario will be visually indicated. As each experiment progresses, the state and logs of each experiment are available. Halting a Scenario will immediately stop the experiment underway and prevent the Scenario from running any remaining experiments.
Editing a Scenario
To edit a Scenario, open the Scenario you want to edit, and click on the "Edit Scenario" icon. You can also edit a Scenario from the Scenario list cards. Hover your cursor over the card to show the overflow menu. Click the overflow menu icon and select “Edit". This will pull up the latest configuration of the Scenario and allow you to change any Health Check or experiment parameter and targets. The Scenario can then be saved or run and will become the latest configuration. This is a great way to iterate and safely grow your blast radius and magnitude of impact while keeping a history of previous runs.
Monitor Scenarios in real time
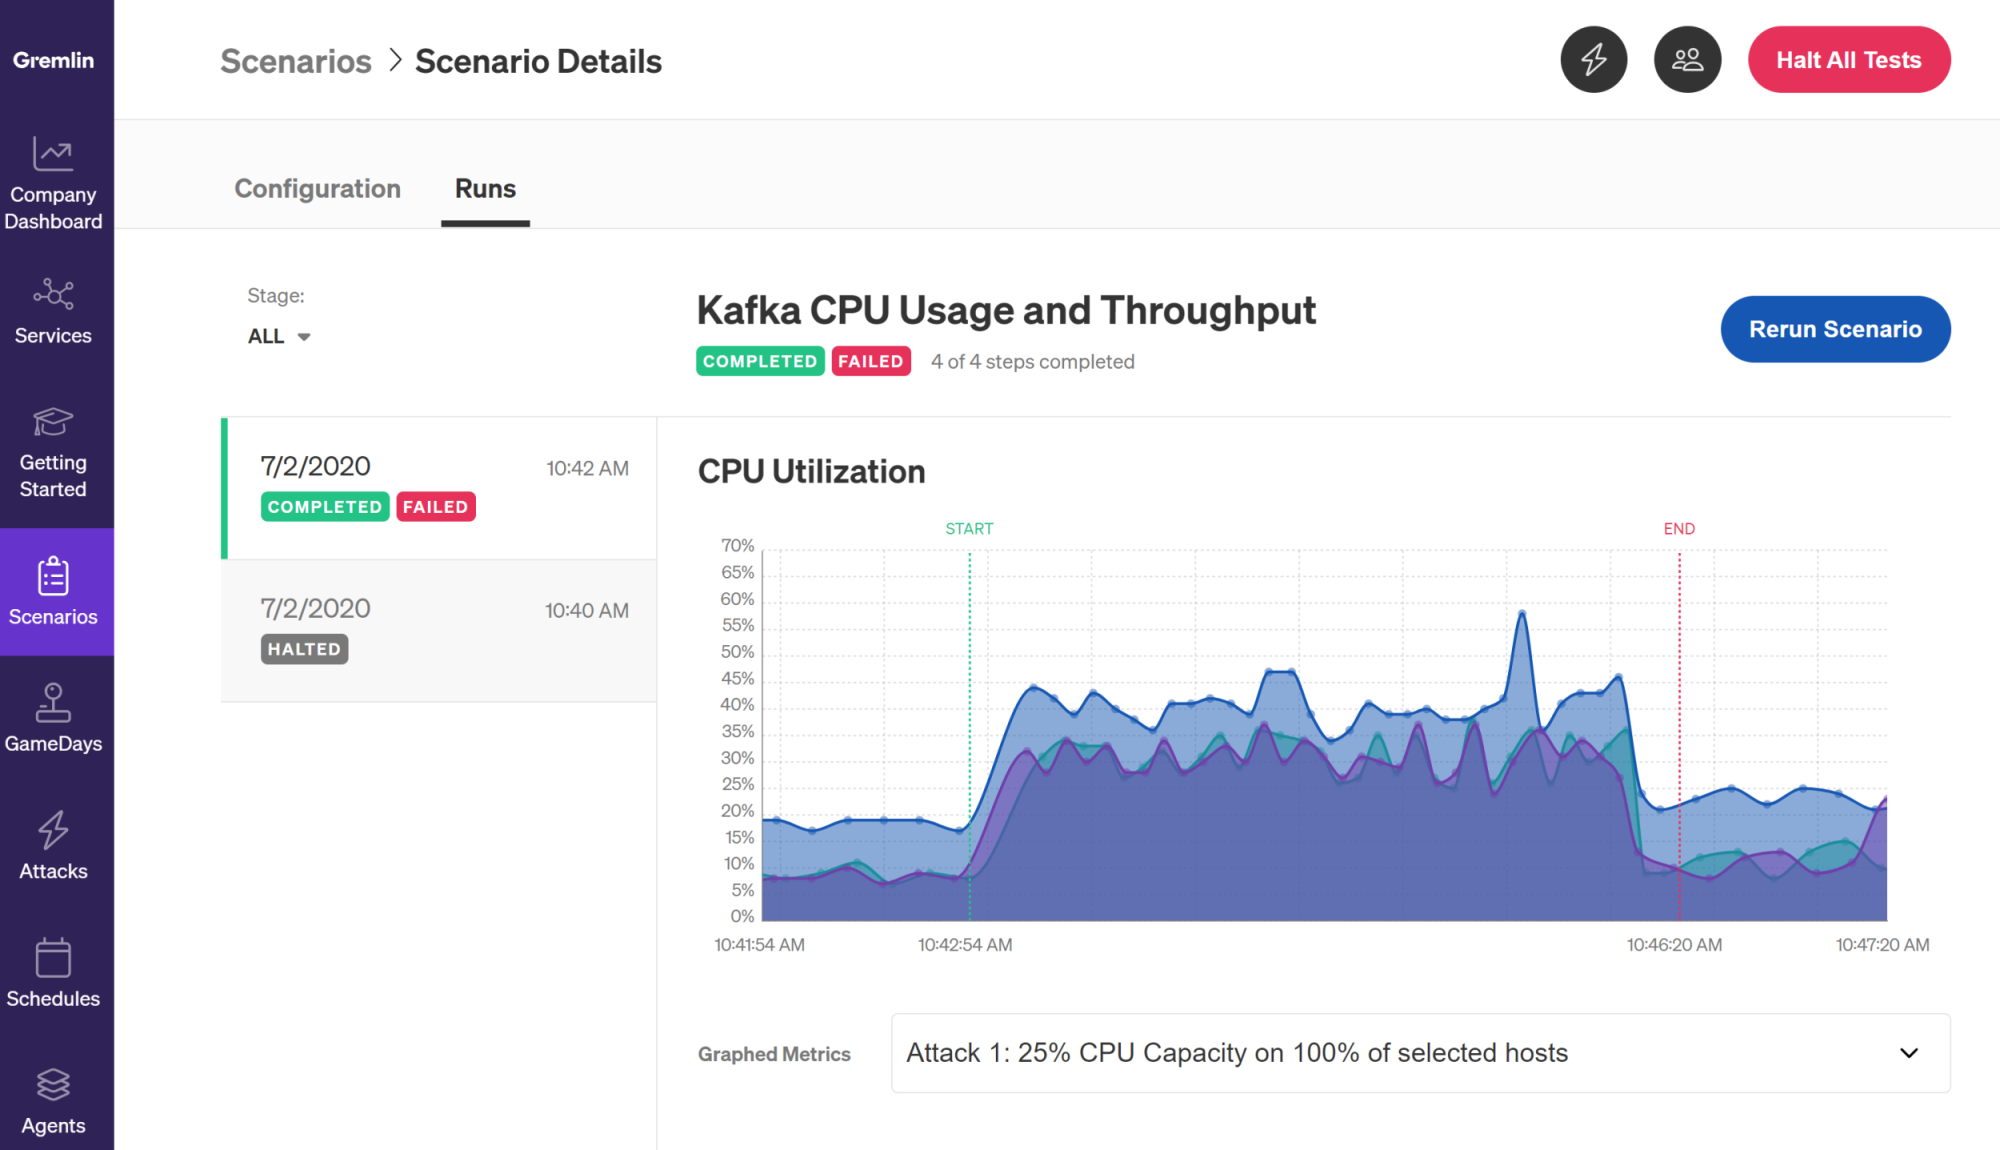
The experiment visualization feature is available for scenarios as well, allowing you to monitor the impact of the chaos experiments on your environment. This allows you to quickly verify the effect of your experiments and also to save the results for future reference.
Company admins can turn this feature on for the entire company by navigating to “Company Settings”, clicking on the “Settings” tab, and toggling “Attack Visualizations” on.
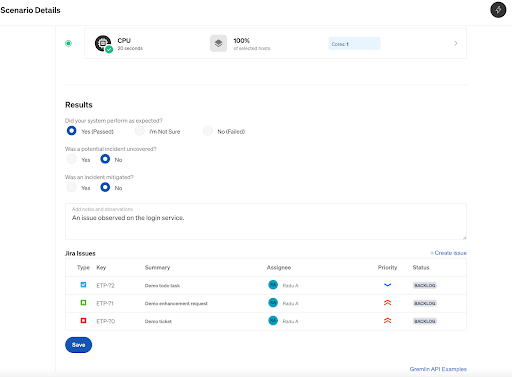
Results
The Scenario details view shows on which day and when the Scenario has been run. For each run of a Scenario, the result of the Scenario is available. You can enter notes and observations for the Scenario run, as well as indicating with checkboxes whether the Scenario produced an expected result or if an incident was detected and/or mitigated.
Tracking results in Jira
With Gremlin’s Jira integration, you can create and track Jira issues directly from Scenario Runs and GameDay Summaries. Jira integration must be enabled at the individual user level. See Enabling Jira integration for more information.
The Project, Issue Type, Priority, Assignee, and labels are all retrieved based on the content in your connected Jira Cloud instance. You can attach existing labels to the issue or create new ones, just as you would in Jira. To create a new label, type the value and press Enter.
The Summary field represents the Jira issue name and the Description section is automatically populated with information about the Scenario Run. It also contains the results and a link back to the Scenario Run.
All issues linked to a Scenario Run are listed under the Jira Issues section. The Summary, Assignee, Priority, and Status are updated from Jira when you open the page, and the information is cached for 5 minutes. To view an issue from the list in Jira, just click on it.
Creating a Jira issue
To create a Jira issue:
- On a Scenario Details page, click the Runs tab.
- Under the Jira Issues section, click Create Issue.
- In the Create Jira Issue popup, select the Project, Issue Type, Priority, Assignee, and any labels you want to use. The Summary and Description contains information from the Scenario Run; you can edit this information as necessary.
- Click Create Issue. The new Jira issue will be created in the selected project and listed in the Jira Issues section in Gremlin.

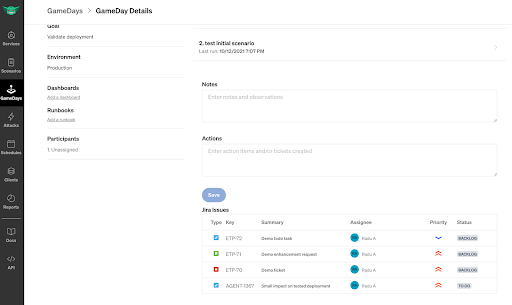
Gameday Summary Page
During a GameDay, you can create multiple Jira issues for each Scenario Run. These will be listed under the Runs tab for each specific Scenario Run. On the GameDay Summary page, you will see a cumulative list of all Jira issues created during that GameDay, meaning all issues under all Scenario Runs.
History
View the history of a Scenario by opening a Scenario and clicking on the Runs tab to see a historical list of previous runs. Runs are listed in reverse chronological order. You can use the filter if you want to find specific results. You can also click on a previous run and click Revert to this version to run that specific configuration.
Duplicating a Scenario
To duplicate a Scenario, open the Scenario you want to duplicate, click the overflow menu on the configuration page, and select “Duplicate”. You can also duplicate a Scenario from the Scenario list cards. Hover your cursor over the card to show the overflow menu. Click the overflow menu icon and select “Duplicate". This will create a copy of the previous Scenario. From there, the details, Health Checks, experiments, and targets can be changed. The Scenario can then be saved or run.
Additional resources
For additional information on Scenario features, visit the following pages: