Chaos Engineering on Docker Swarm with Gremlin and Datadog

.svg)
.svg)

 This is an older tutorial
Introduction
Gremlin is a simple, safe and secure service for performing Chaos Engineering experiments through a SaaS-based platform. We will be deploying a web application using Docker Swarm and using Datadog to monitor it.
This tutorial will teach you how to replicate the demo environment I used for my DockerCon 2019 talk as part of the Black Belt Track. Feel free to watch it on YouTube.
Prerequisites
Before you begin this tutorial, you’ll need the following:
- Three hosts running Ubuntu 18.04
- A Gremlin account (request a free trial here)
- A Datadog account (sign up here)
Overview
This tutorial will show you how to use Gremlin, Datadog and Docker Swarm
- Step 1: Setup Docker
- Step 2: Setup the demo application
- Step 3: Setup Docker Swarm Visualizer
- Step 4: Install Datadog
- Step 5: Setup Datadog tags
- Step 6: Setup Datadog Monitors
- Step 7: Install Gremlin
- Step 8: Experiment #1: Test recoverability using a shutdown attack on the visualizer container
- Step 9: Experiment #2: Validate monitoring by running a CPU attack on all hosts
- Step 10: Experiment #3: Test disaster recovery using a host shutdown attack
Step 1: Setup Docker
First, install Docker onto all three of your hosts. Start by SSHing into the first host:
Next, add the official Docker GPG key:
Use the following command to add the Docker repository for stable releases:
Update the apt package index:
Before installing Docker, check to make sure you are installing from the Docker repository instead of the Ubuntu 18.04 repositories:
Install the latest version of Docker CE:
Verify that Docker is installed and running:
Repeat this process on your other two hosts.
Next, we'll create a cluster. We'll be using Docker Swarm, an orchestration tool for clustering Docker nodes and scheduling containers. Docker Swarm comes installed with Docker automatically, we just need to enable it. First, we need to choose a host to run as the cluster leader, then specify the IP address we want to use to advertise the cluster (which Docker calls a “swarm”). Replace <span class="code-class-custom"><host ip></span> with the host's publicly accessible IP address:
This displays a command that you can use to join other hosts to the swarm. Run this command on your other hosts. It should look like this:
After running this command, let's go back to our leader and verify that the other two hosts joined by running:
We'll see a list of all three nodes and their status:
Step 2: Deploy the demo application
We'll be deploying a sample web application that lets visitors submit votes. This application has a web page with two clickable options (in this example, cats vs. dogs), and another page for viewing the vote results. You can learn more about this application on GitHub.
SSH into the host you're using as the swarm leader, then clone the application's GitHub repository:
Change to the new directory:
Deploy the application. This creates a new stack in the swarm named “vote”:
In a web browser, enter the address of the leader to view the demo application. The voting page broadcasts on port 5000, and the results page broadcasts on port 5001.
In this example, we'll access the voting app via <span class="code-class-custom">http://142.93.82.142:5000</span>. It should look like this:

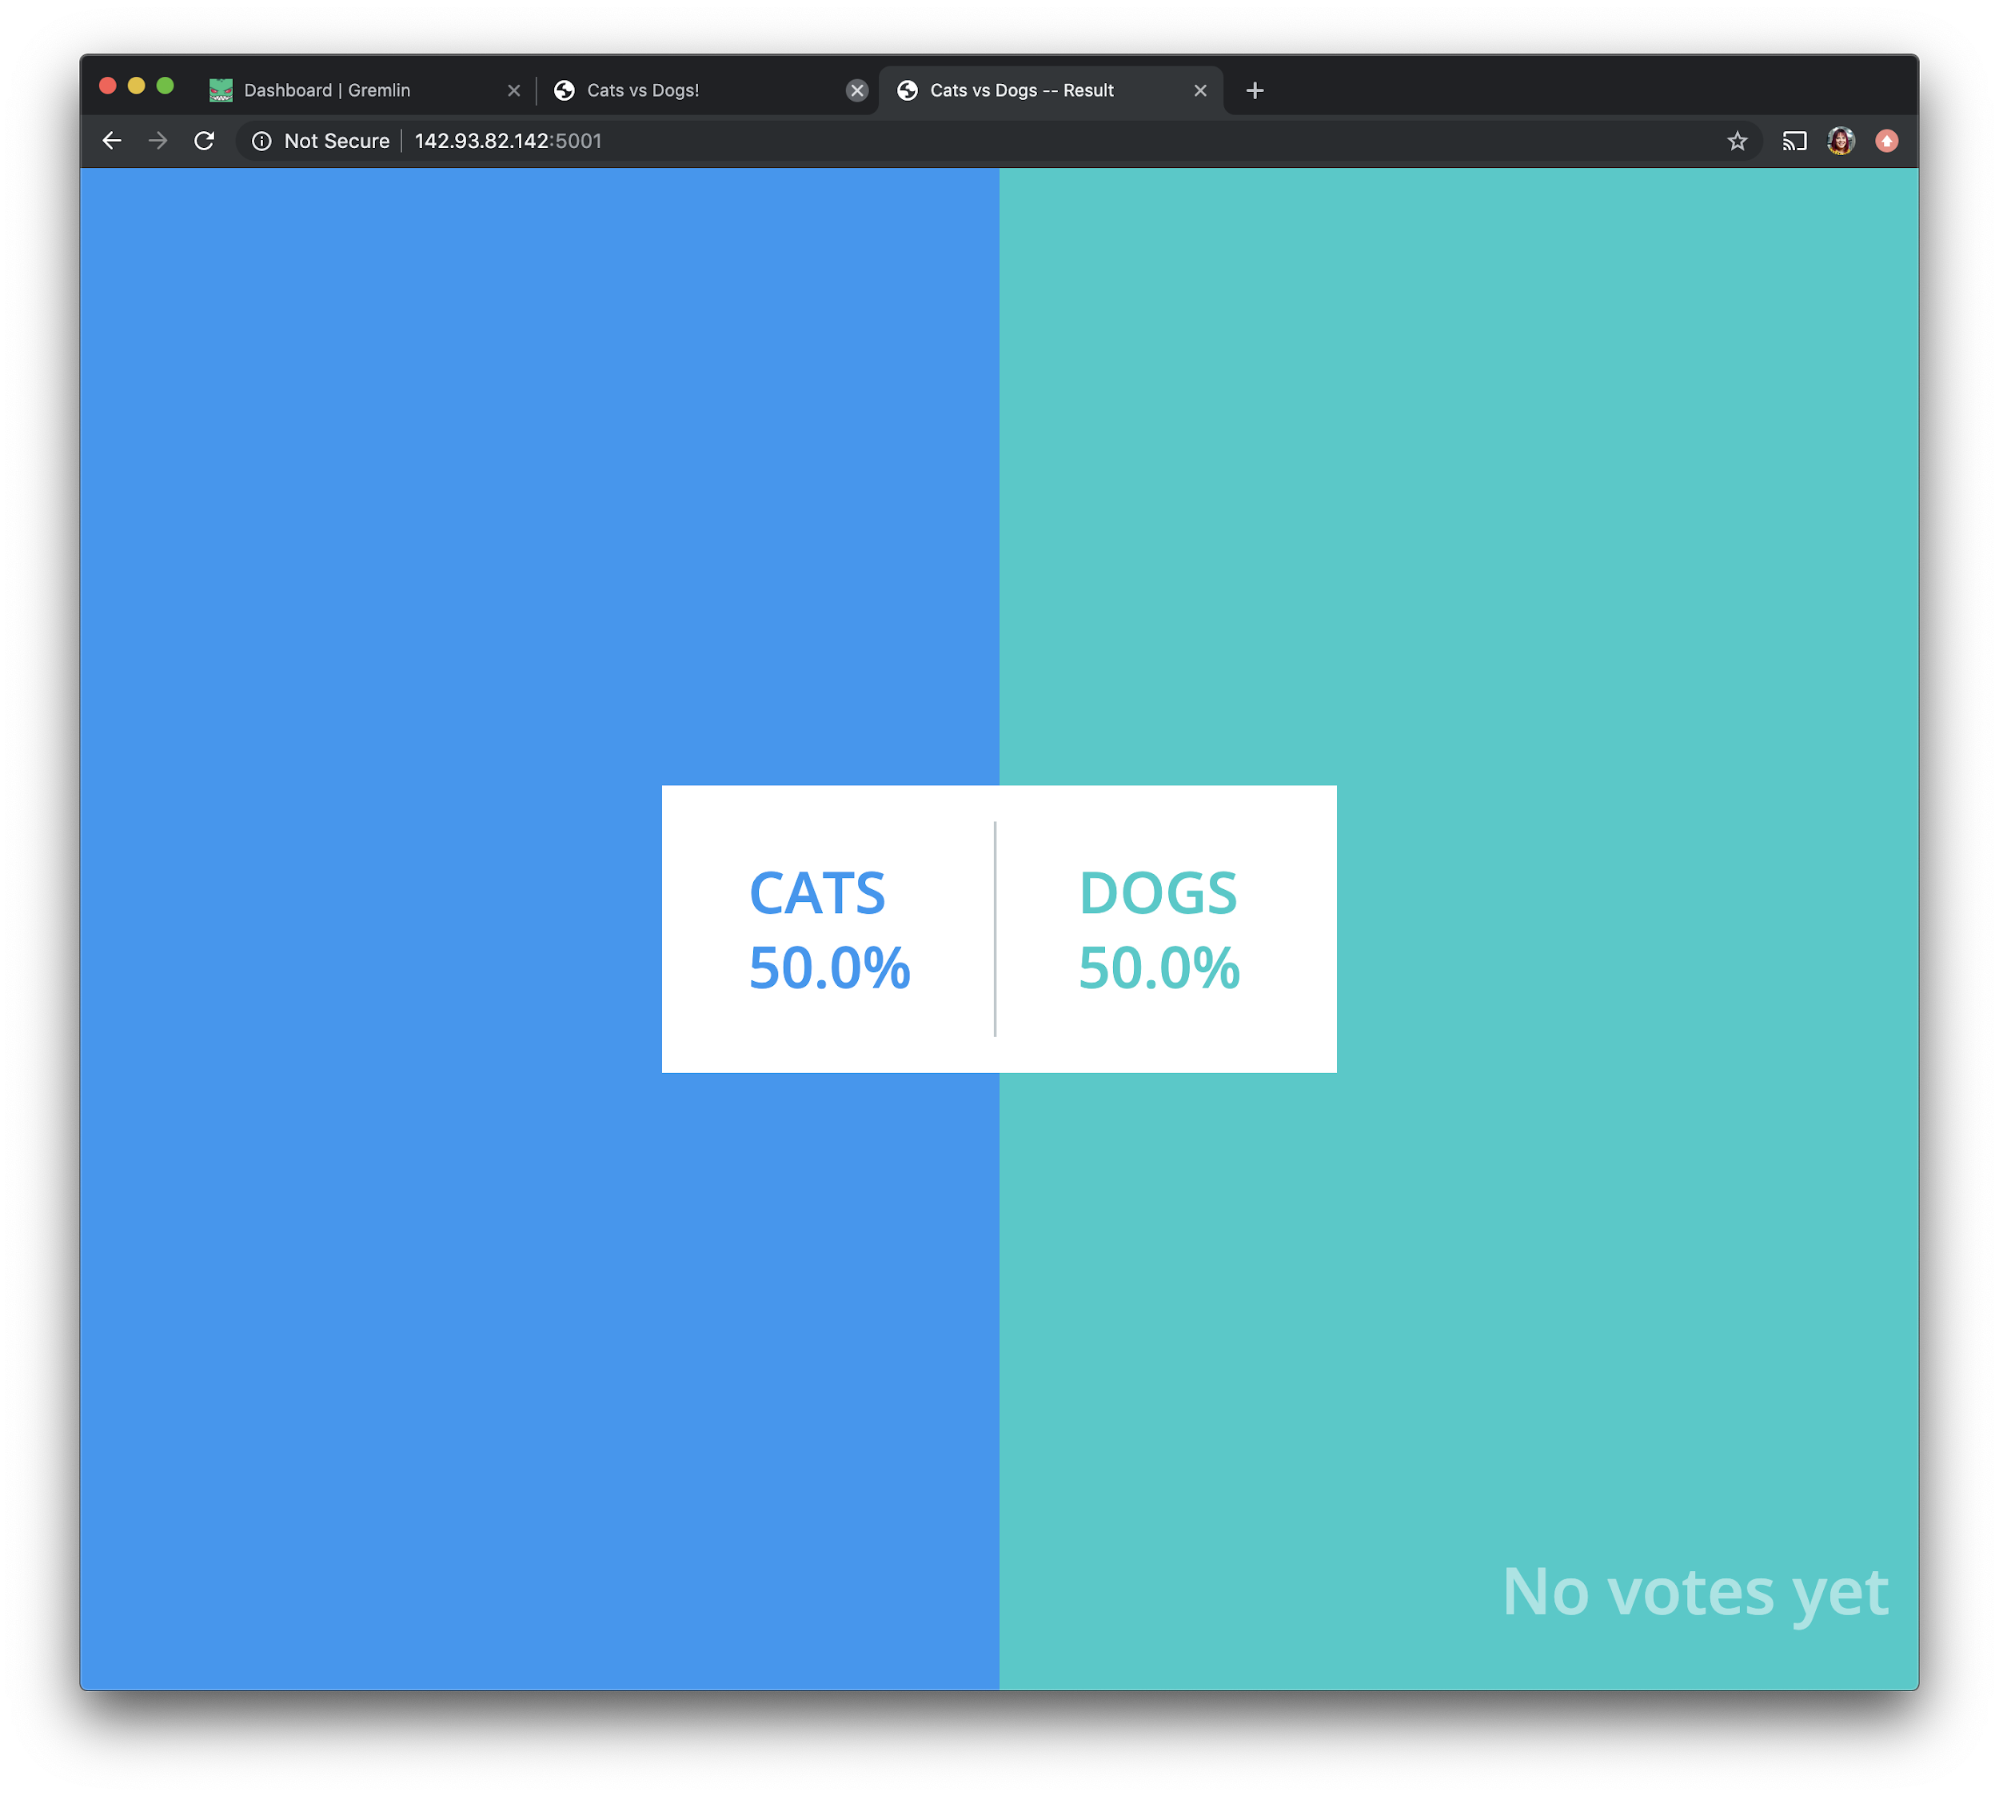
We'll access the results page via <span class="code-class-custom">http://142.93.82.142:5001 </span>. It should look like this:
Step 3: Setup Docker Swarm Visualizer
Next, we'll deploy an application called Docker Swarm Visualizer to visualize our Docker Swarm cluster.
On your swarm leader, deploy the visualizer by running this command:
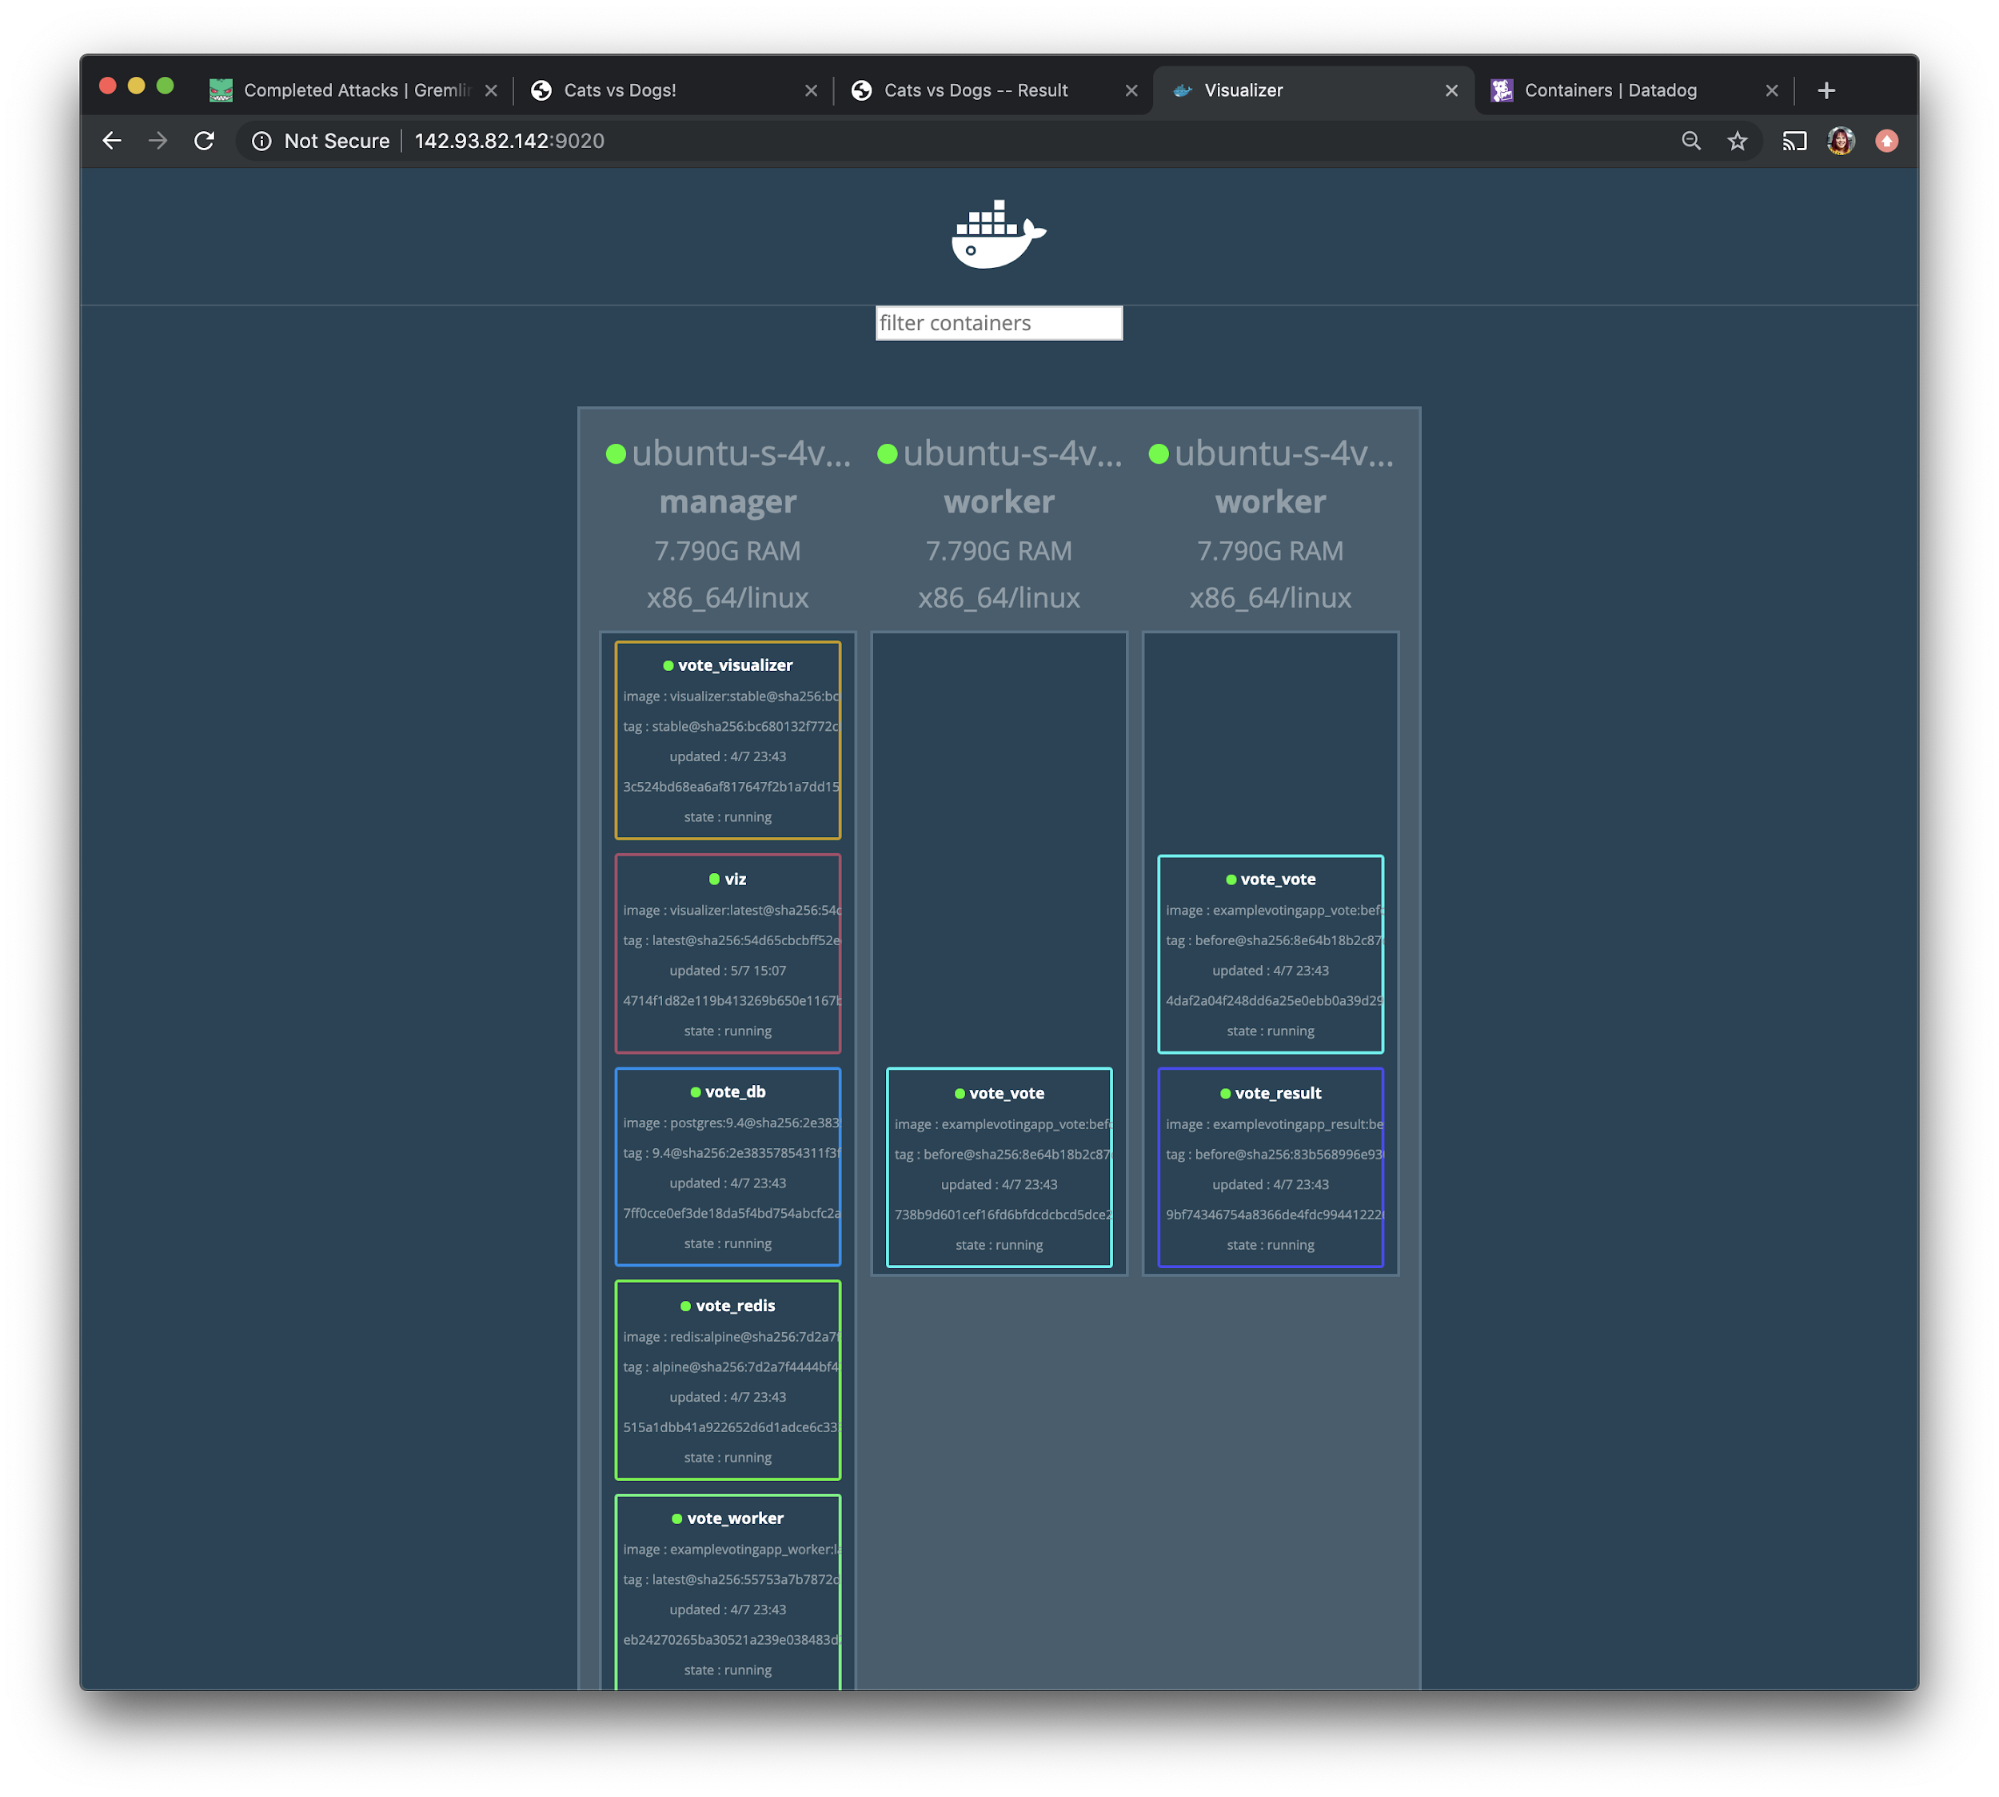
We will access this visualizer app via port 9020. If we open <span class="code-class-custom">http://142.93.82.142:9020</span> in a browser, we'll see the following screen:
Step 4: Install Datadog
Before we run any chaos experiments, we'll want to monitor our cluster. To do that, we'll set up Datadog (sign up here).
After creating an account, open “Integrations” on the left navigation bar and select “Agent”.
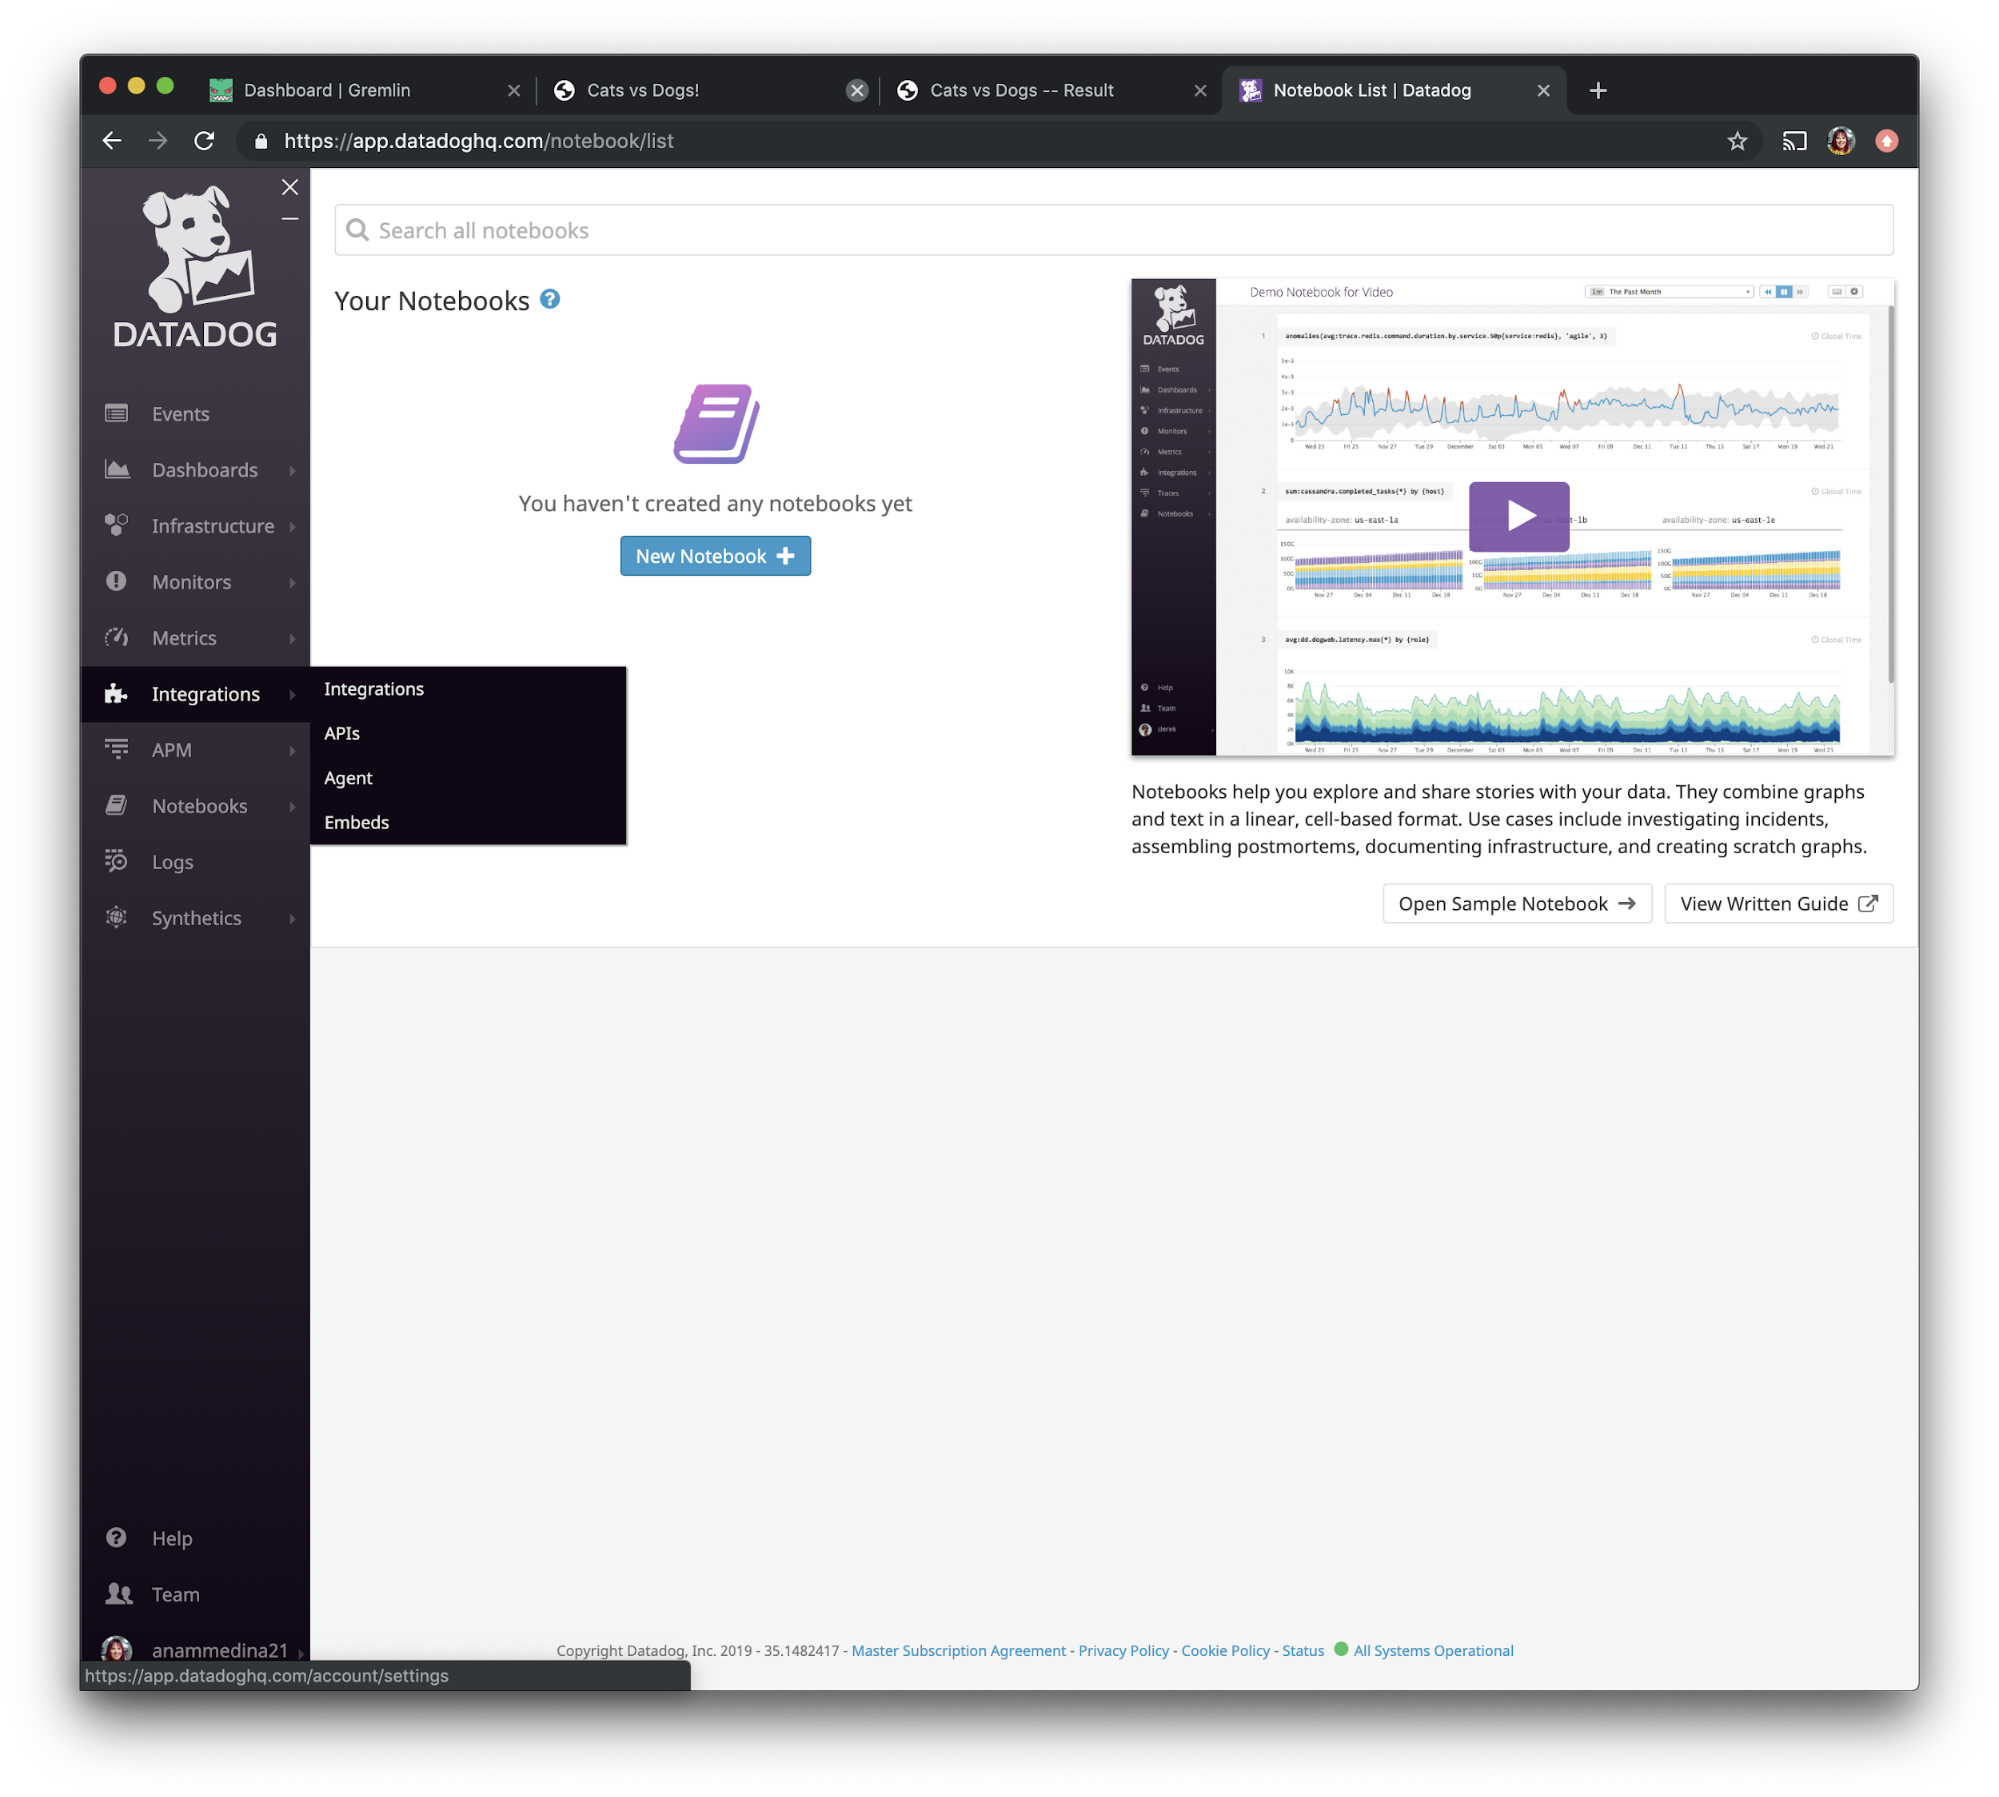
Select Docker from the options, then follow the instructions under “Use our easy one-step install.”
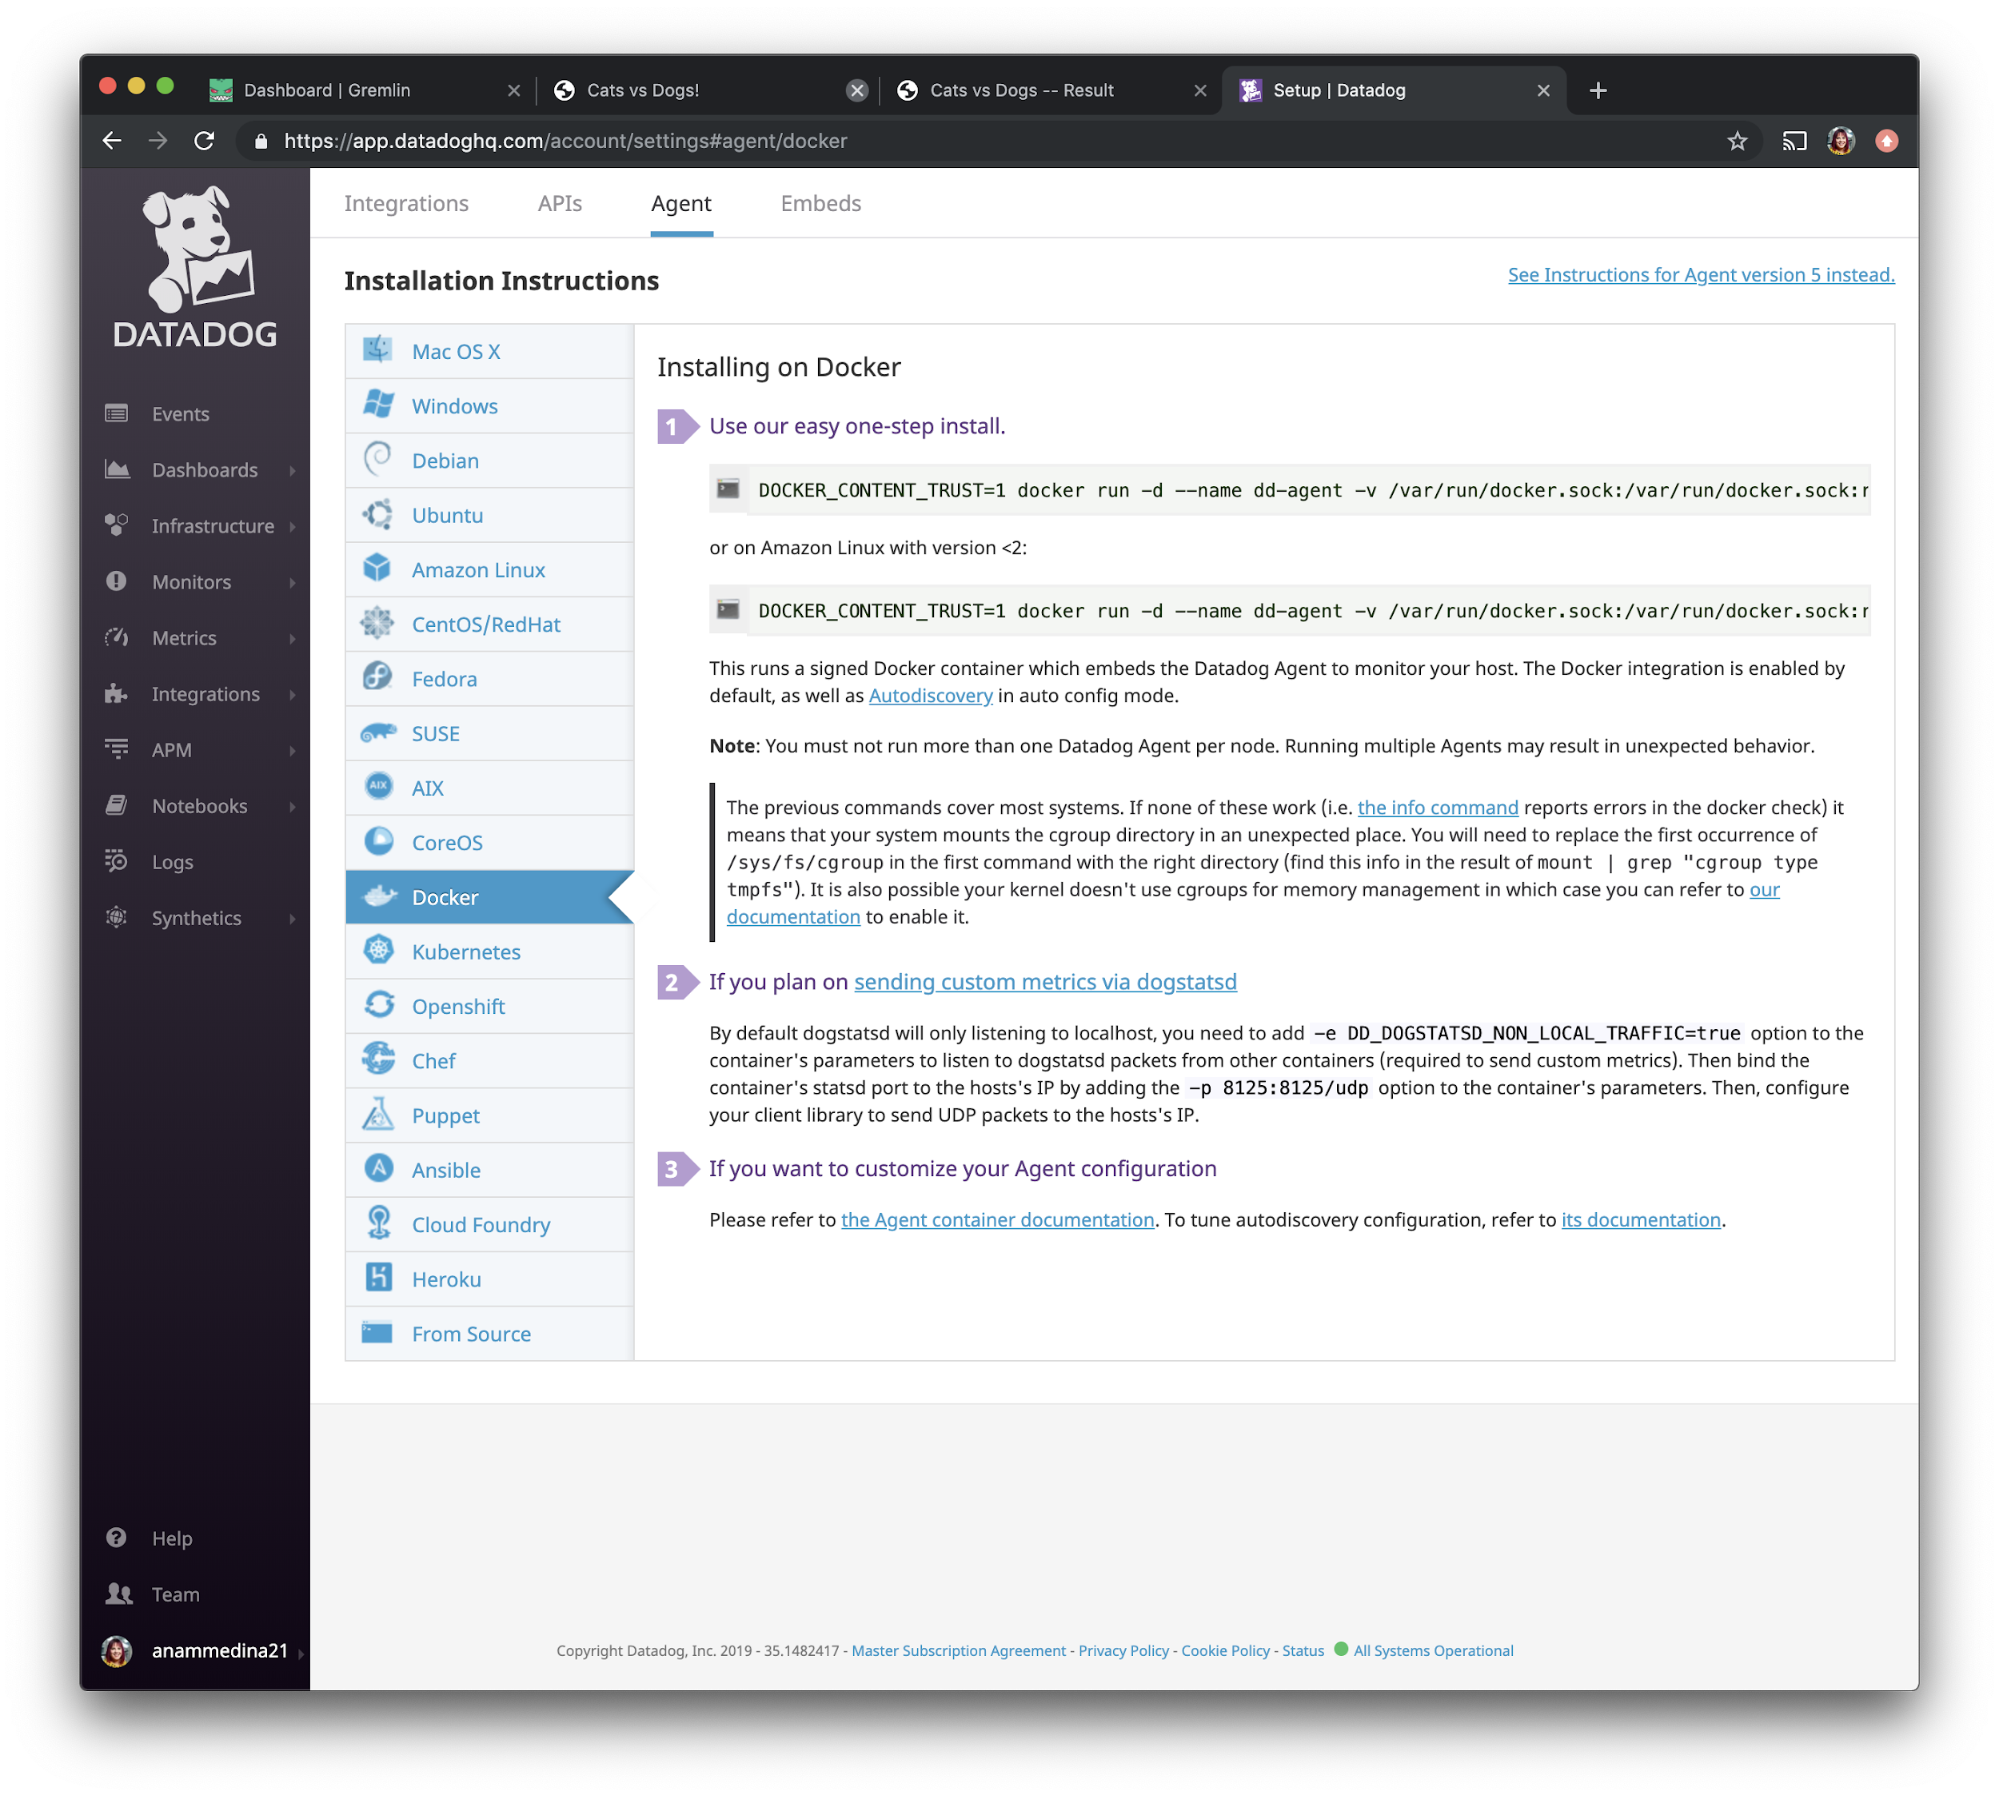
Install the Datadog agent on each host (make sure to replace <span class="code-class-custom">DD_API_KEY</span> with your own Datadog API key):
Step 5: Setup Datadog tags
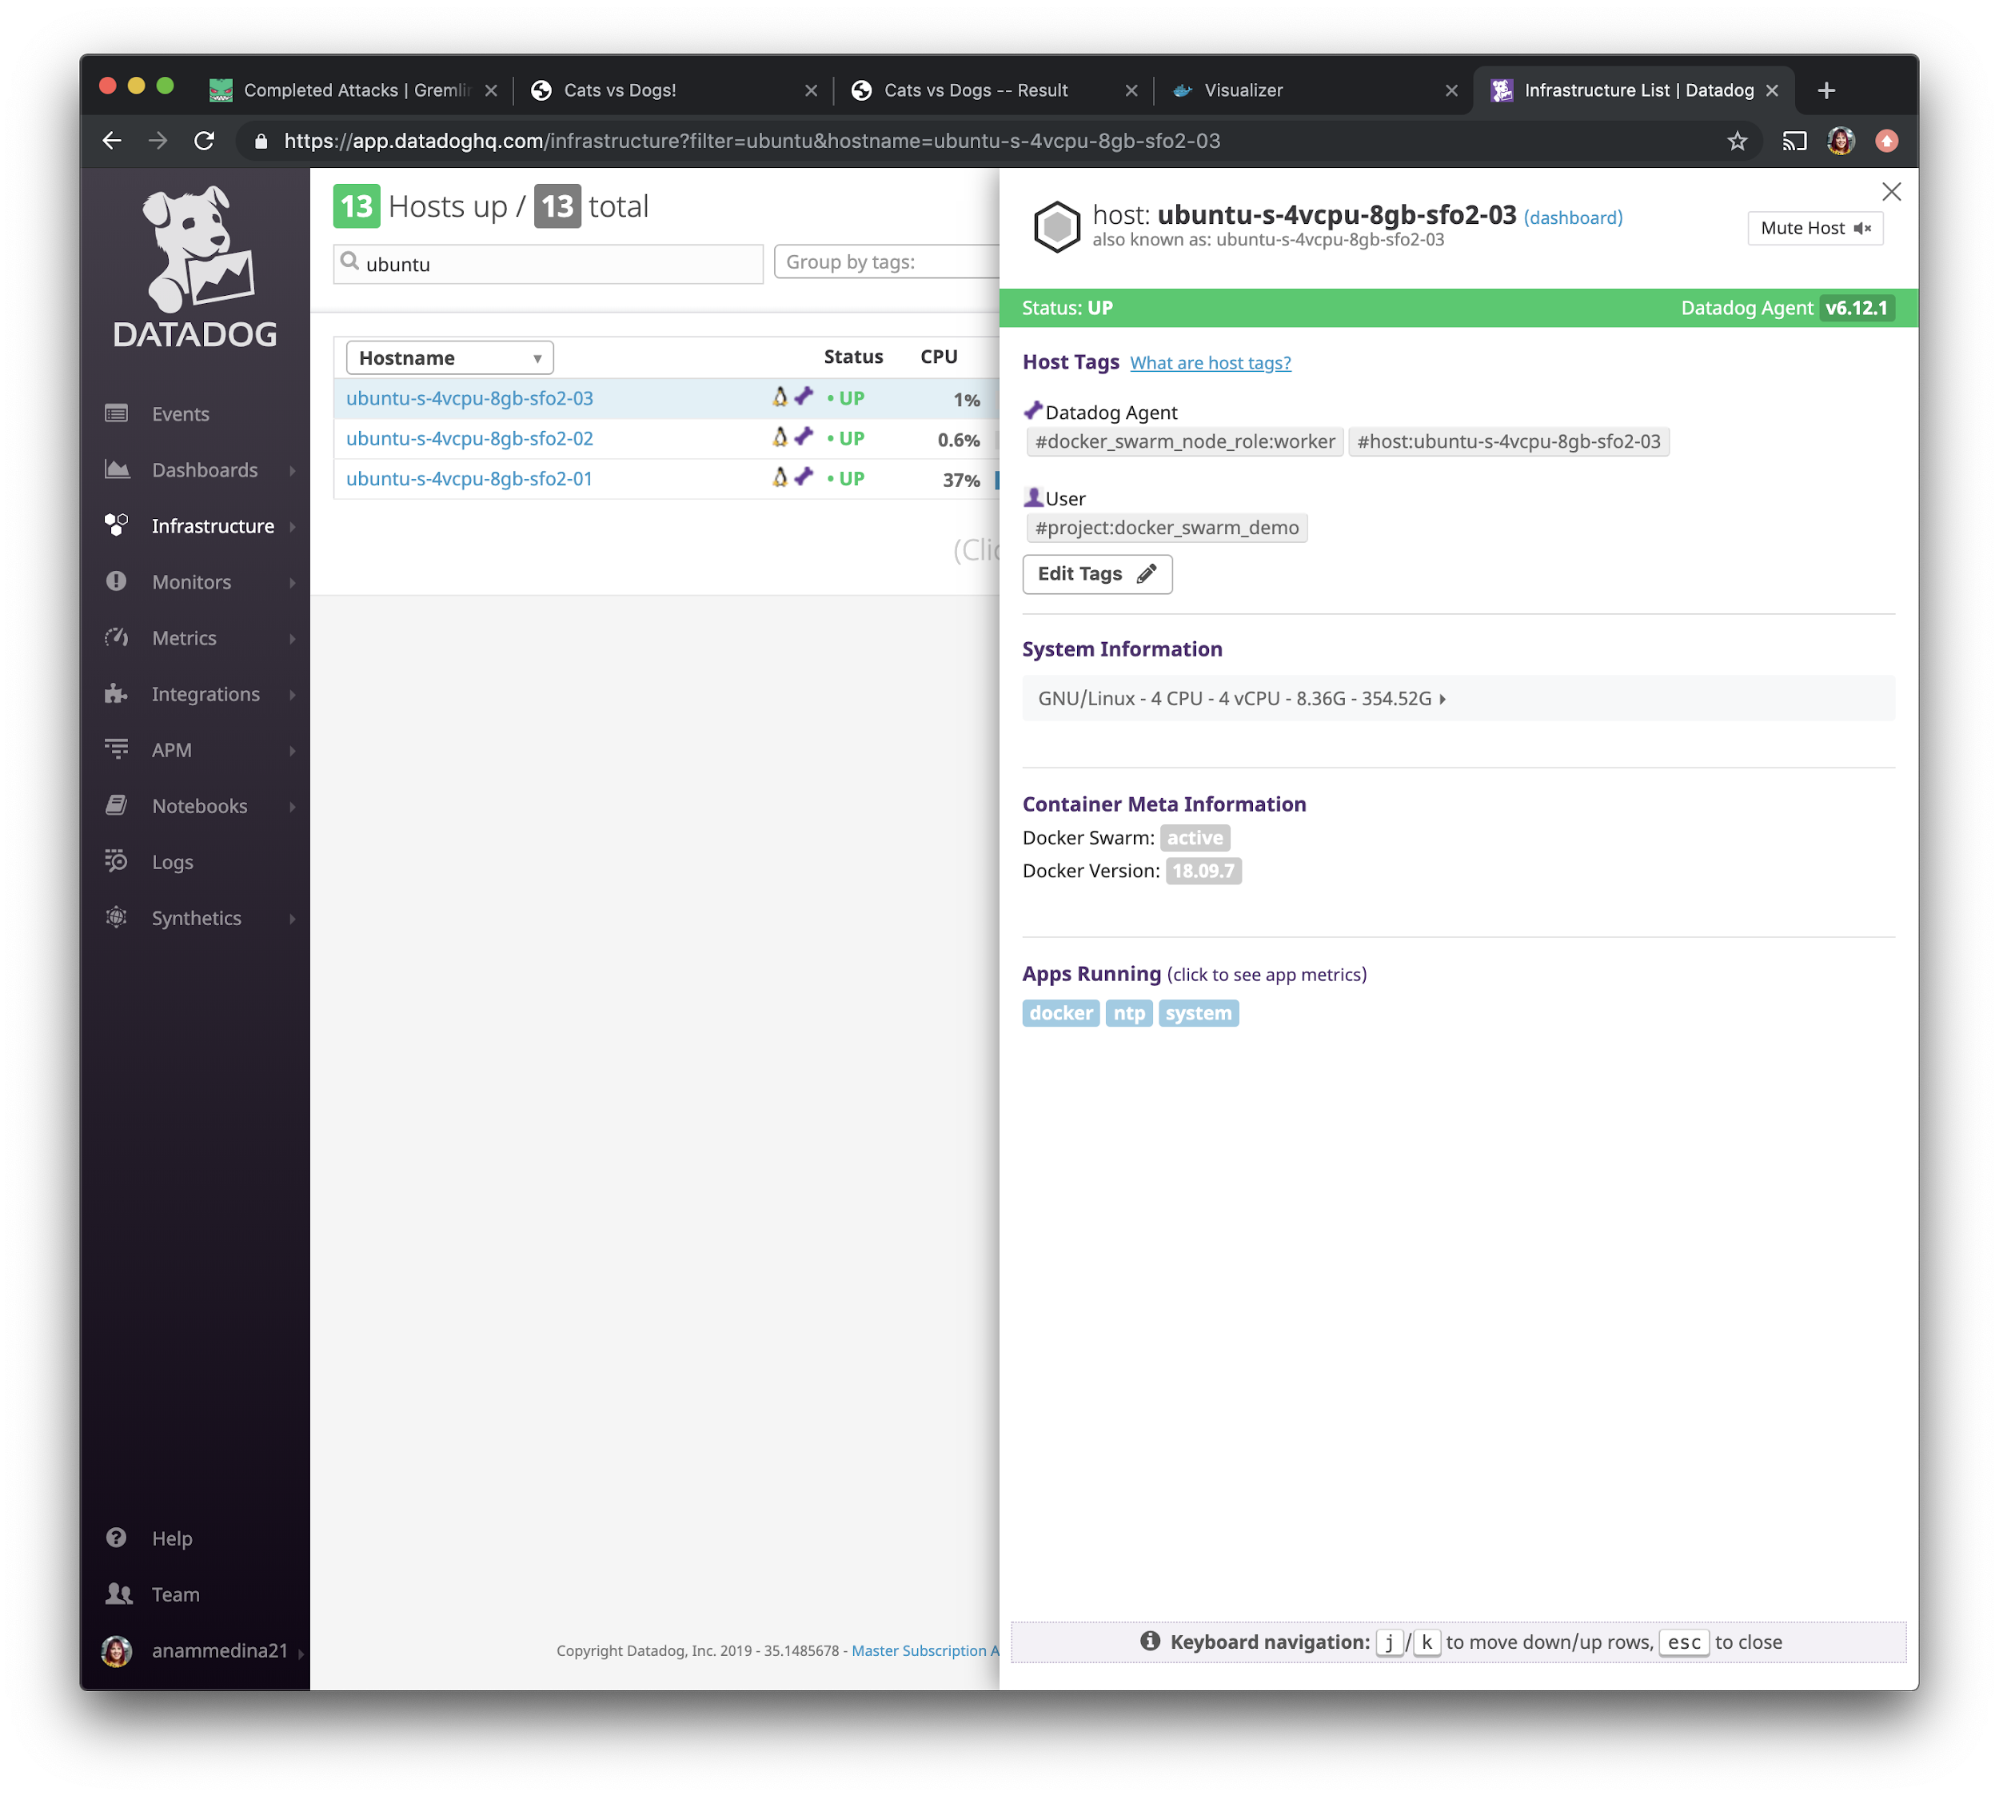
Next, we'll set up tags for each of our Docker hosts. This will make it easier to identify the hosts in Datadog. In the Datadog UI, use the left navigation bar to navigate to “Infrastructure” and select “Infrastructure List.”
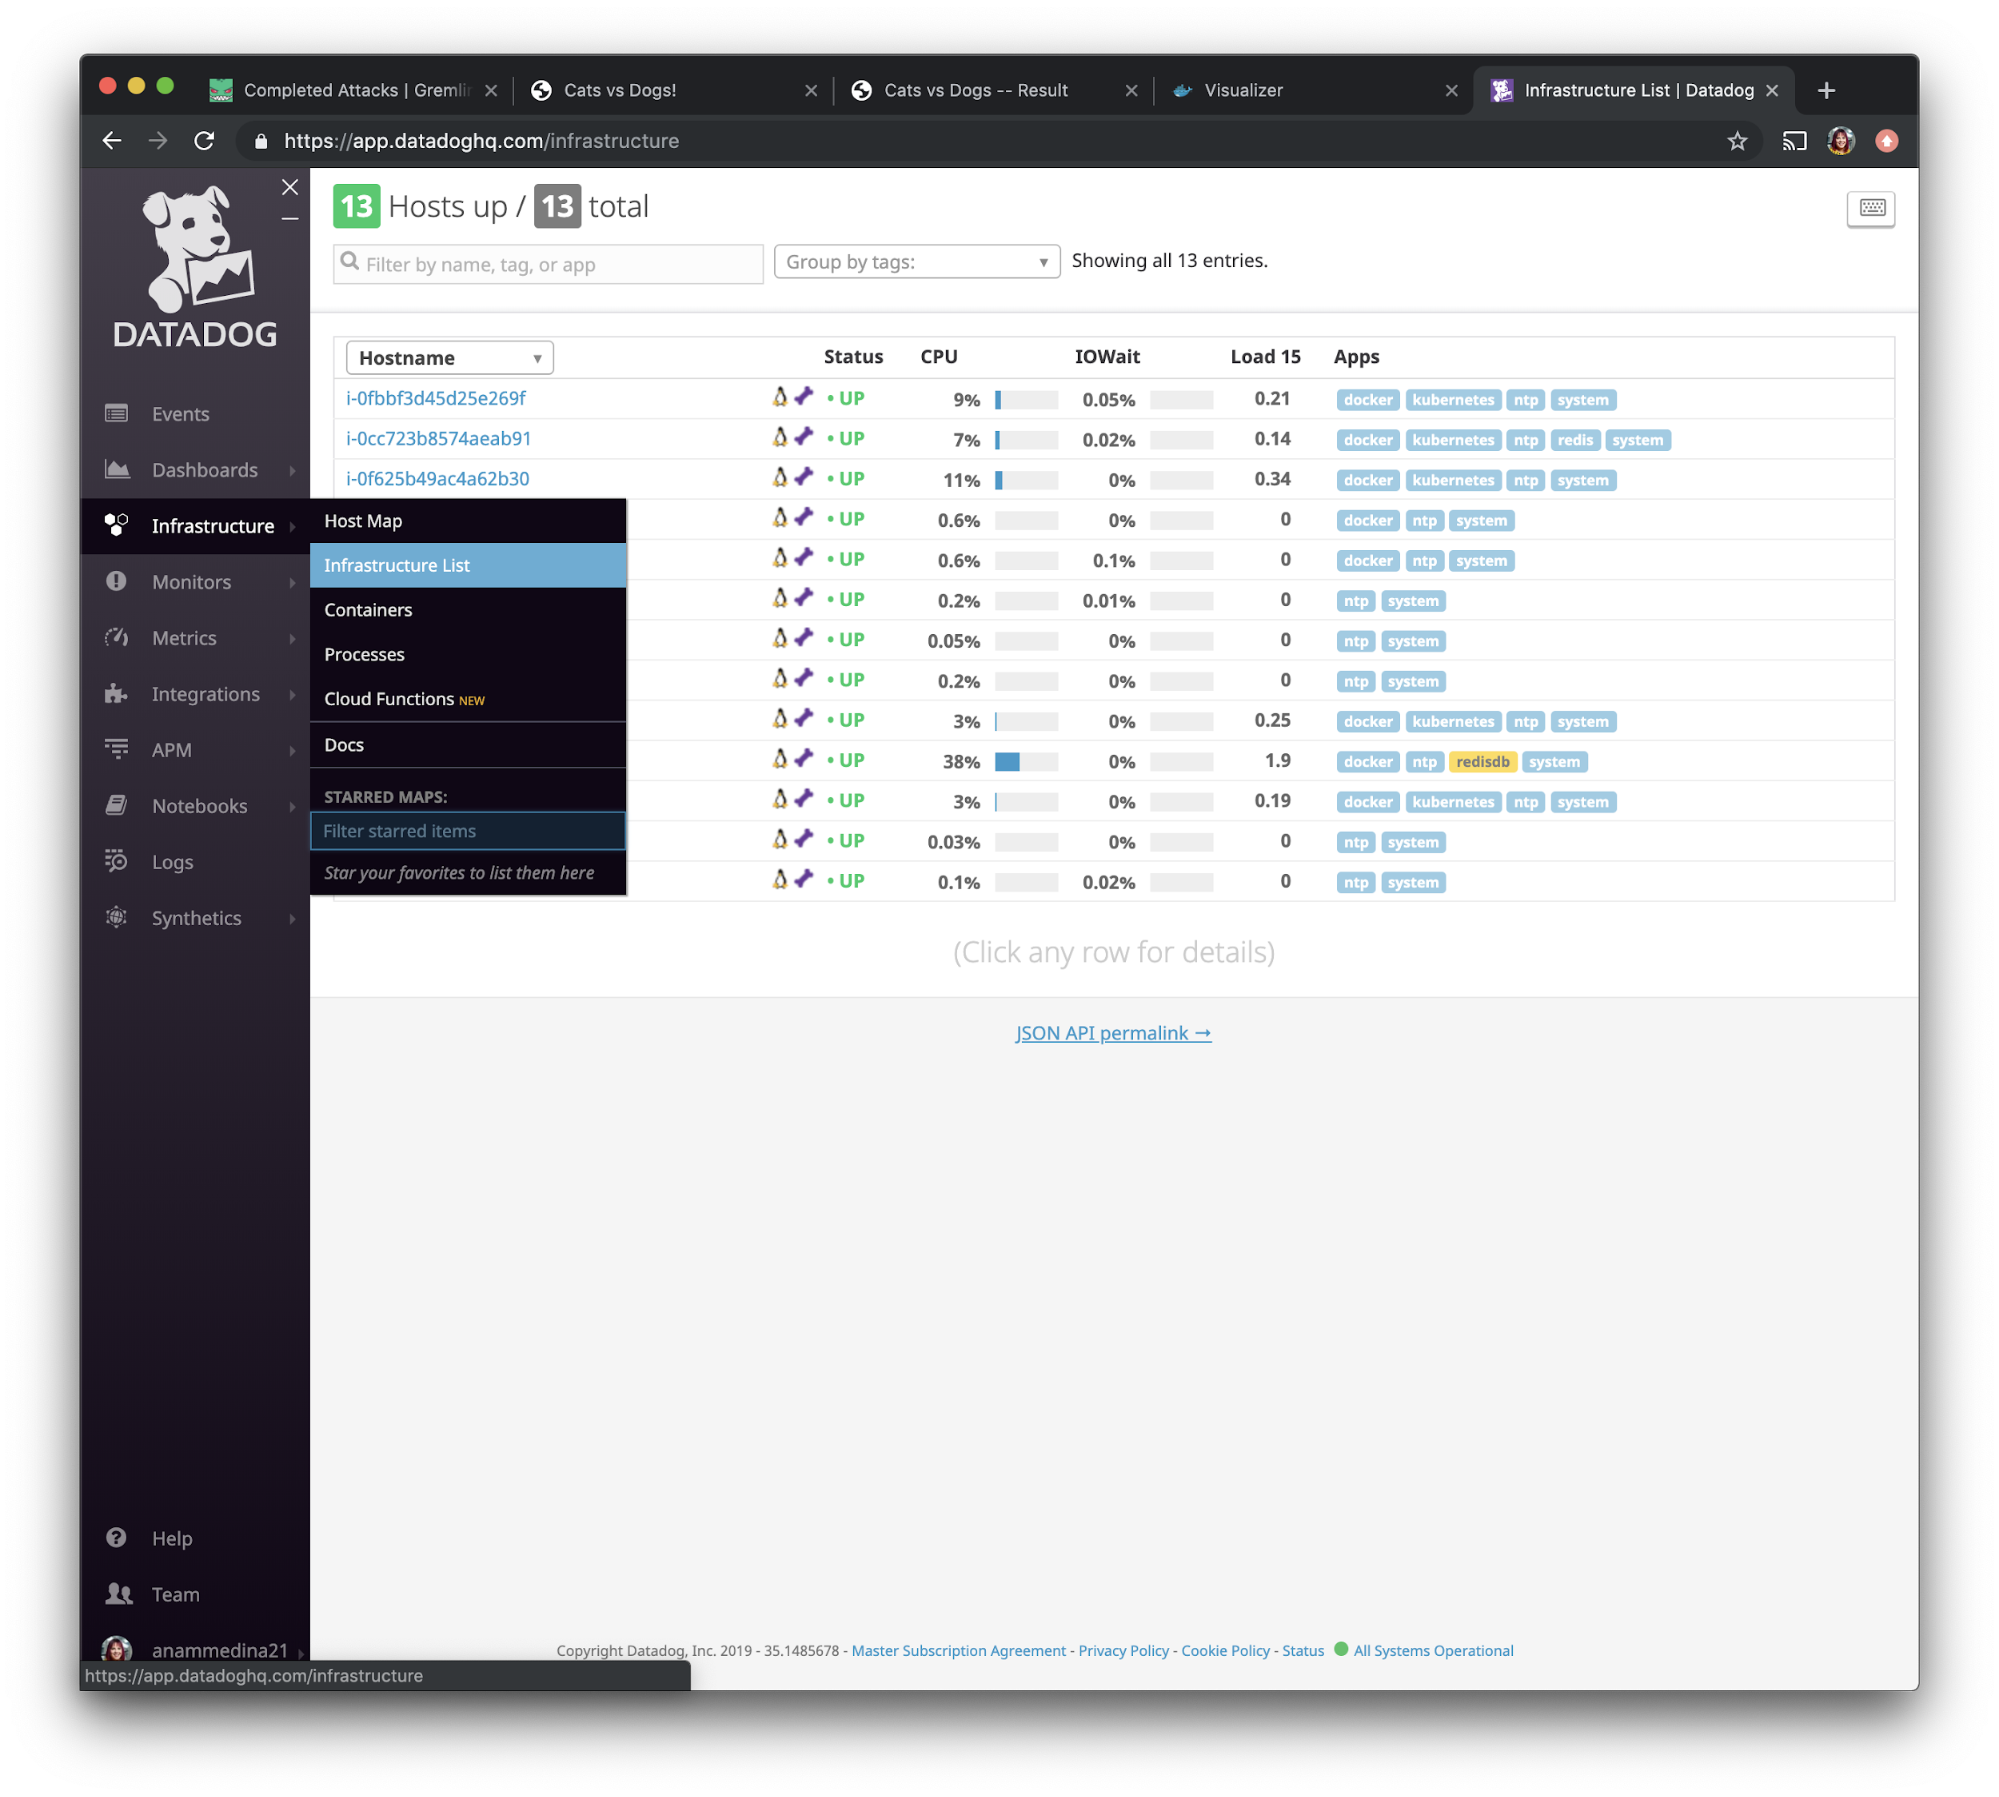
We want to select the hosts we’ve installed Datadog on and give them a special tag. We are going to use the search function to find them faster. We will be adding the tag <span class="code-class-custom">project:docker_swarm_demo</span>. This way, we can identify all three hosts using a single tag.
Step 6: Setup Datadog Monitors
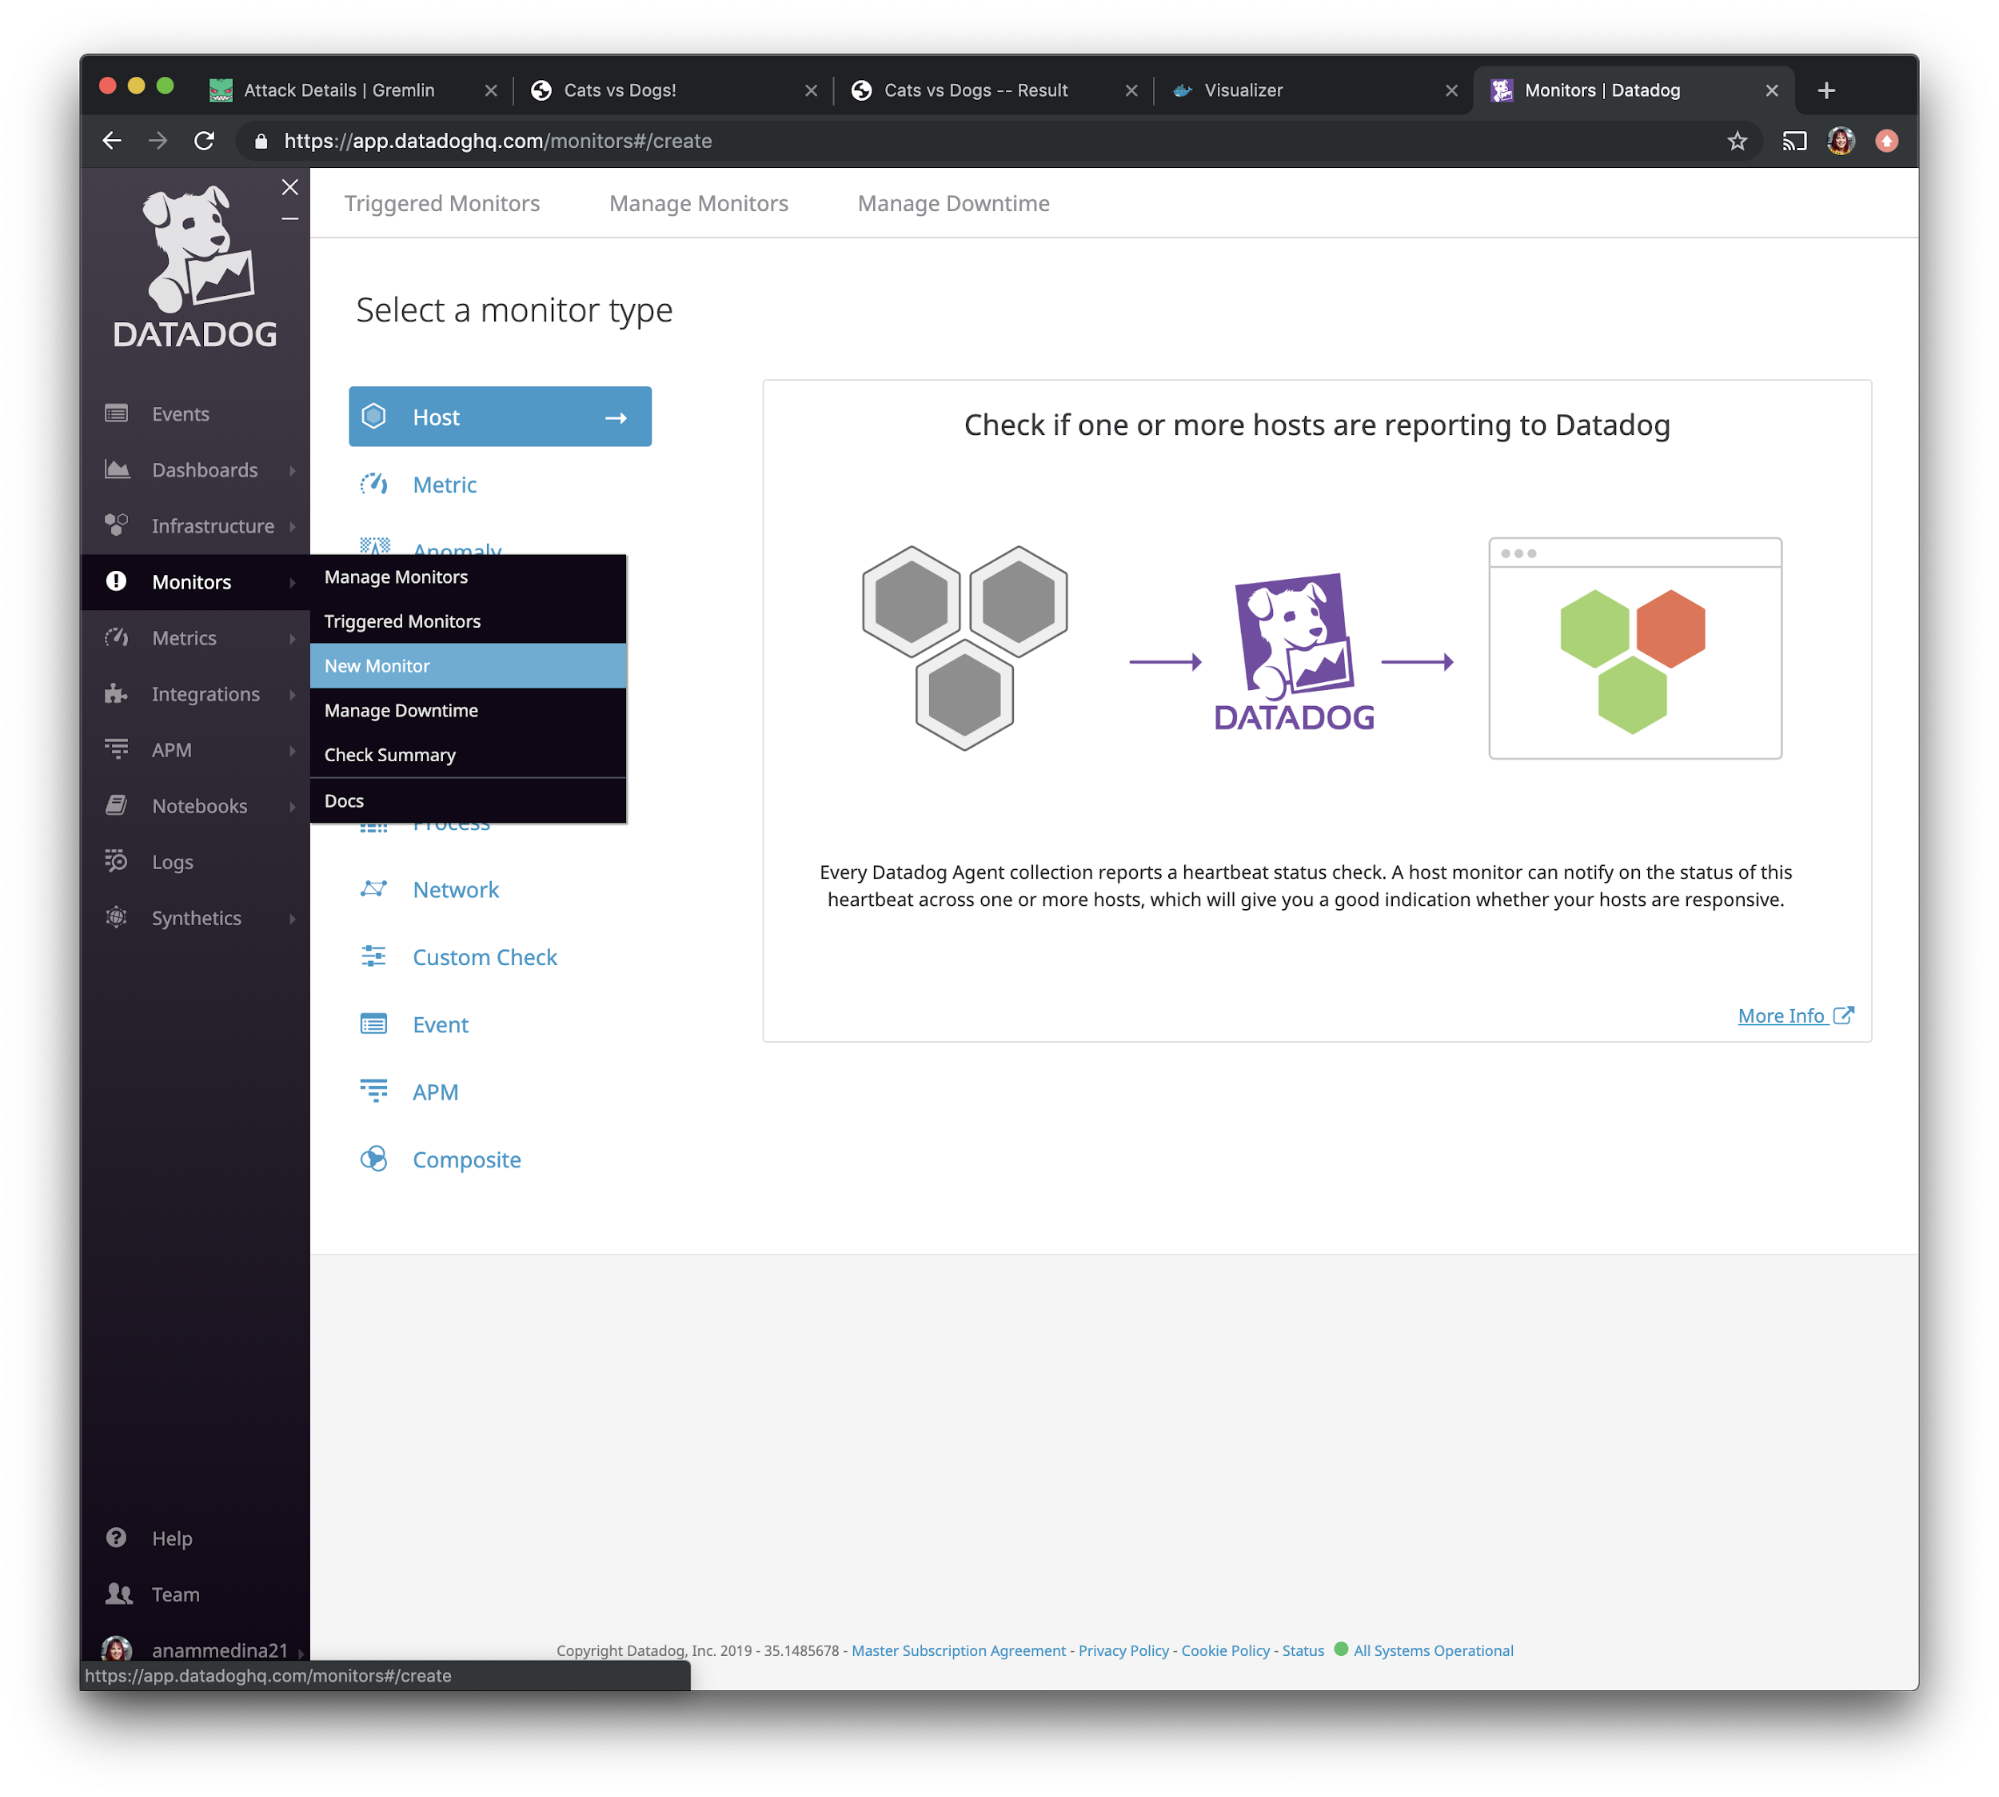
Now that we have Datadog installed on our hosts with tags, we want to create a monitor. Monitors let us track events in Datadog (like changes in host metrics or logs) and fire when certain conditions are met. We'll use these to generate alerts and send notifications.
In the left navigation bar, select “Monitors” and choose “New Monitor”.
One of our attacks is testing CPU consumption, so we want to monitor CPU usage. Specifically, we want to make sure our monitor captures the combination of user and system CPU usage. Select “metric” from the given options, then add the <span class="code-class-custom">system.cpu.user</span> and <span class="code-class-custom">system.cpu.system</span> metrics together as shown in this screenshot.

We are going to make the warning threshold <span class="code-class-custom">65</span> and the alert threshold <span class="code-class-custom">90</span>. This means that when the average CPU usage exceeds 65% during the last minute, the monitor will fire and we’ll get a warning notification.
Under “Say what’s happening”, we’ll customize the notification. I've made the subject of the email to be “Chaos! The CPU is really high on {{host.name}} {{host.ip}}.” Then, on the body of the notification, I've added some extra wording and entered my own email address so that the notification goes directly to me and provides some details on what happened.
Step 7: Install Gremlin
Now that we have monitoring and alerting configured, let's install Gremlin and start running chaos experiments on our swarm. First, SSH into your swarm leader:
Next, follow the instructions in our documentation to install Gremlin onto a virtual machine. Since we're running Ubuntu 18.04, follow the instructions for installing a Deb package. You can check if Gremlin authenticated successfully by clicking “Agents” in the navigation bar and making sure your host is marked as “Online”.
Step 8: Experiment #1: Test recoverability using a shutdown attack on the visualizer container
Now let's run our first chaos experiment! For this experiment, we want to validate that Docker Swarm can automatically recover container failures. Our hypothesis is: when we shutdown our visualizer application, Docker Swarm automatically restarts the container, and our monitoring tool, Datadog, shows this change.”
Let's go back to the Gremlin web app. Select “Attacks” from the navigation bar, then press the green “New Attack” button. Select “Containers,” then select the visualizer container. Gremlin auto-populates Docker tags such as the namespace and container name, so we can search for those using the search box as shown below.
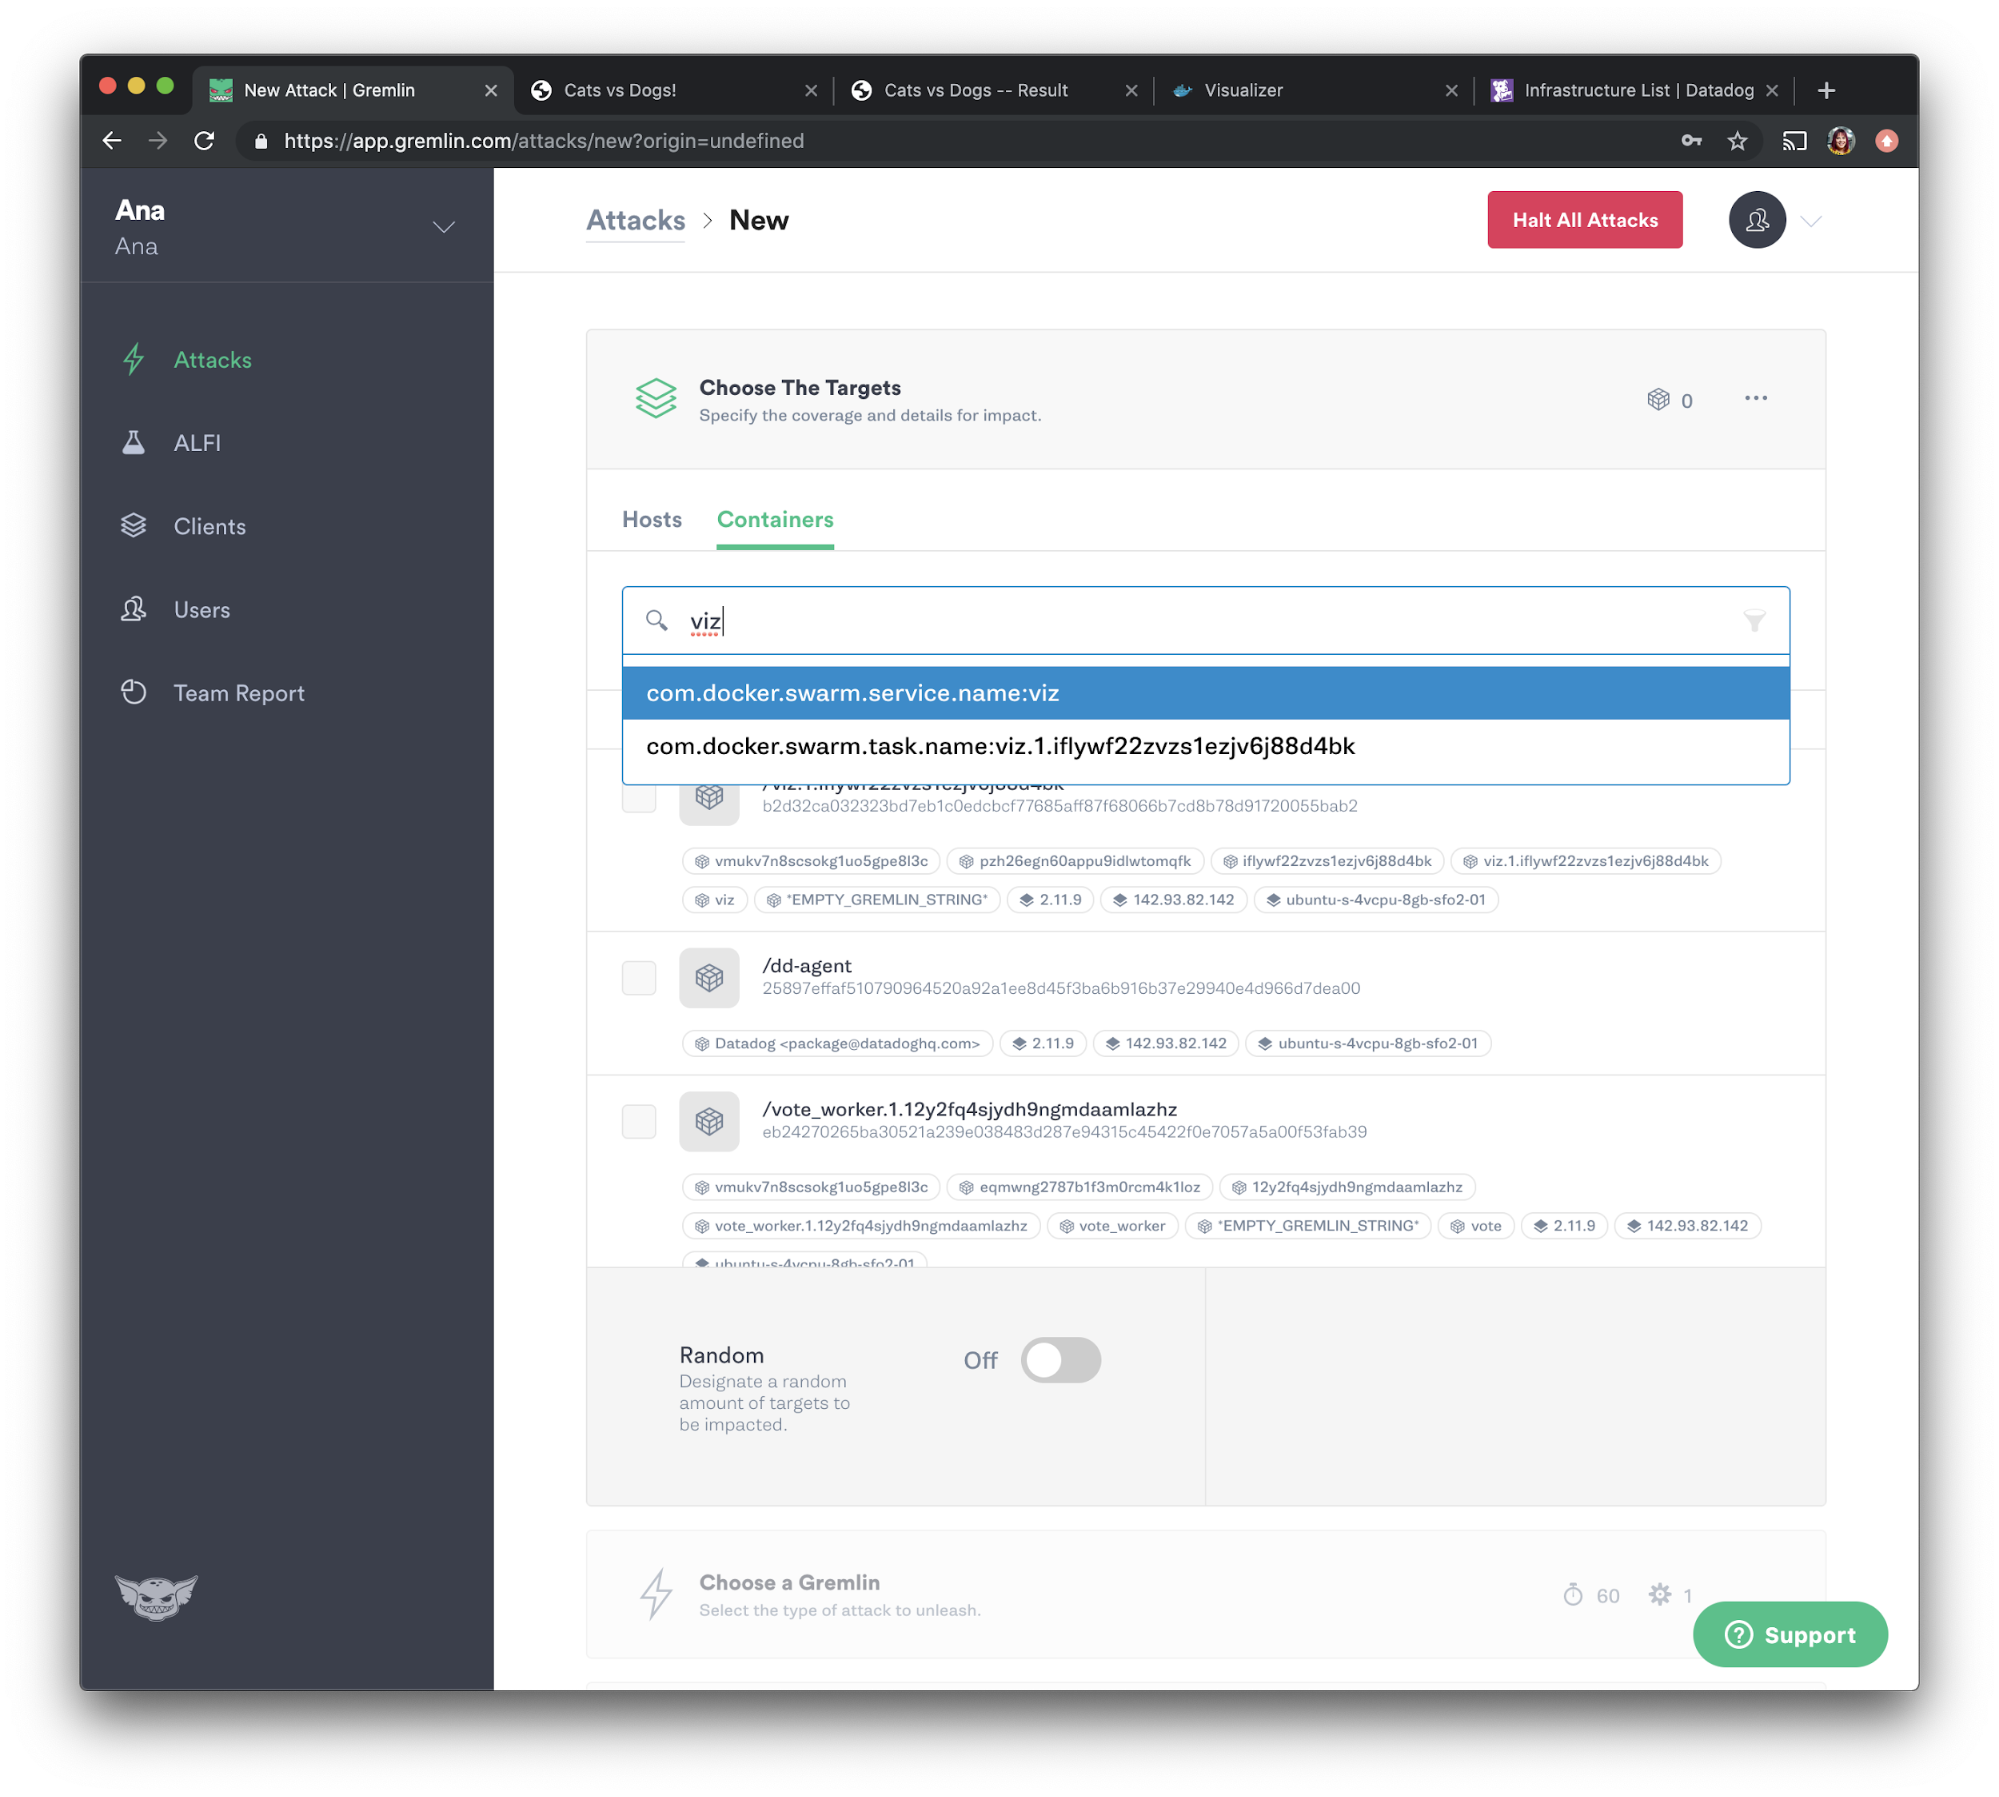
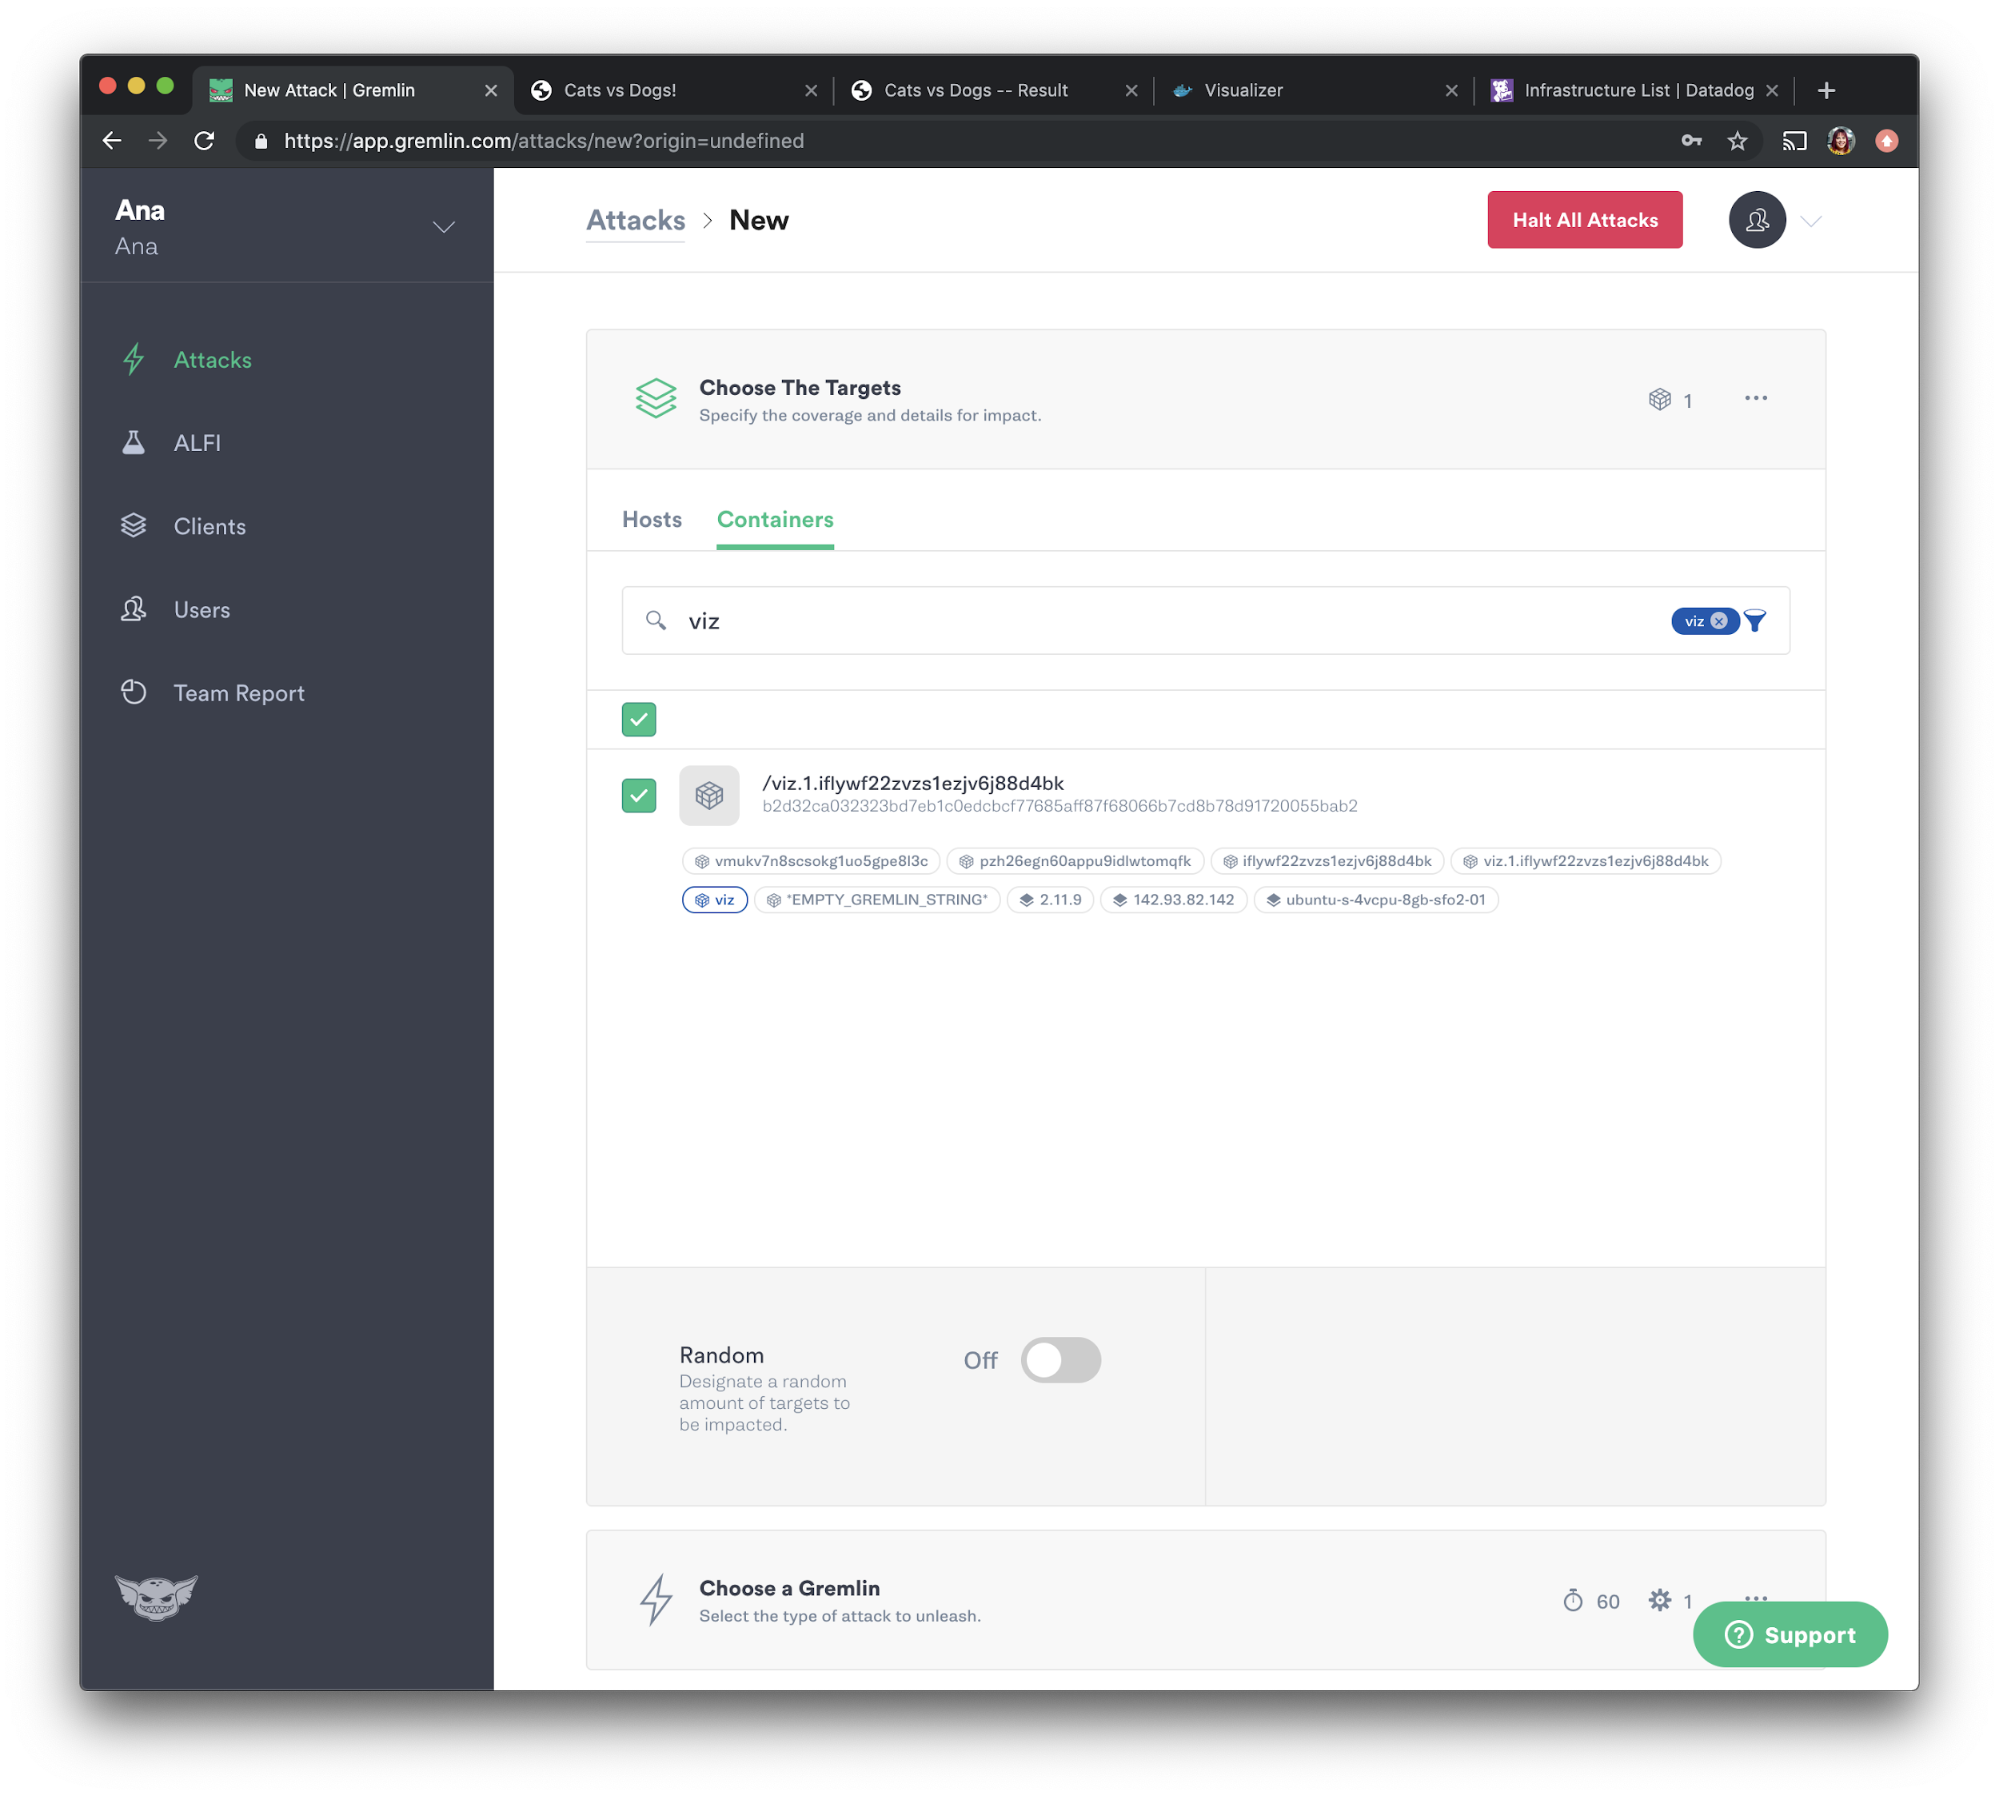
Our visualizer container is named "viz", so let's check the checkbox next to it:
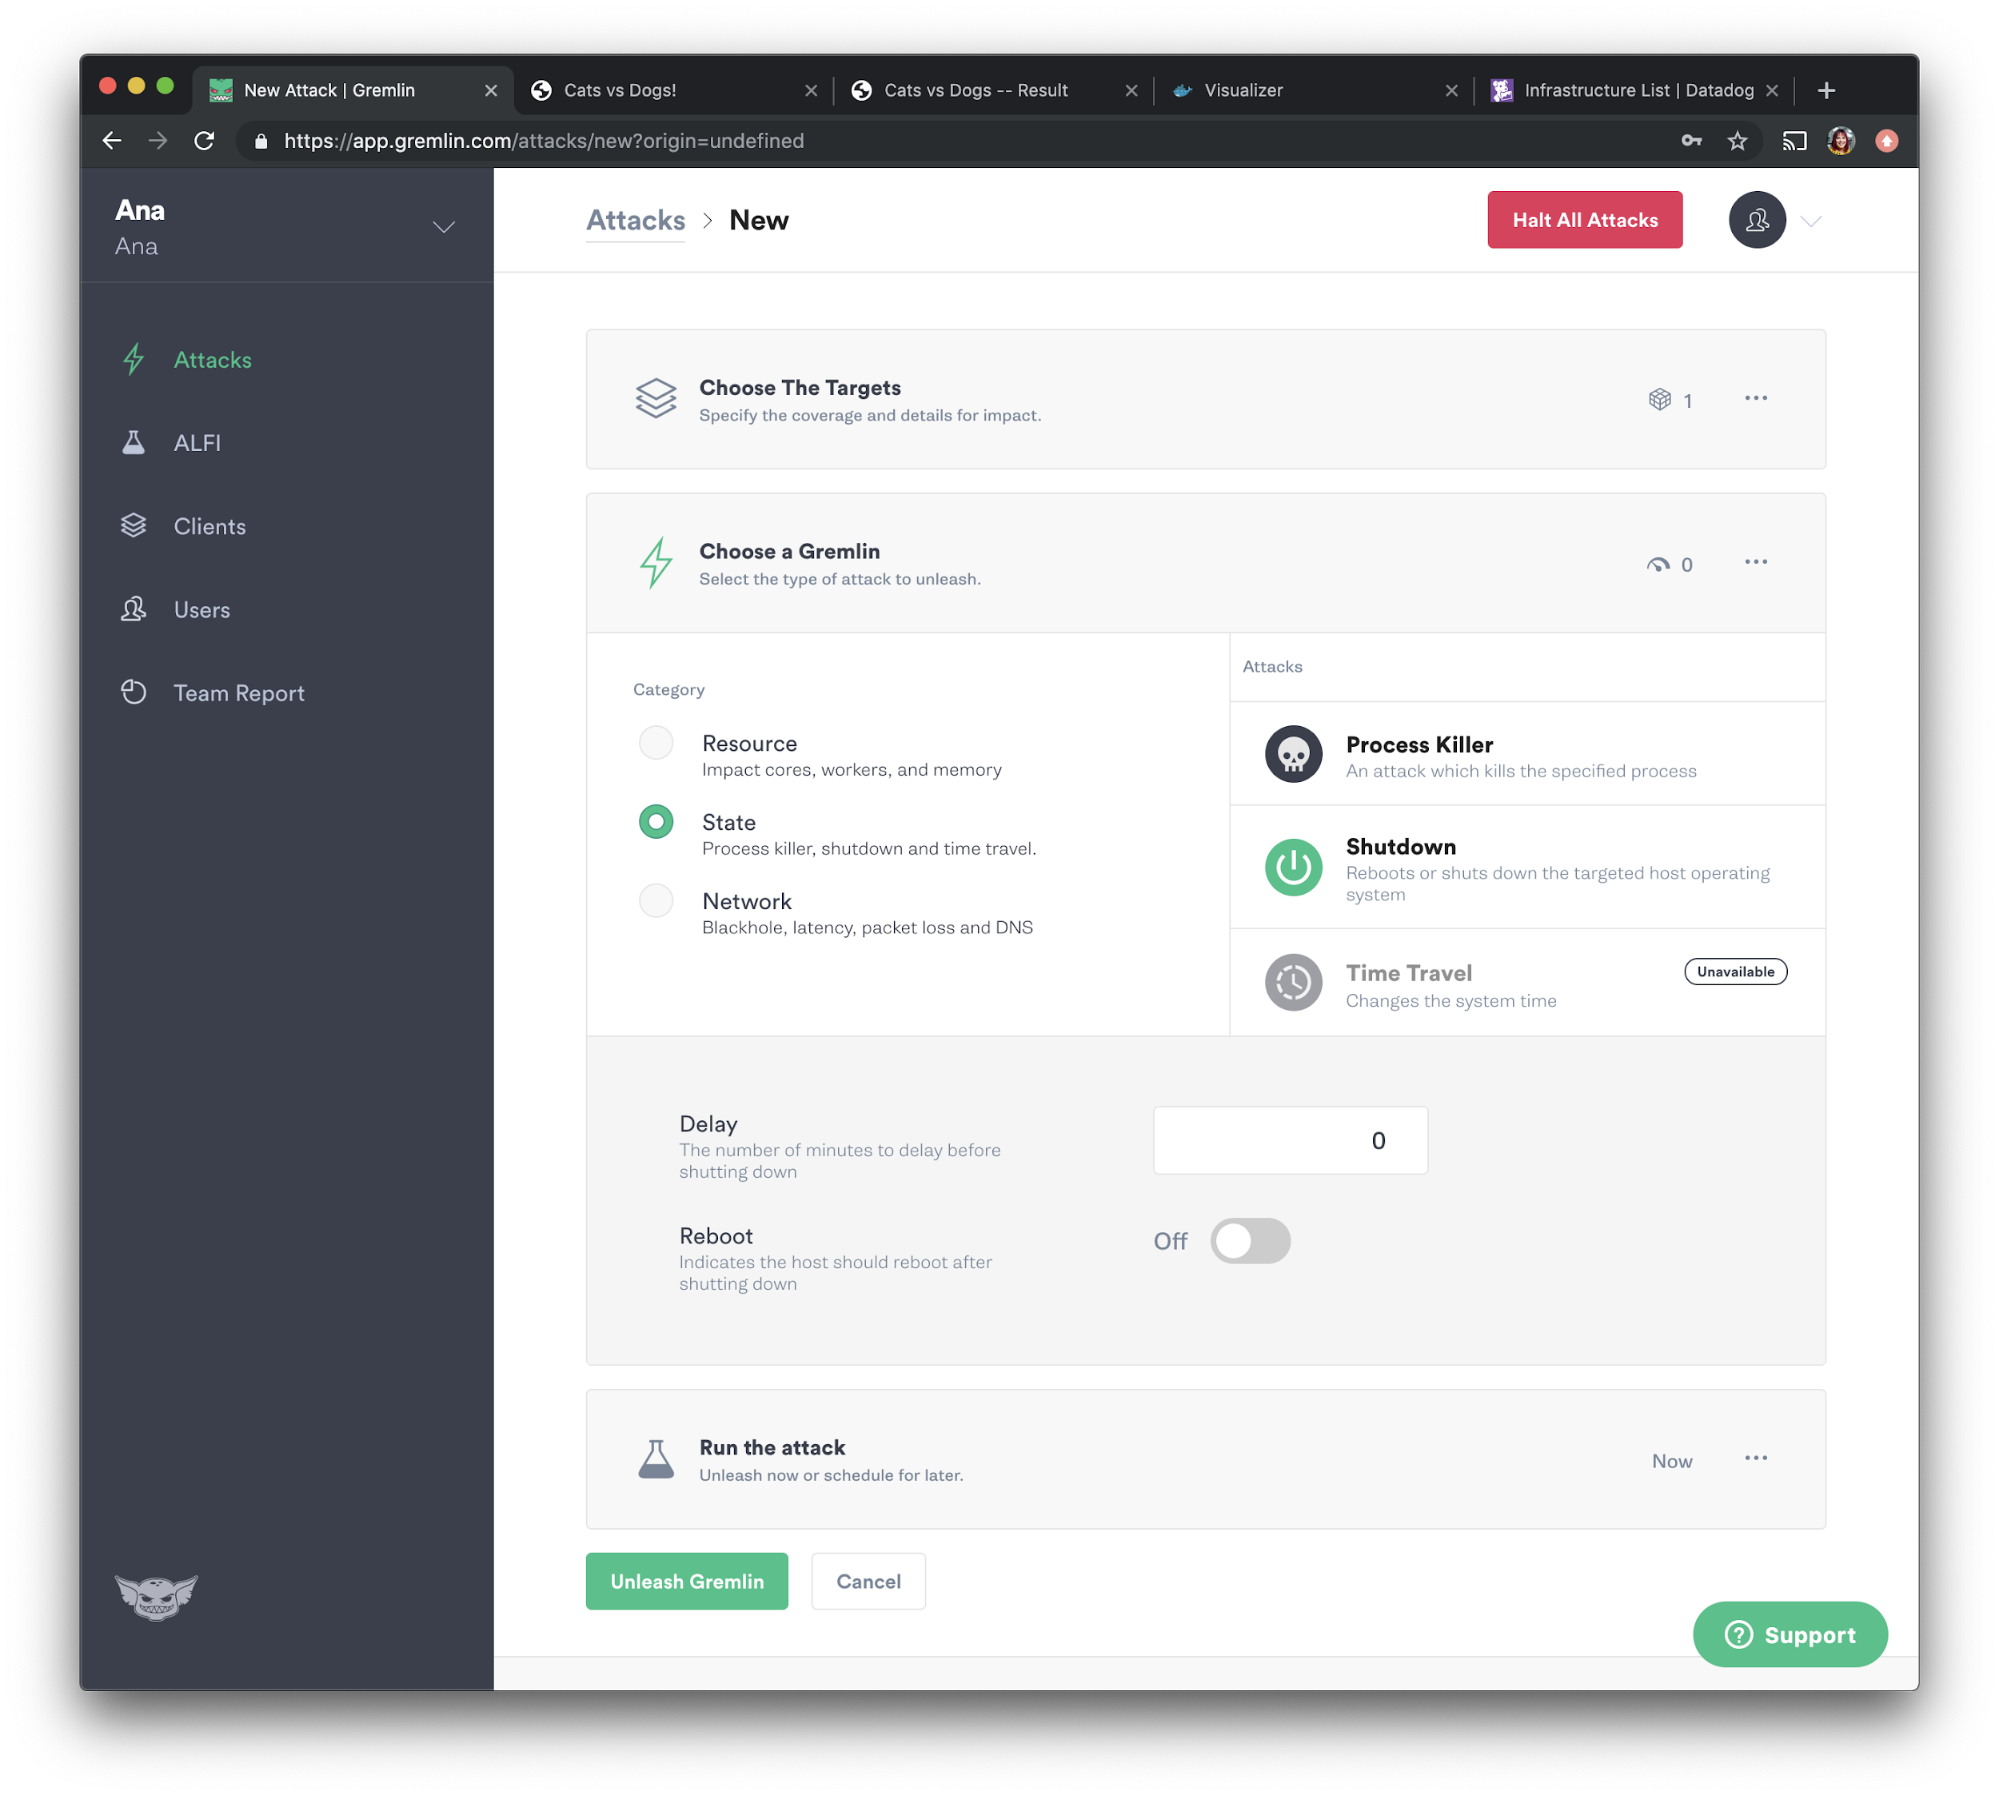
We will now choose the attack we want to run, which in this case, is a shutdown attack. Select “State” and choose “Shutdown” from the options. We will set the delay to <span class="code-class-custom">0</span> so the attack runs immediately, then uncheck “Reboot”to prevent the container from automatically restarting. Now let's press the green “Unleash Gremlin” button to run the attack.
Experiment #1 Results
Our hypothesis was, “when we shutdown our visualizer container, Docker automatically restarts it, and our monitoring tool, Datadog, shows this change.” If we configured everything properly, Datadog will show that the container has shut down and Docker has brought it back up.
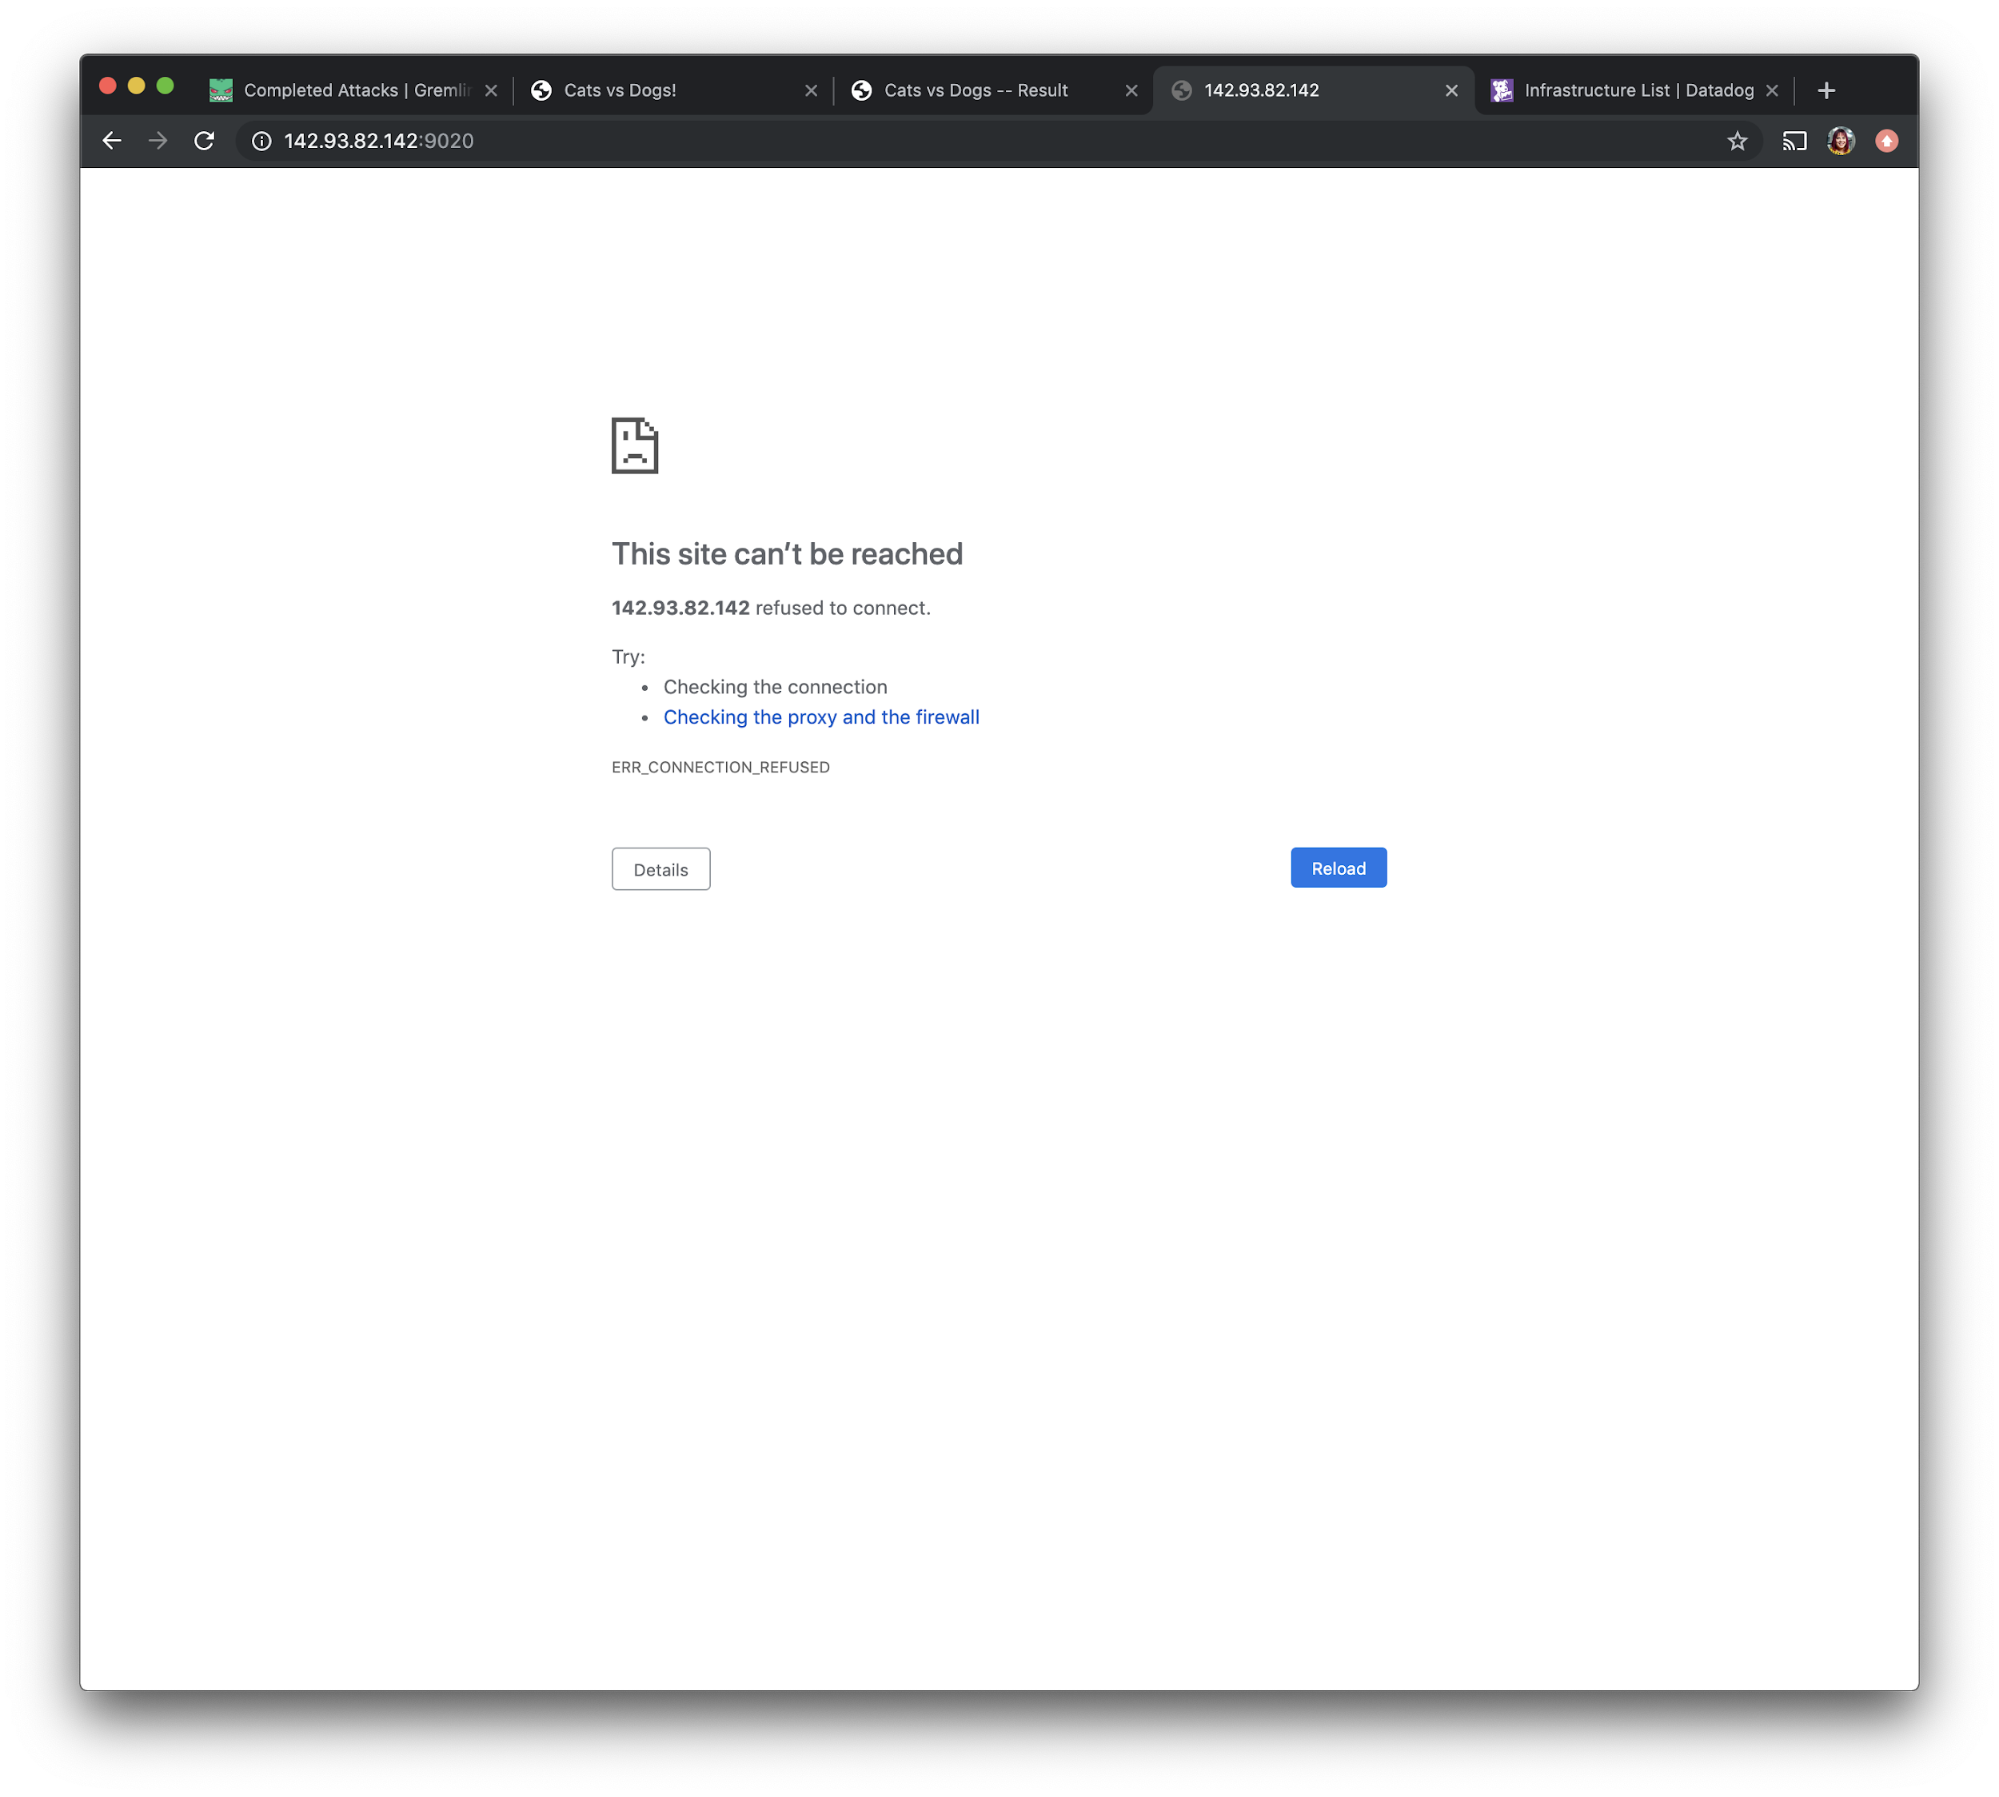
However, if we navigate to access the visualizer app via port 9020, we see that the app does not load as expected.
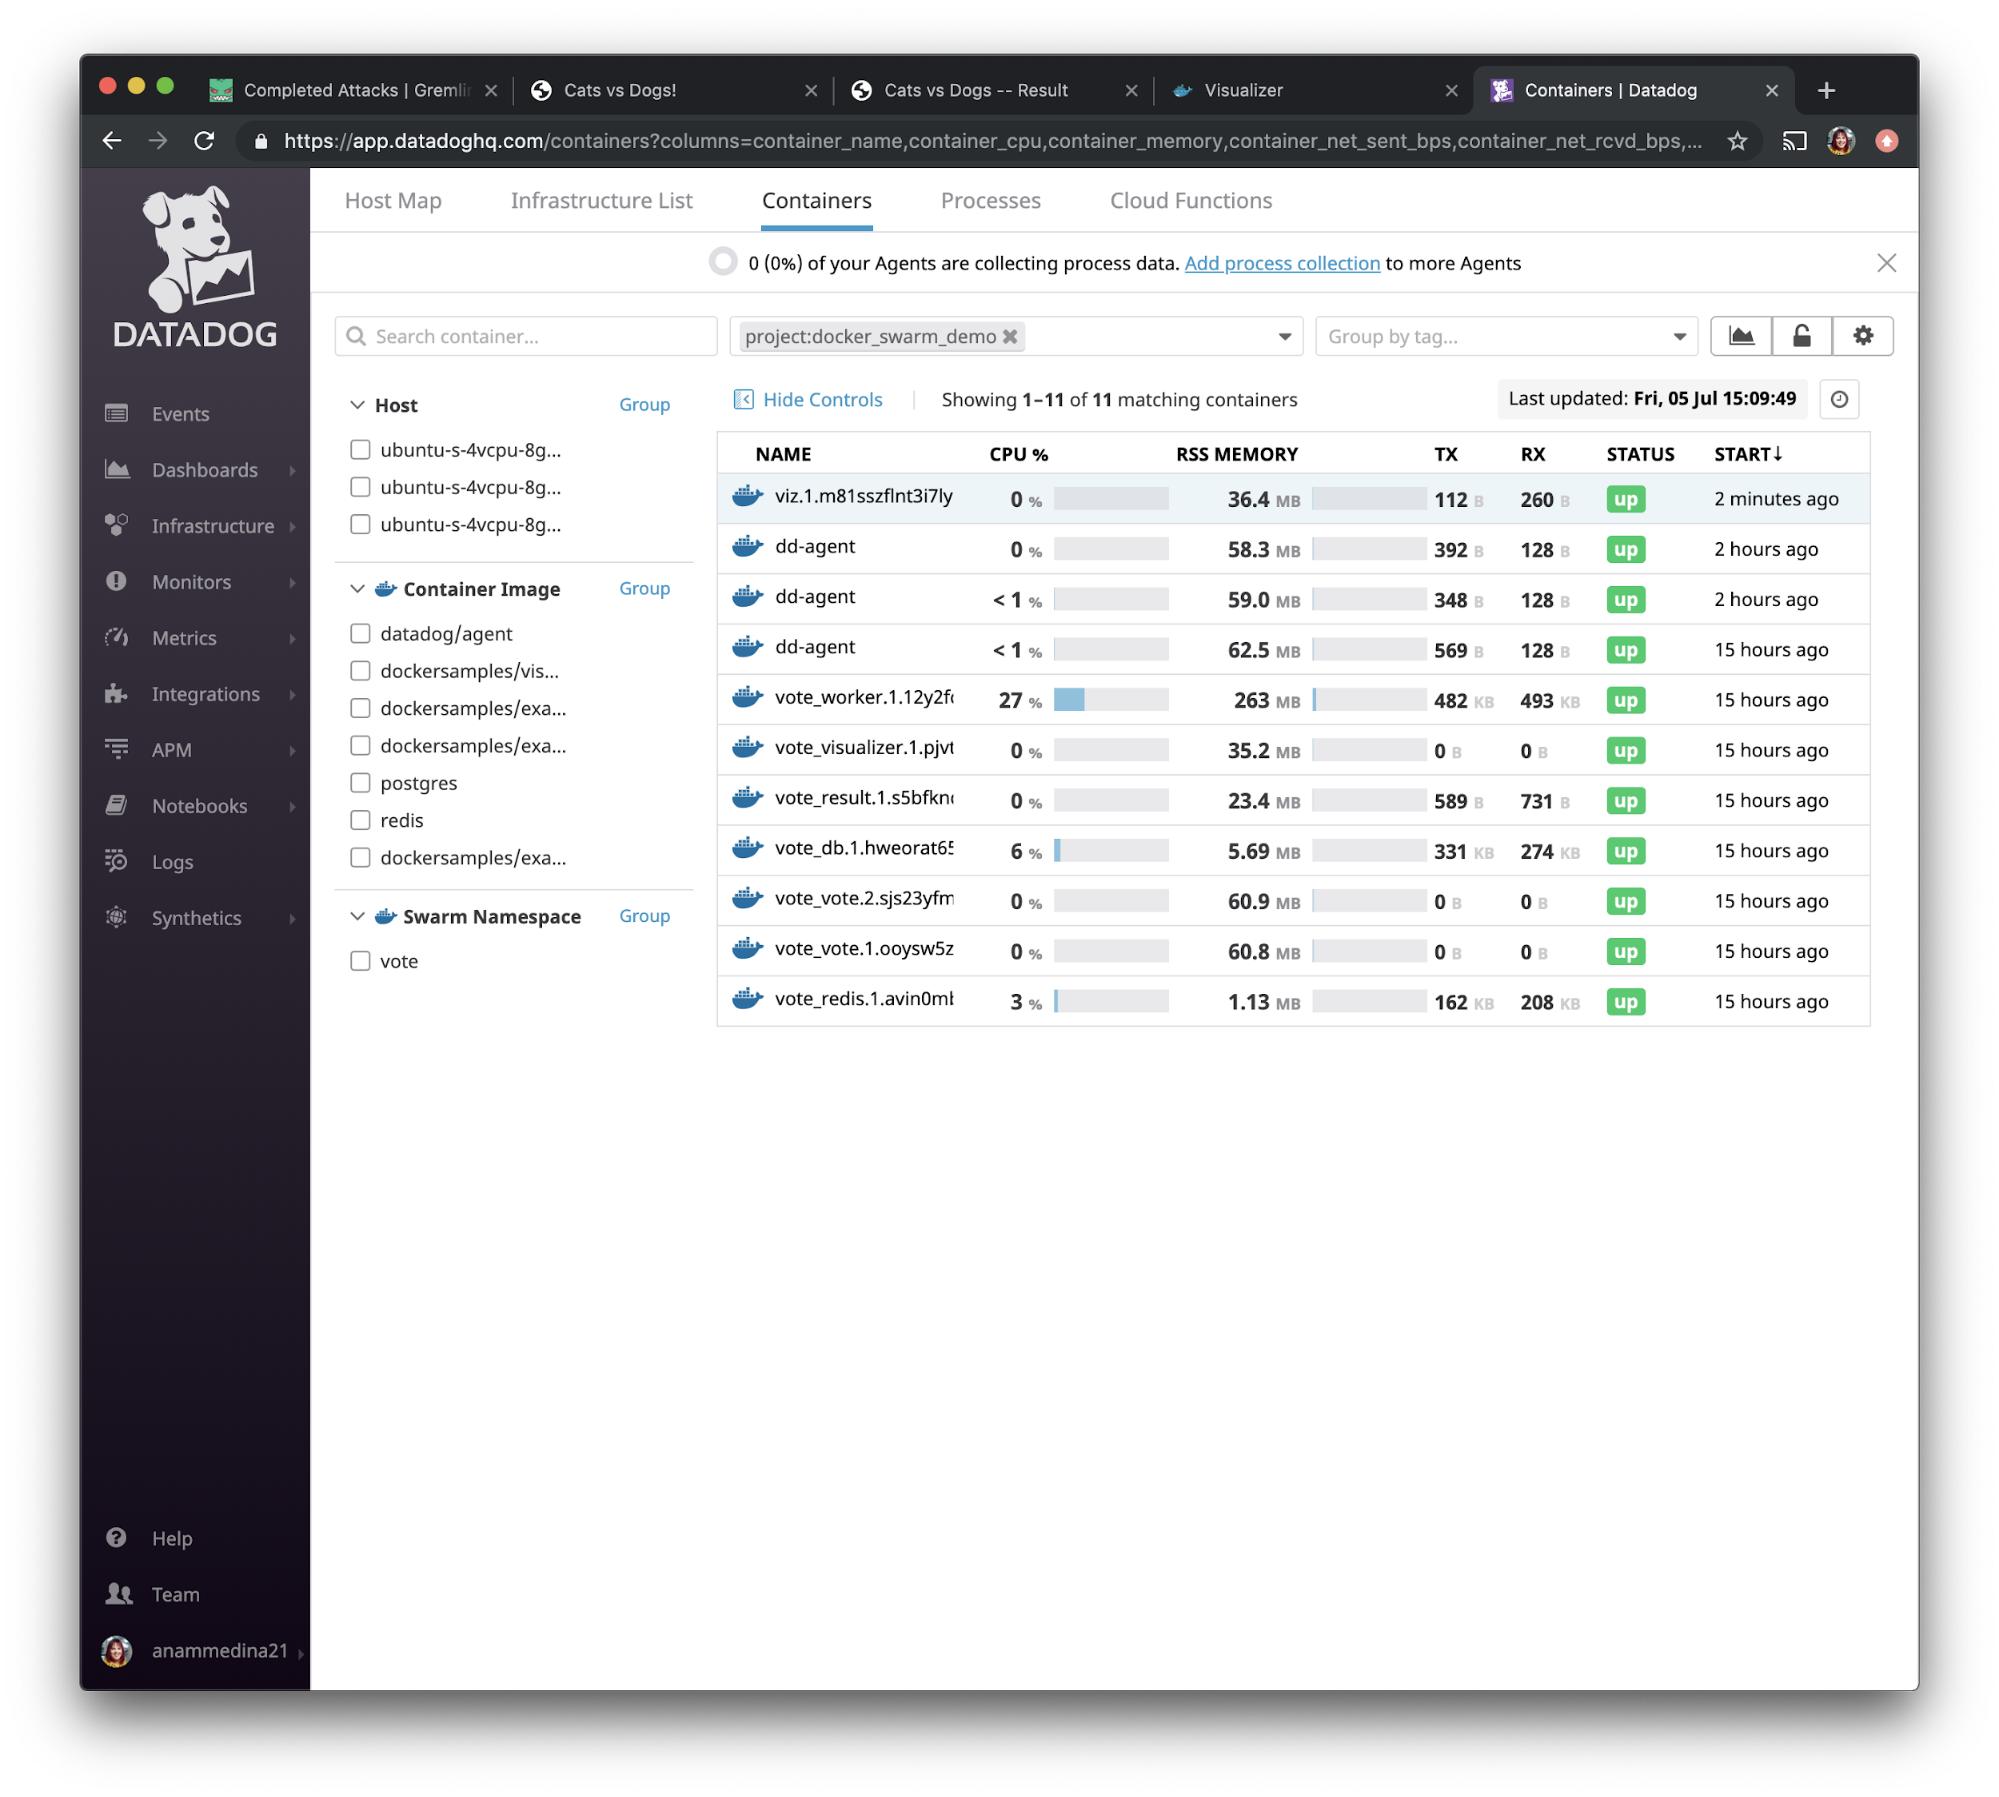
This might just mean that the container hasn't had enough time to fully restart. Let's open the Datadog UI and use the left navigation bar to navigate to “Infrastructure” and select “Containers”.

We can then search our containers by using the tag we had created in step 3: <span class="code-class-custom">project:docker_swarm_demo</span>. After sorting by “Start” you can see that our viz container restarted and the status is that it’s back and running.
When we navigate to access the visualizer app via port 9020, we see that the app is loading like we saw it before.
While there was a small delay, this confirms our hypothesis that Docker Swarm automatically restarts stopped apps and Datadog shows the change.
Step 9: Experiment #2: Validate monitoring by running a CPU attack on all hosts
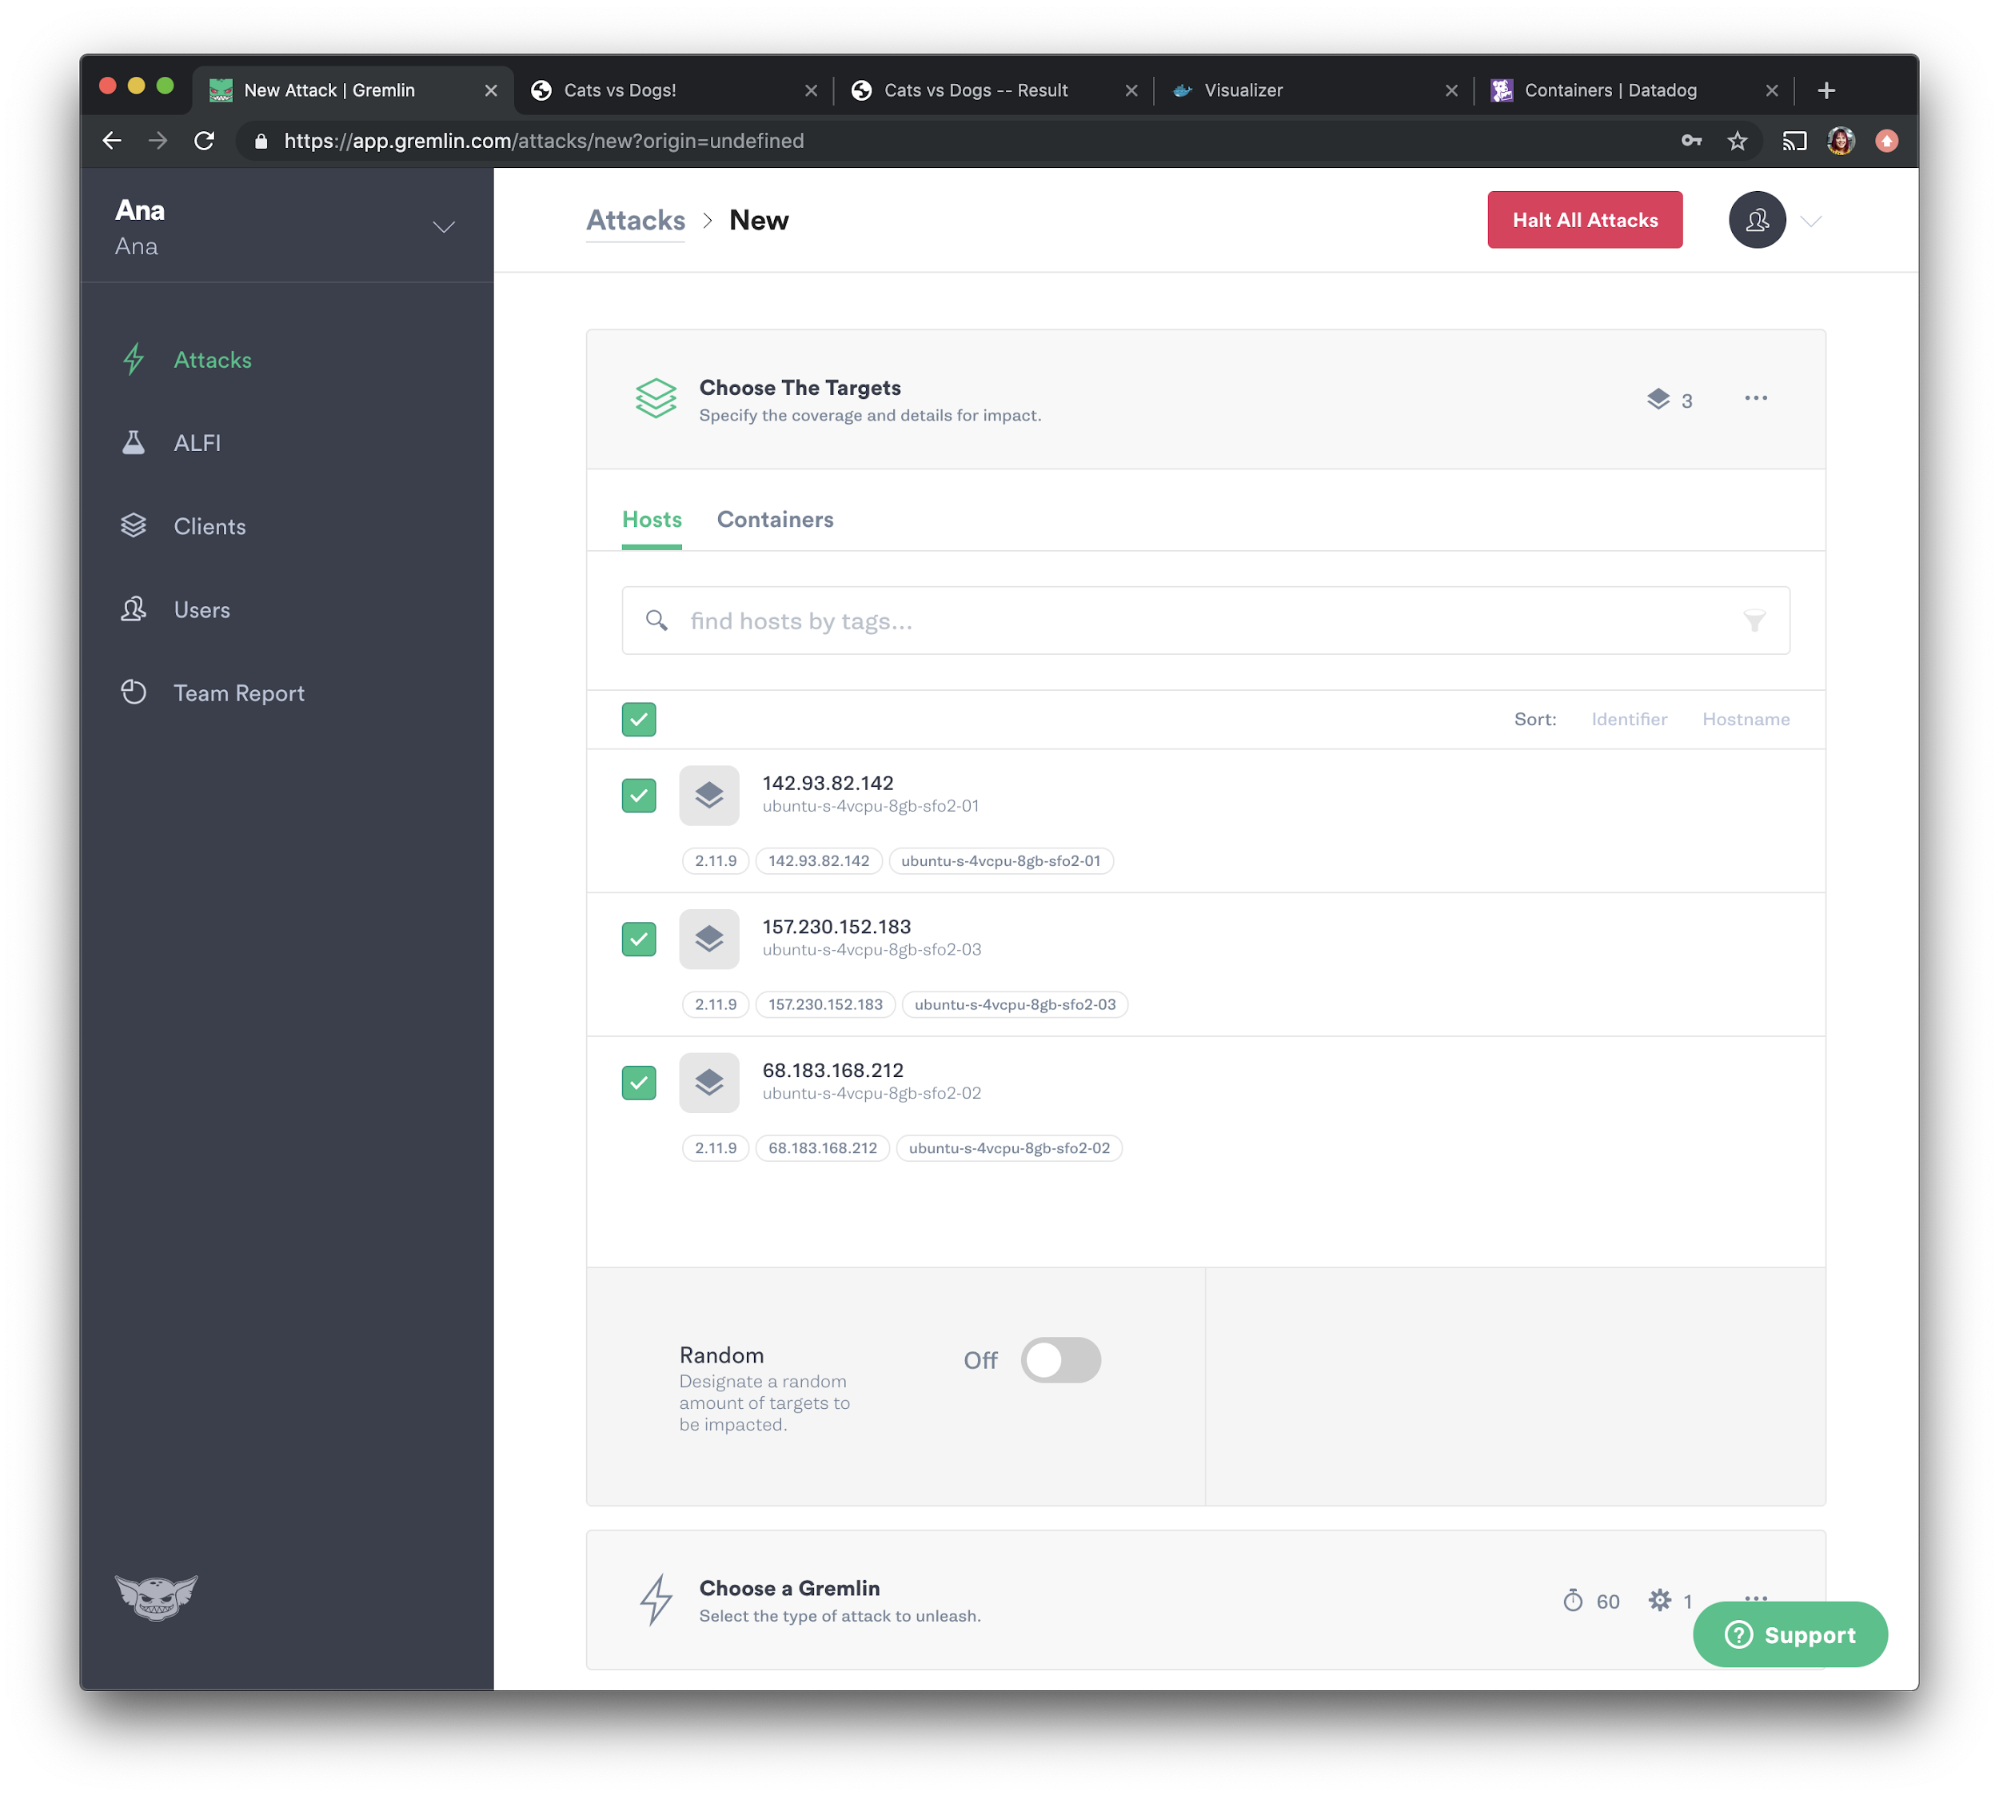
Our second chaos experiment will help us validate that we have configured our monitoring properly. Our hypothesis is: “when we consume CPU resources, our monitoring tool, Datadog, will show this increase and alert us if it passes our threshold.” Going back to the Gremlin web app, select “Attacks” from the menu on the left and press “New Attack”. Instead of selecting an individual container, we'll select all three hosts this time.
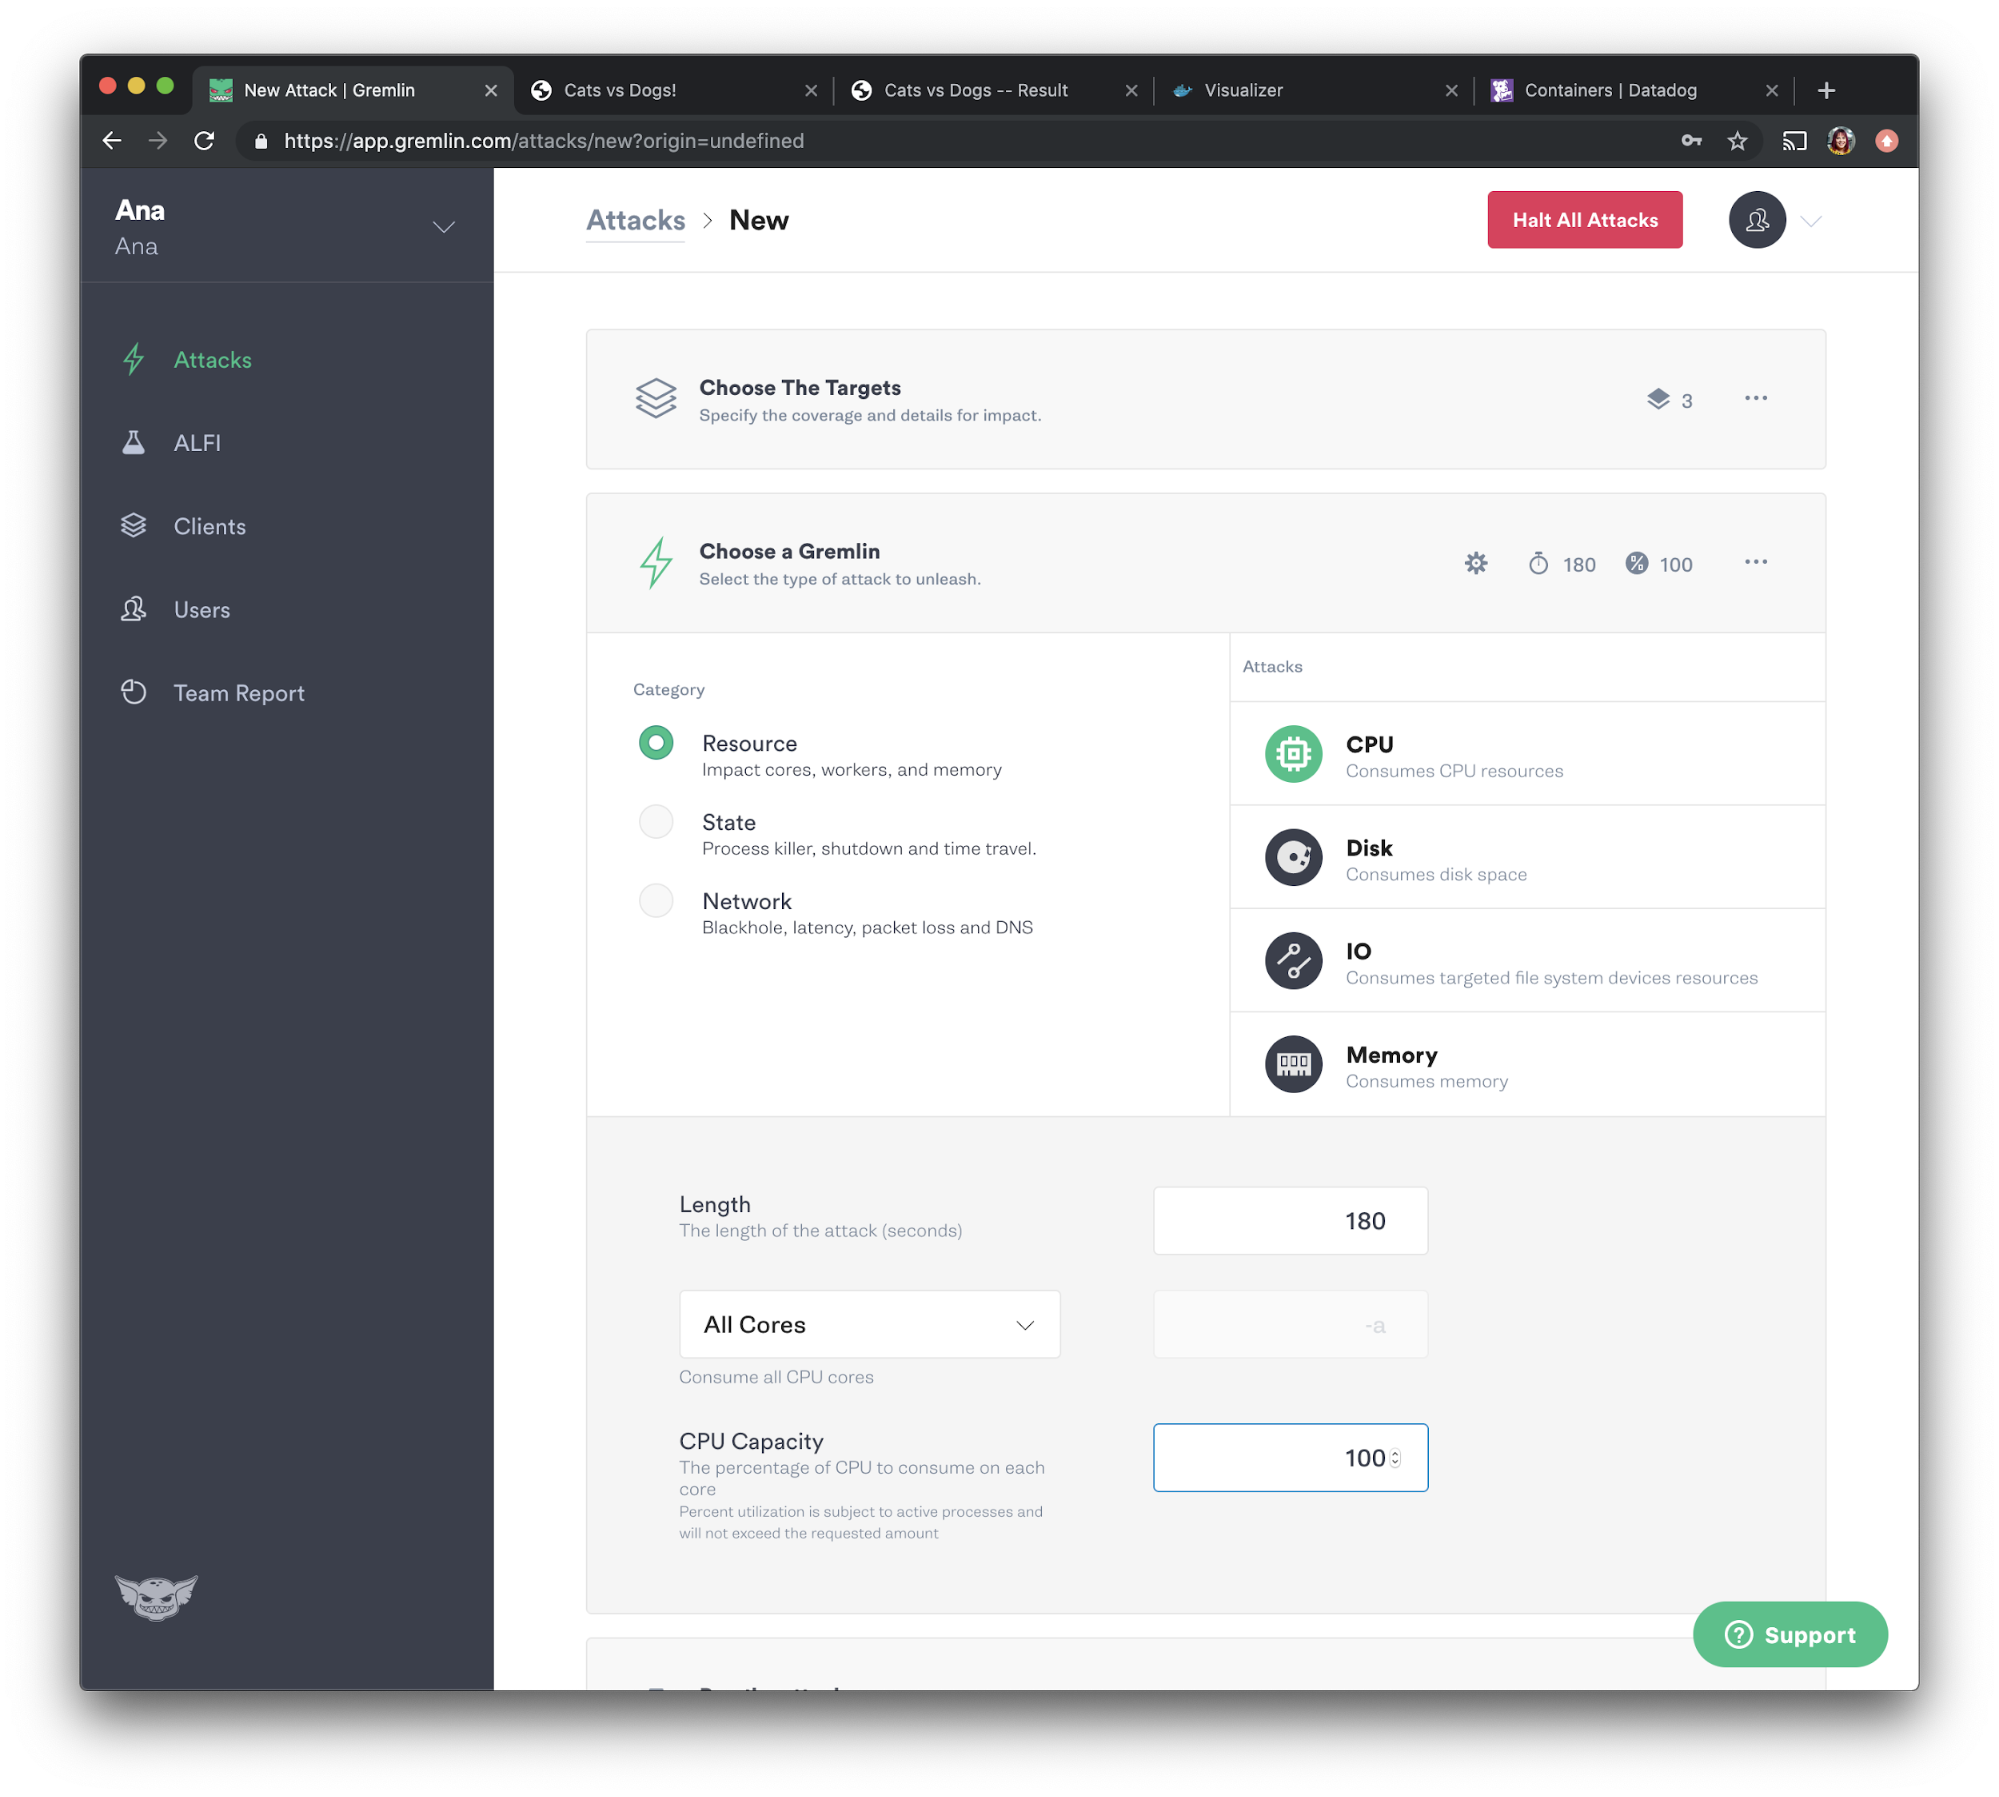
We will now choose the attack we want to run, which is a CPU attack. Select “Resource” and choose “CPU” from the options. Set the length to <span class="code-class-custom">180</span> seconds, select <span class="code-class-custom">All Cores</span> from the dropdown, then set “CPU Capacity” to <span class="code-class-custom">100</span>. Click the “Unleash Gremlin” button to run the attack.
Experiment #2 results
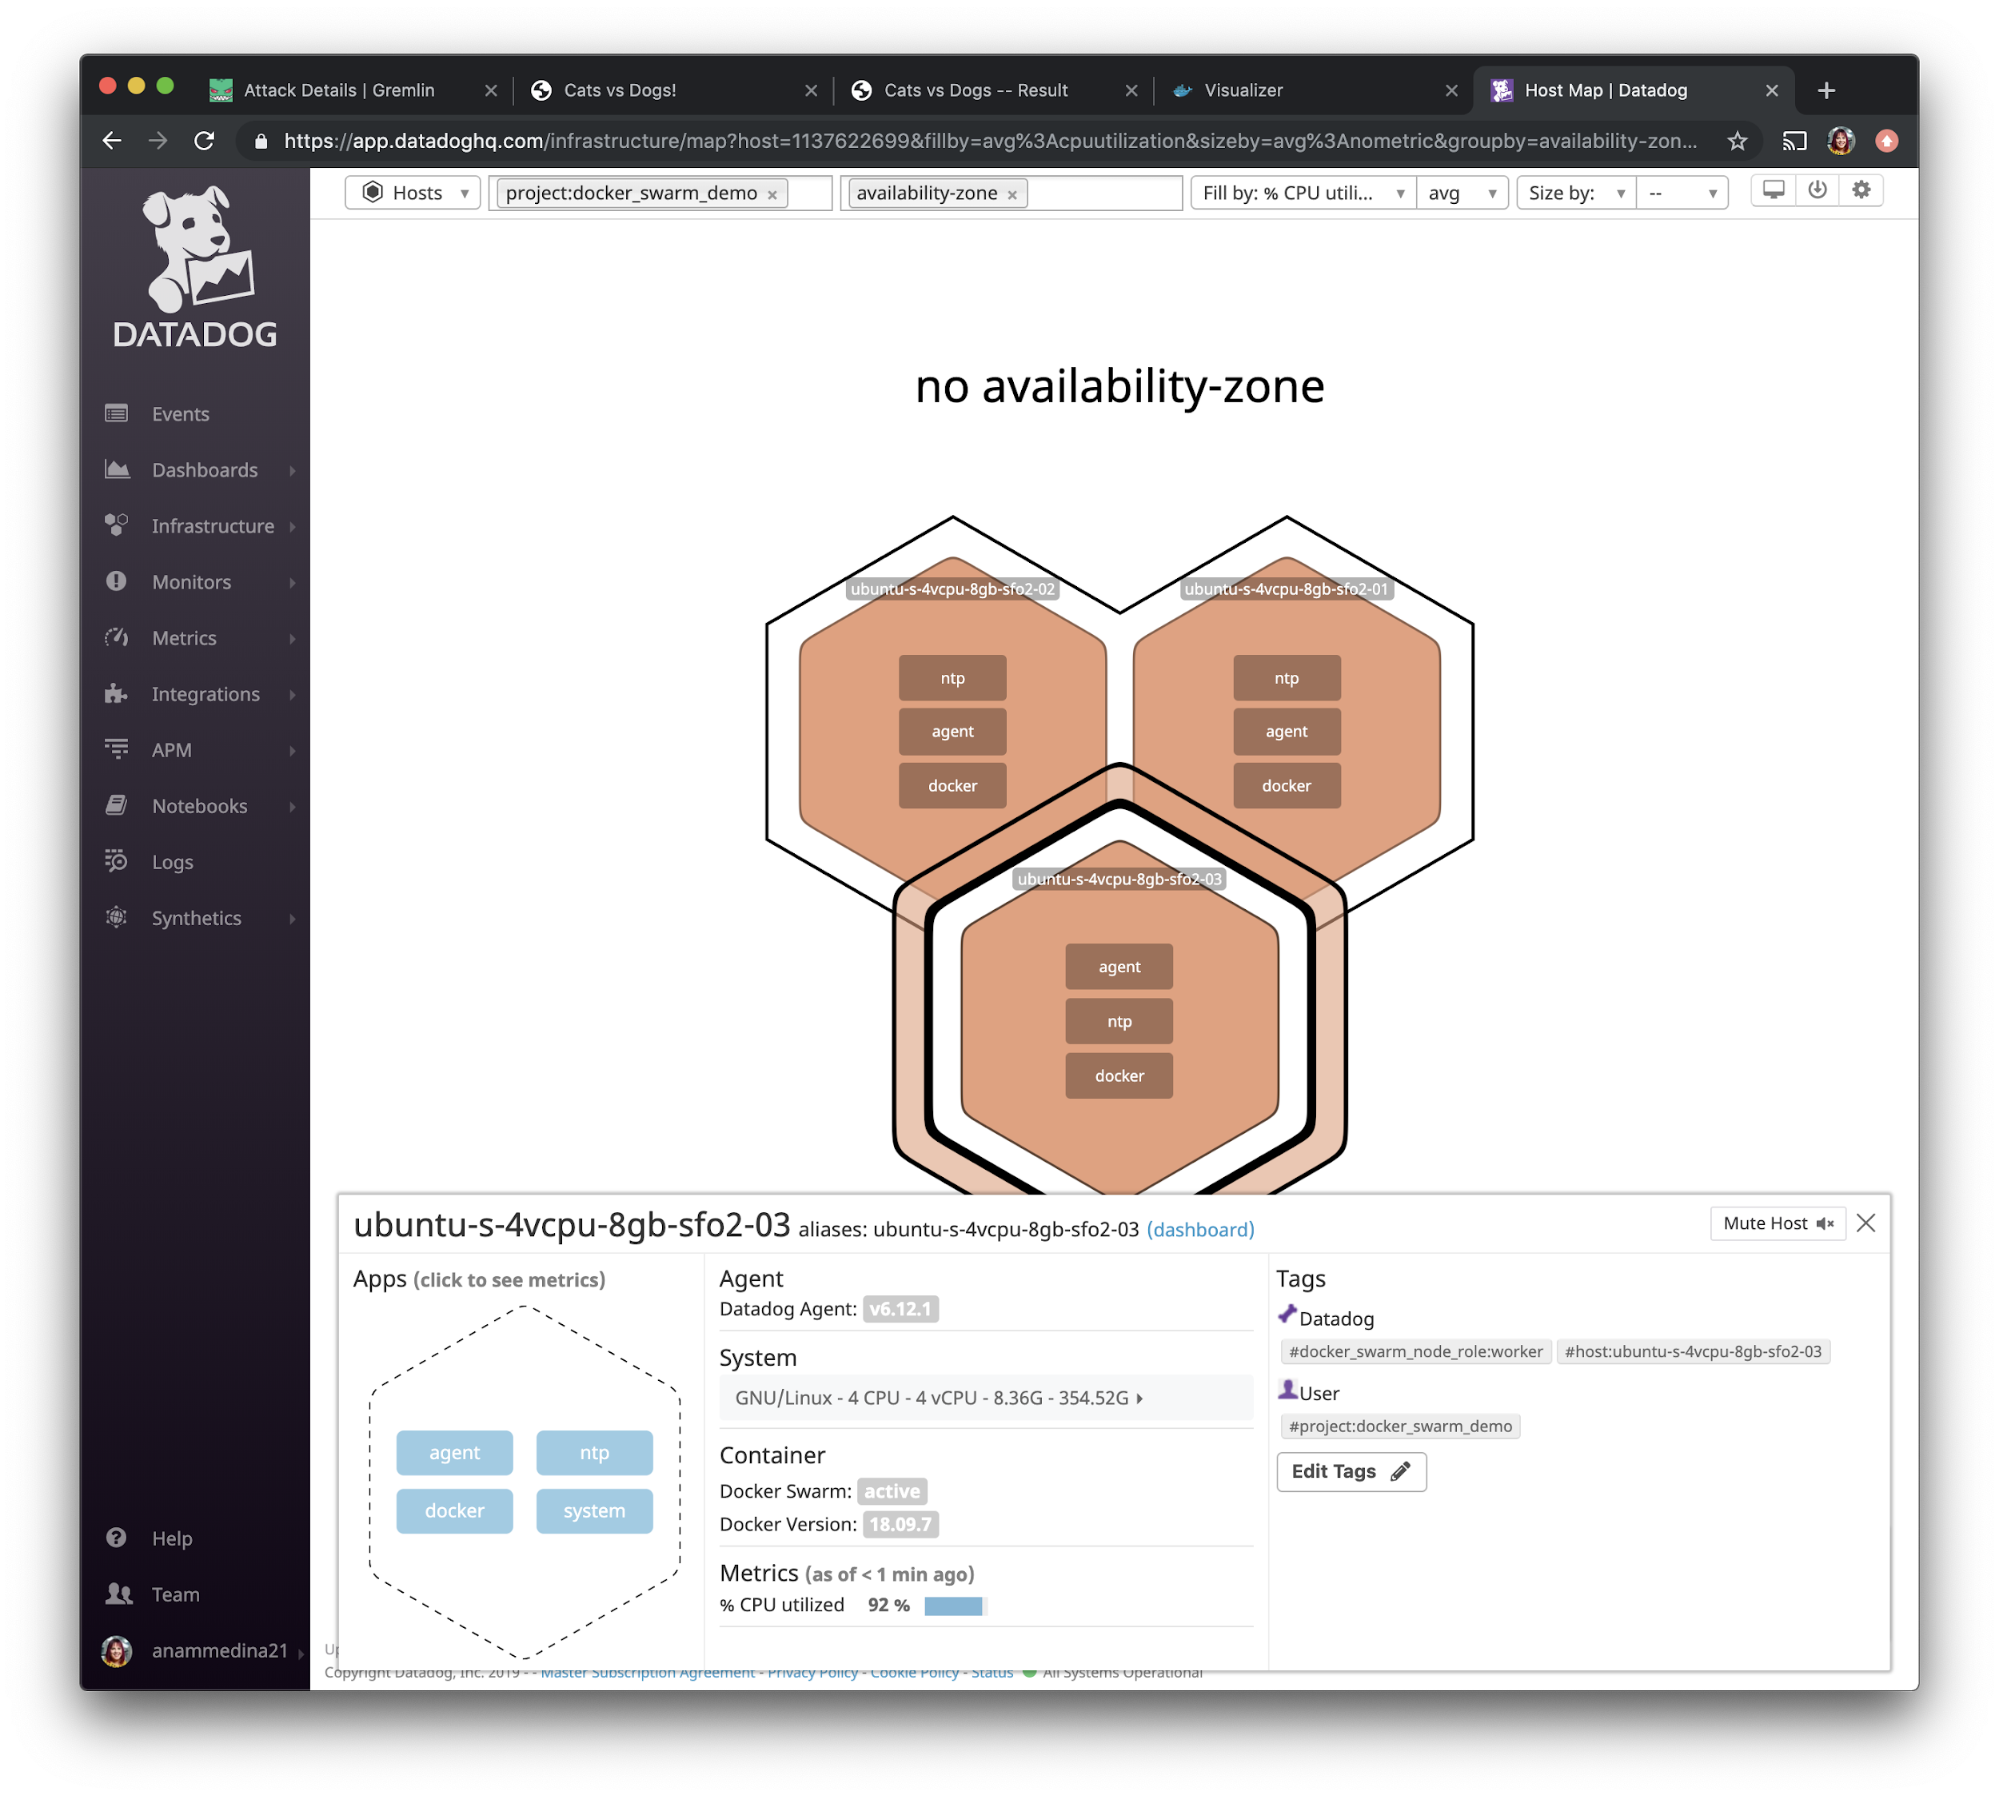
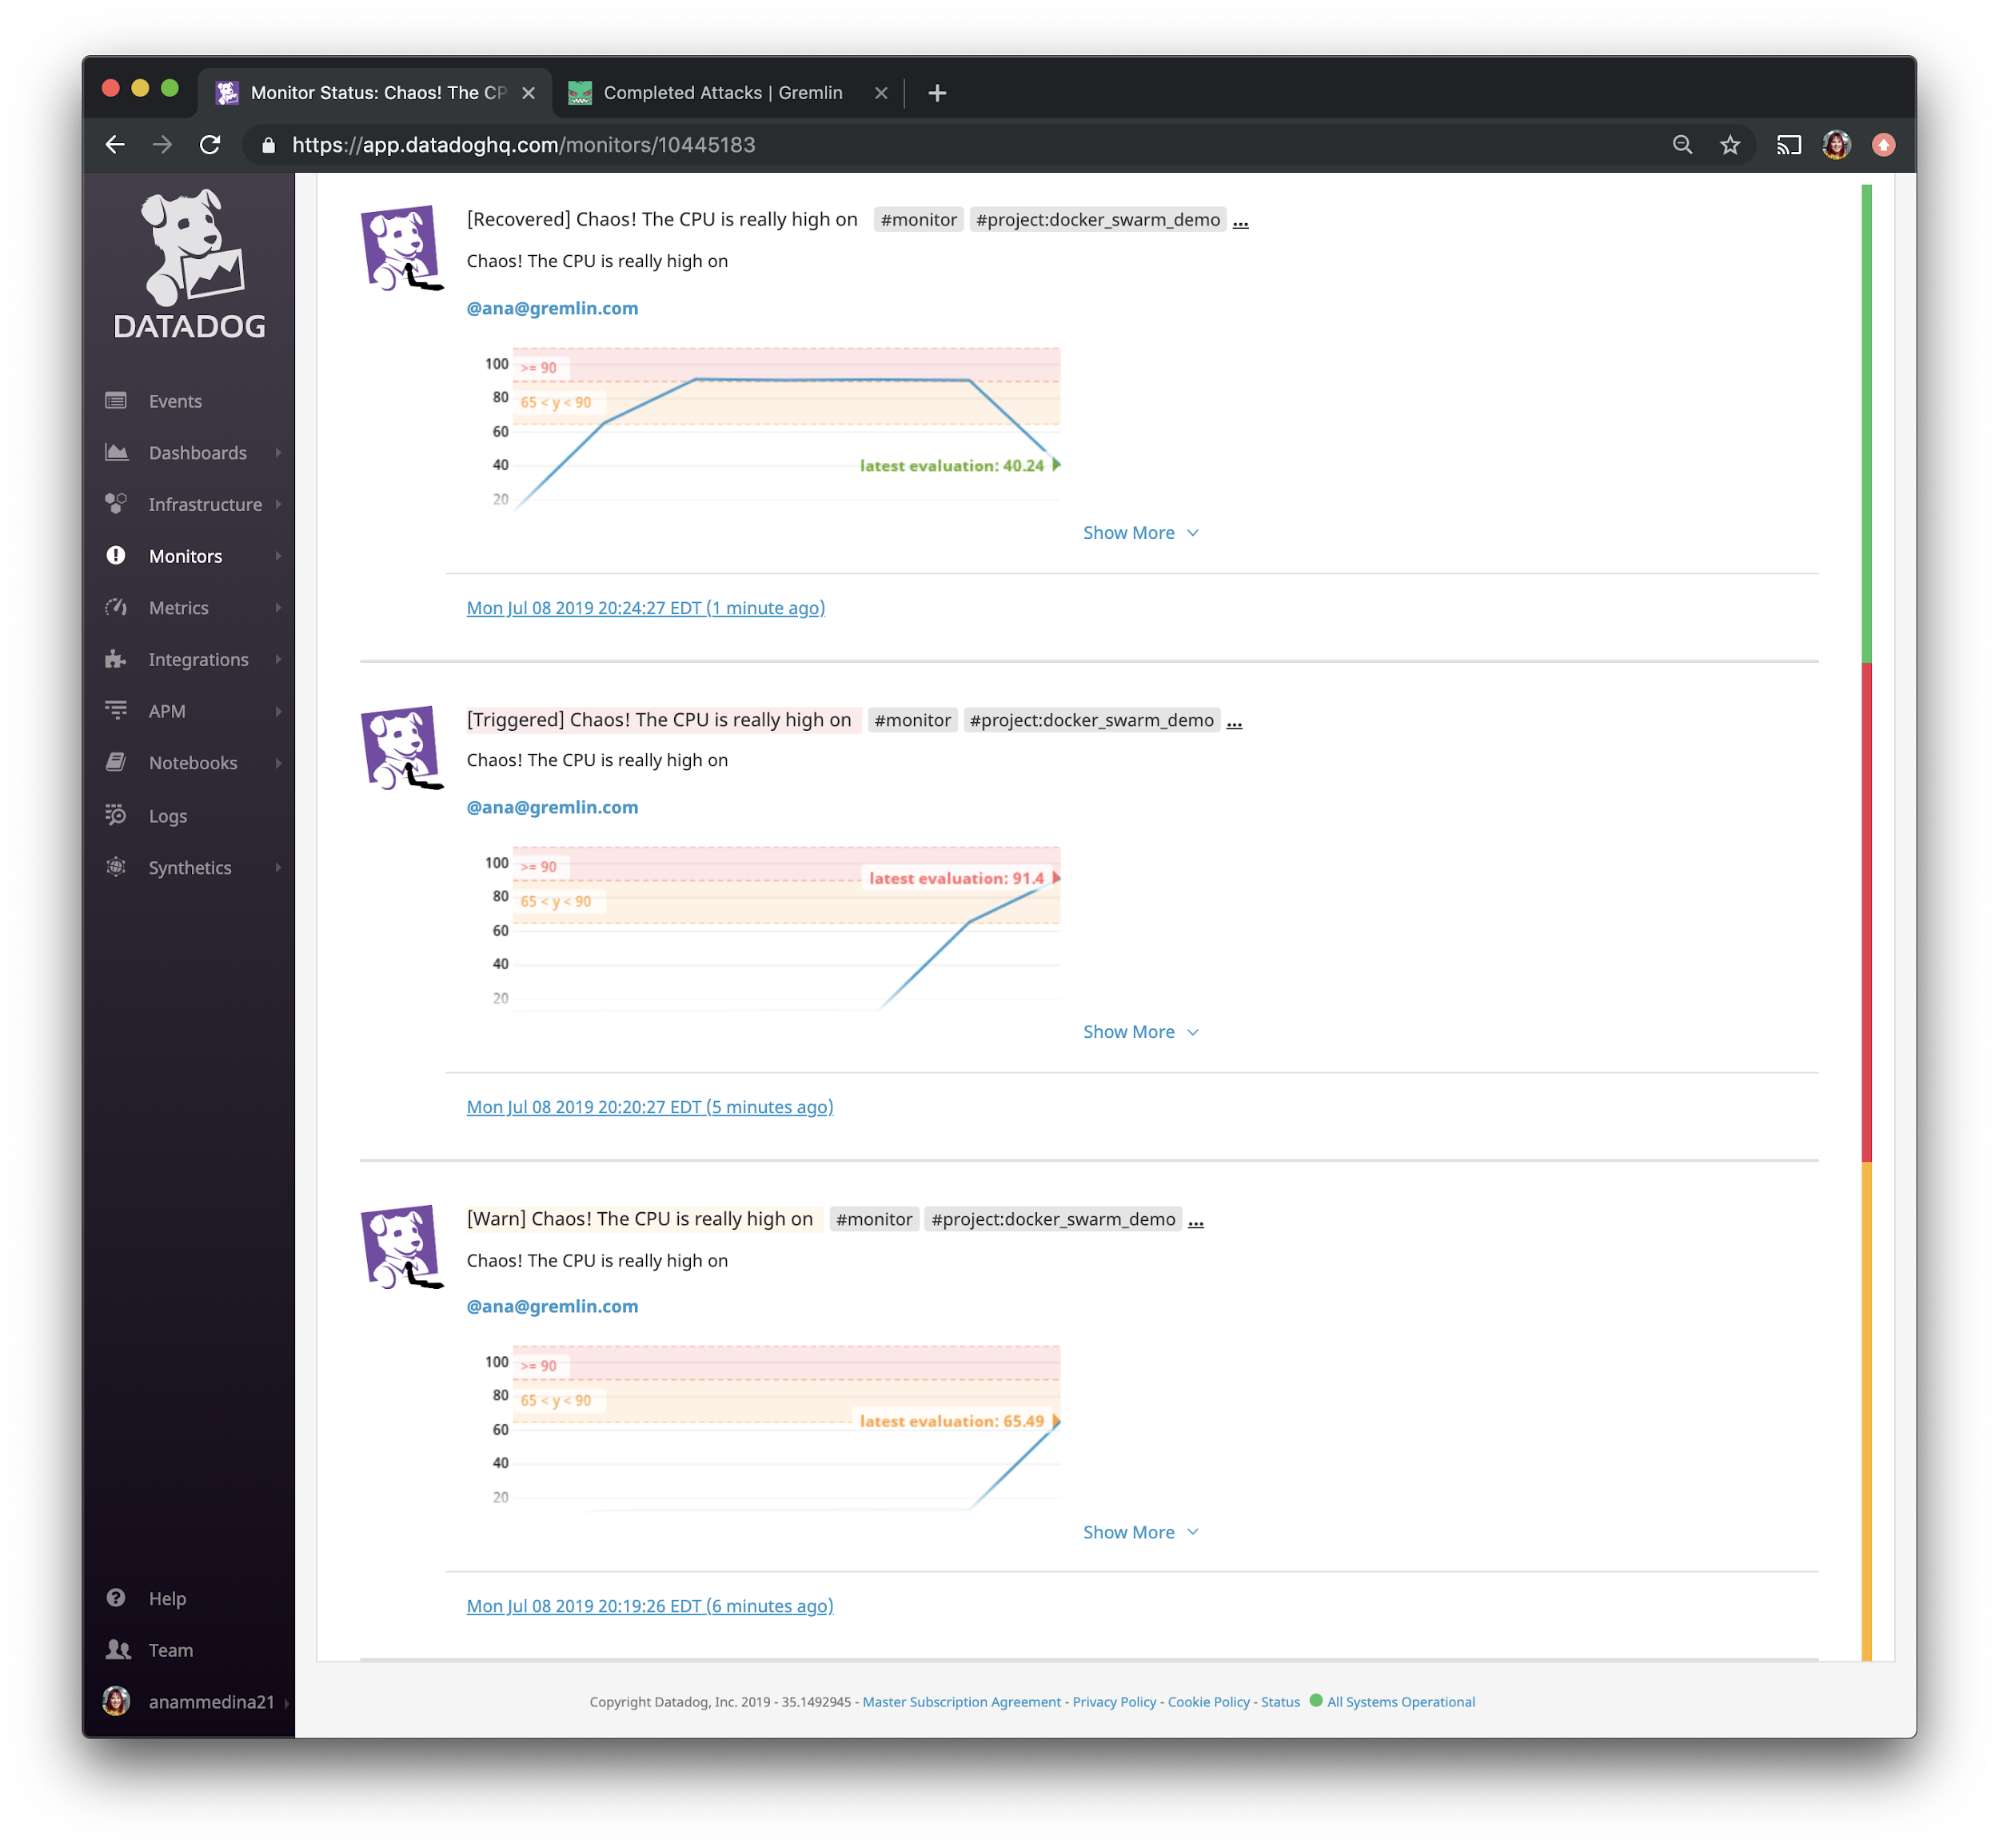
Our hypothesis was: “when we consume CPU resources, our monitoring tool, Datadog, will show this increase and alert us if it passes our threshold.” If we configured everything properly, Datadog will show that the hosts have utilized a significant amount of CPU.
When we go back to the Datadog UI and use the left navigation bar to navigate to “Infrastructure” and select “Host Map” and filter by the <span class="code-class-custom">project:docker_swarm_demo</span> tag we created, we see that the CPU resources on these hosts jumped up to 92%.
This experiment also validated that we set up Datadog Monitoring properly, and that we're receiving email alerts as expected.
Step 10: Experiment #3: Test disaster recovery using a shutdown attack
For our last experiment, we'll be thinking about what happens when our main application goes down. In this case, it will be the voting application. Our hypothesis is, “when we shut down all of our containers for the vote application, we will only suffer a few seconds of downtime as Docker Swarm provisions and deploys new containers.”
Going back to the Gremlin web app, select “Attacks” from the menu on the left and press “New Attack”. Select “Containers,” then using the search bar, type “vote” and select the vote namespace as shown below:
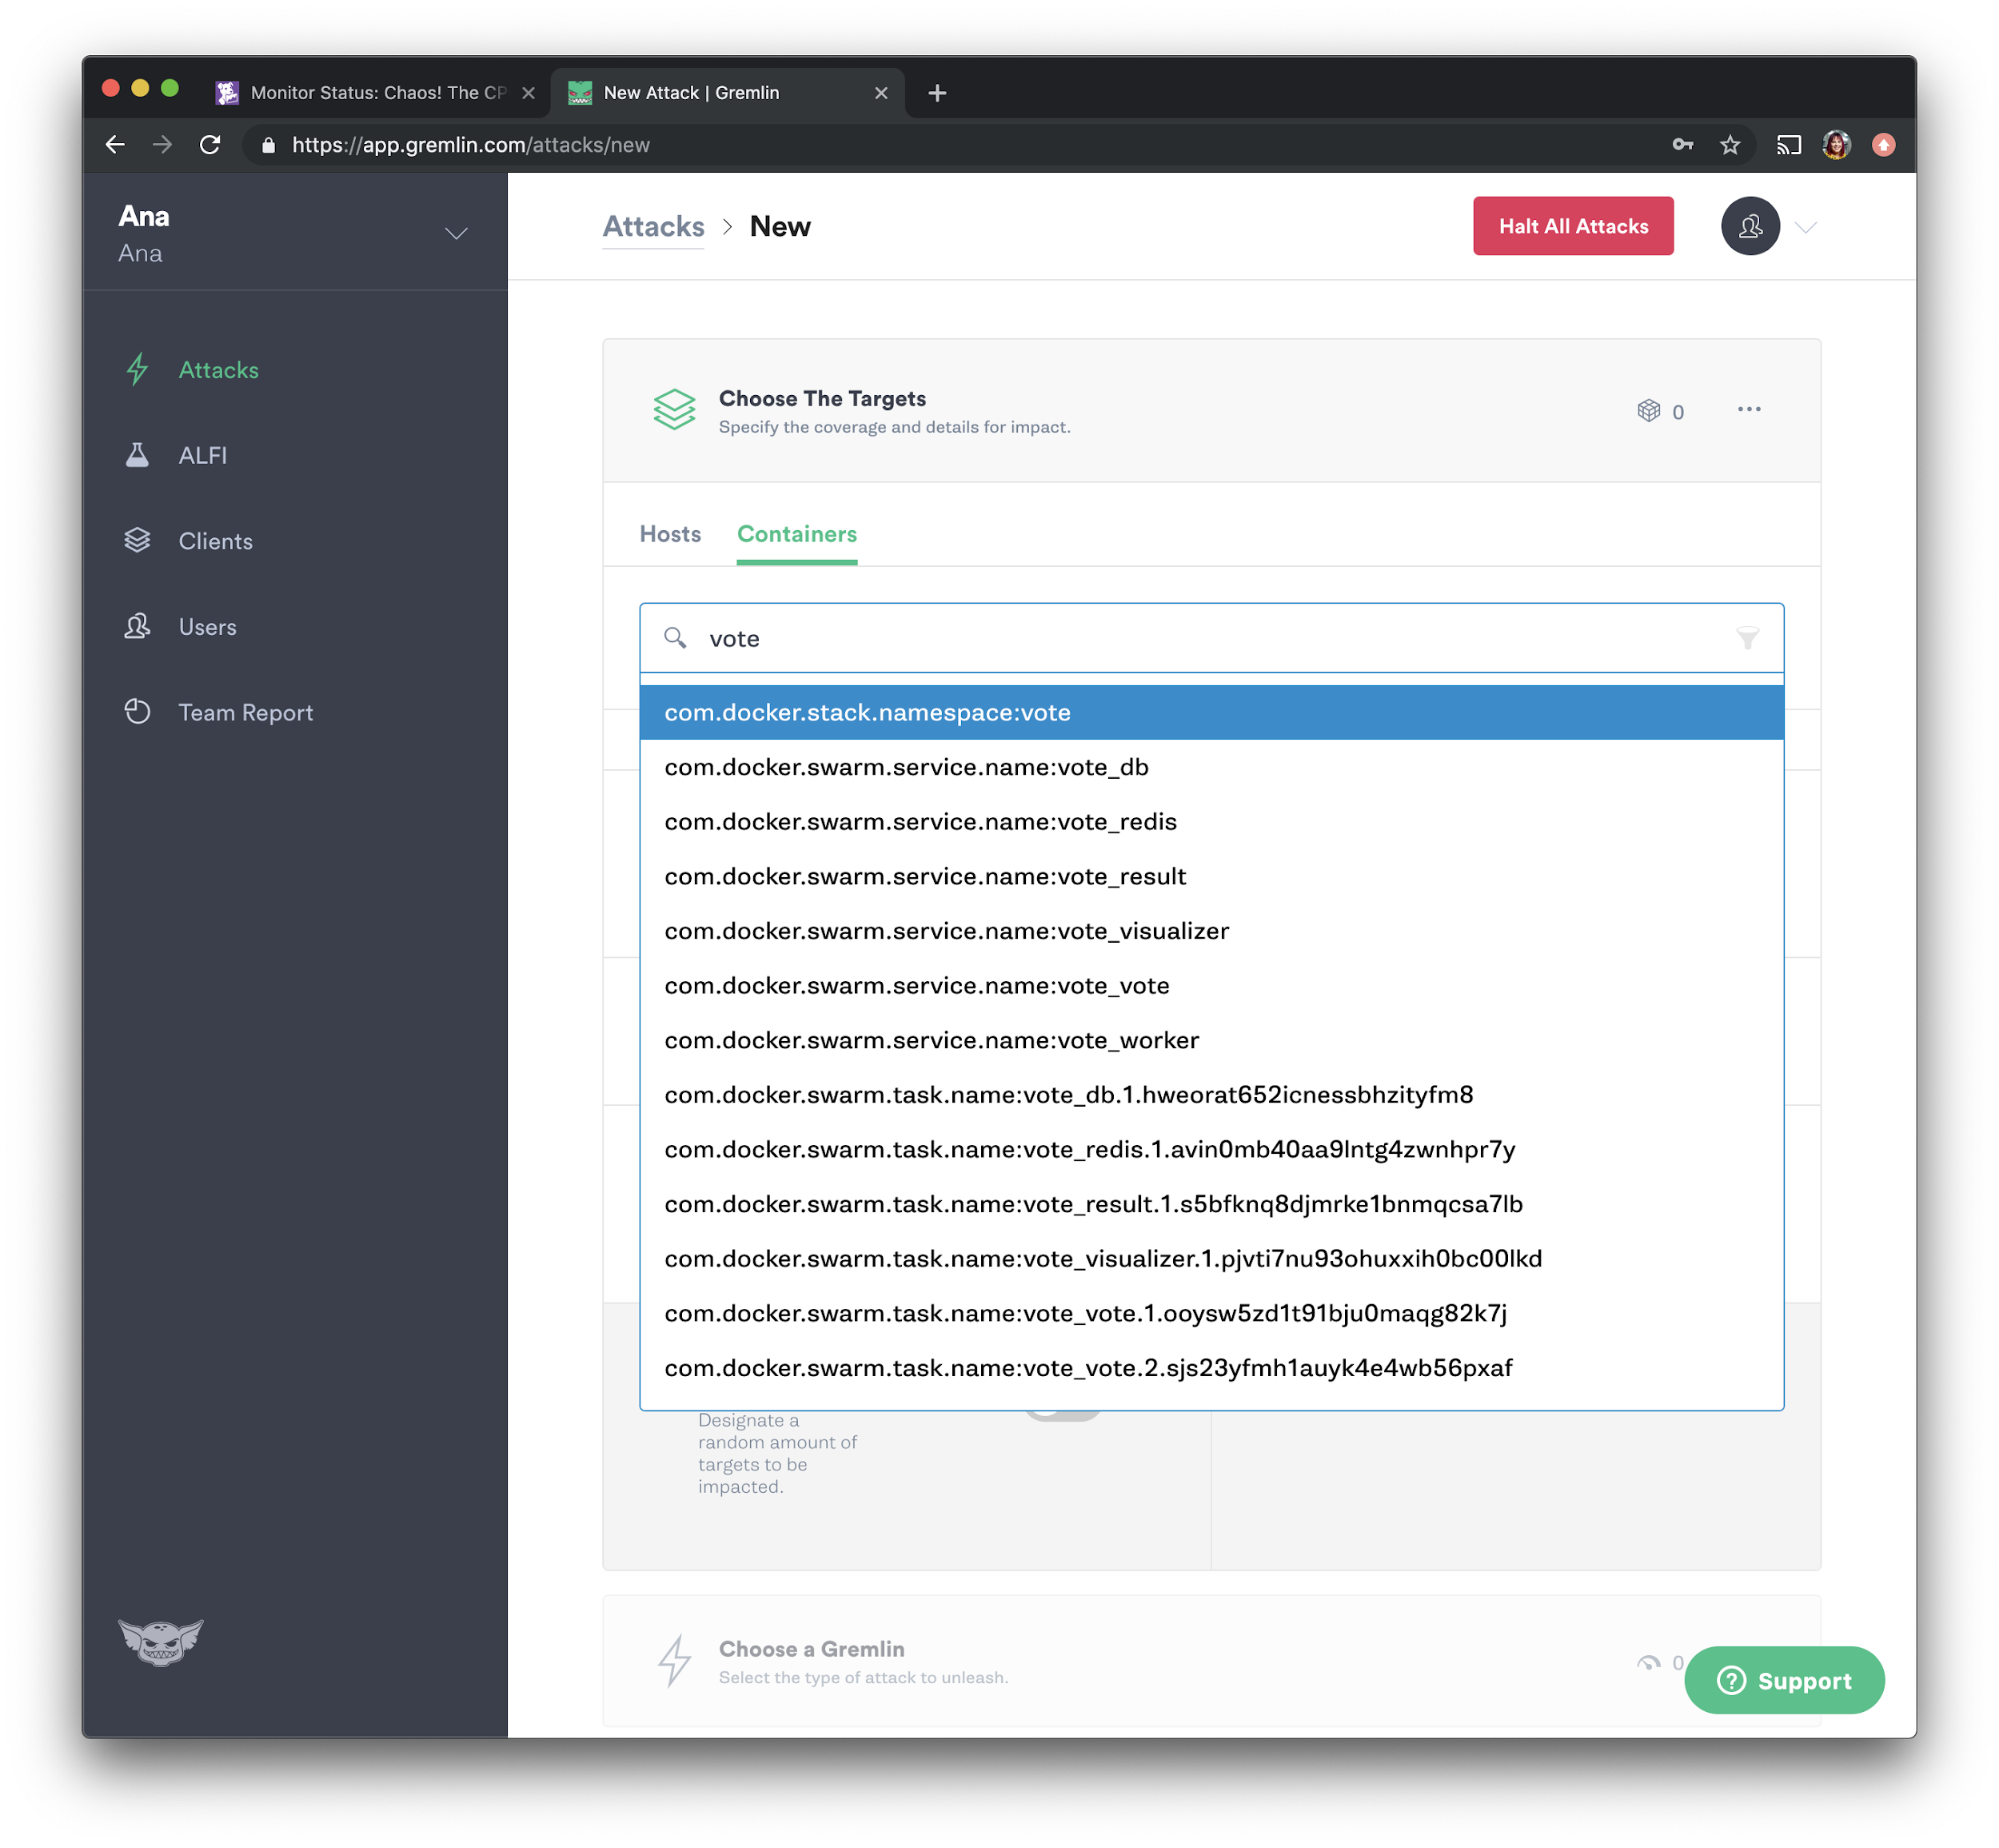
We'll be running another shutdown attack. Select “State” and choose “Shutdown” from the options. Set the delay to 0 and uncheck “Reboot” to prevent the containers from automatically restarting. Press “Unleash Gremlin” to run the attack.
Experiment #3 results
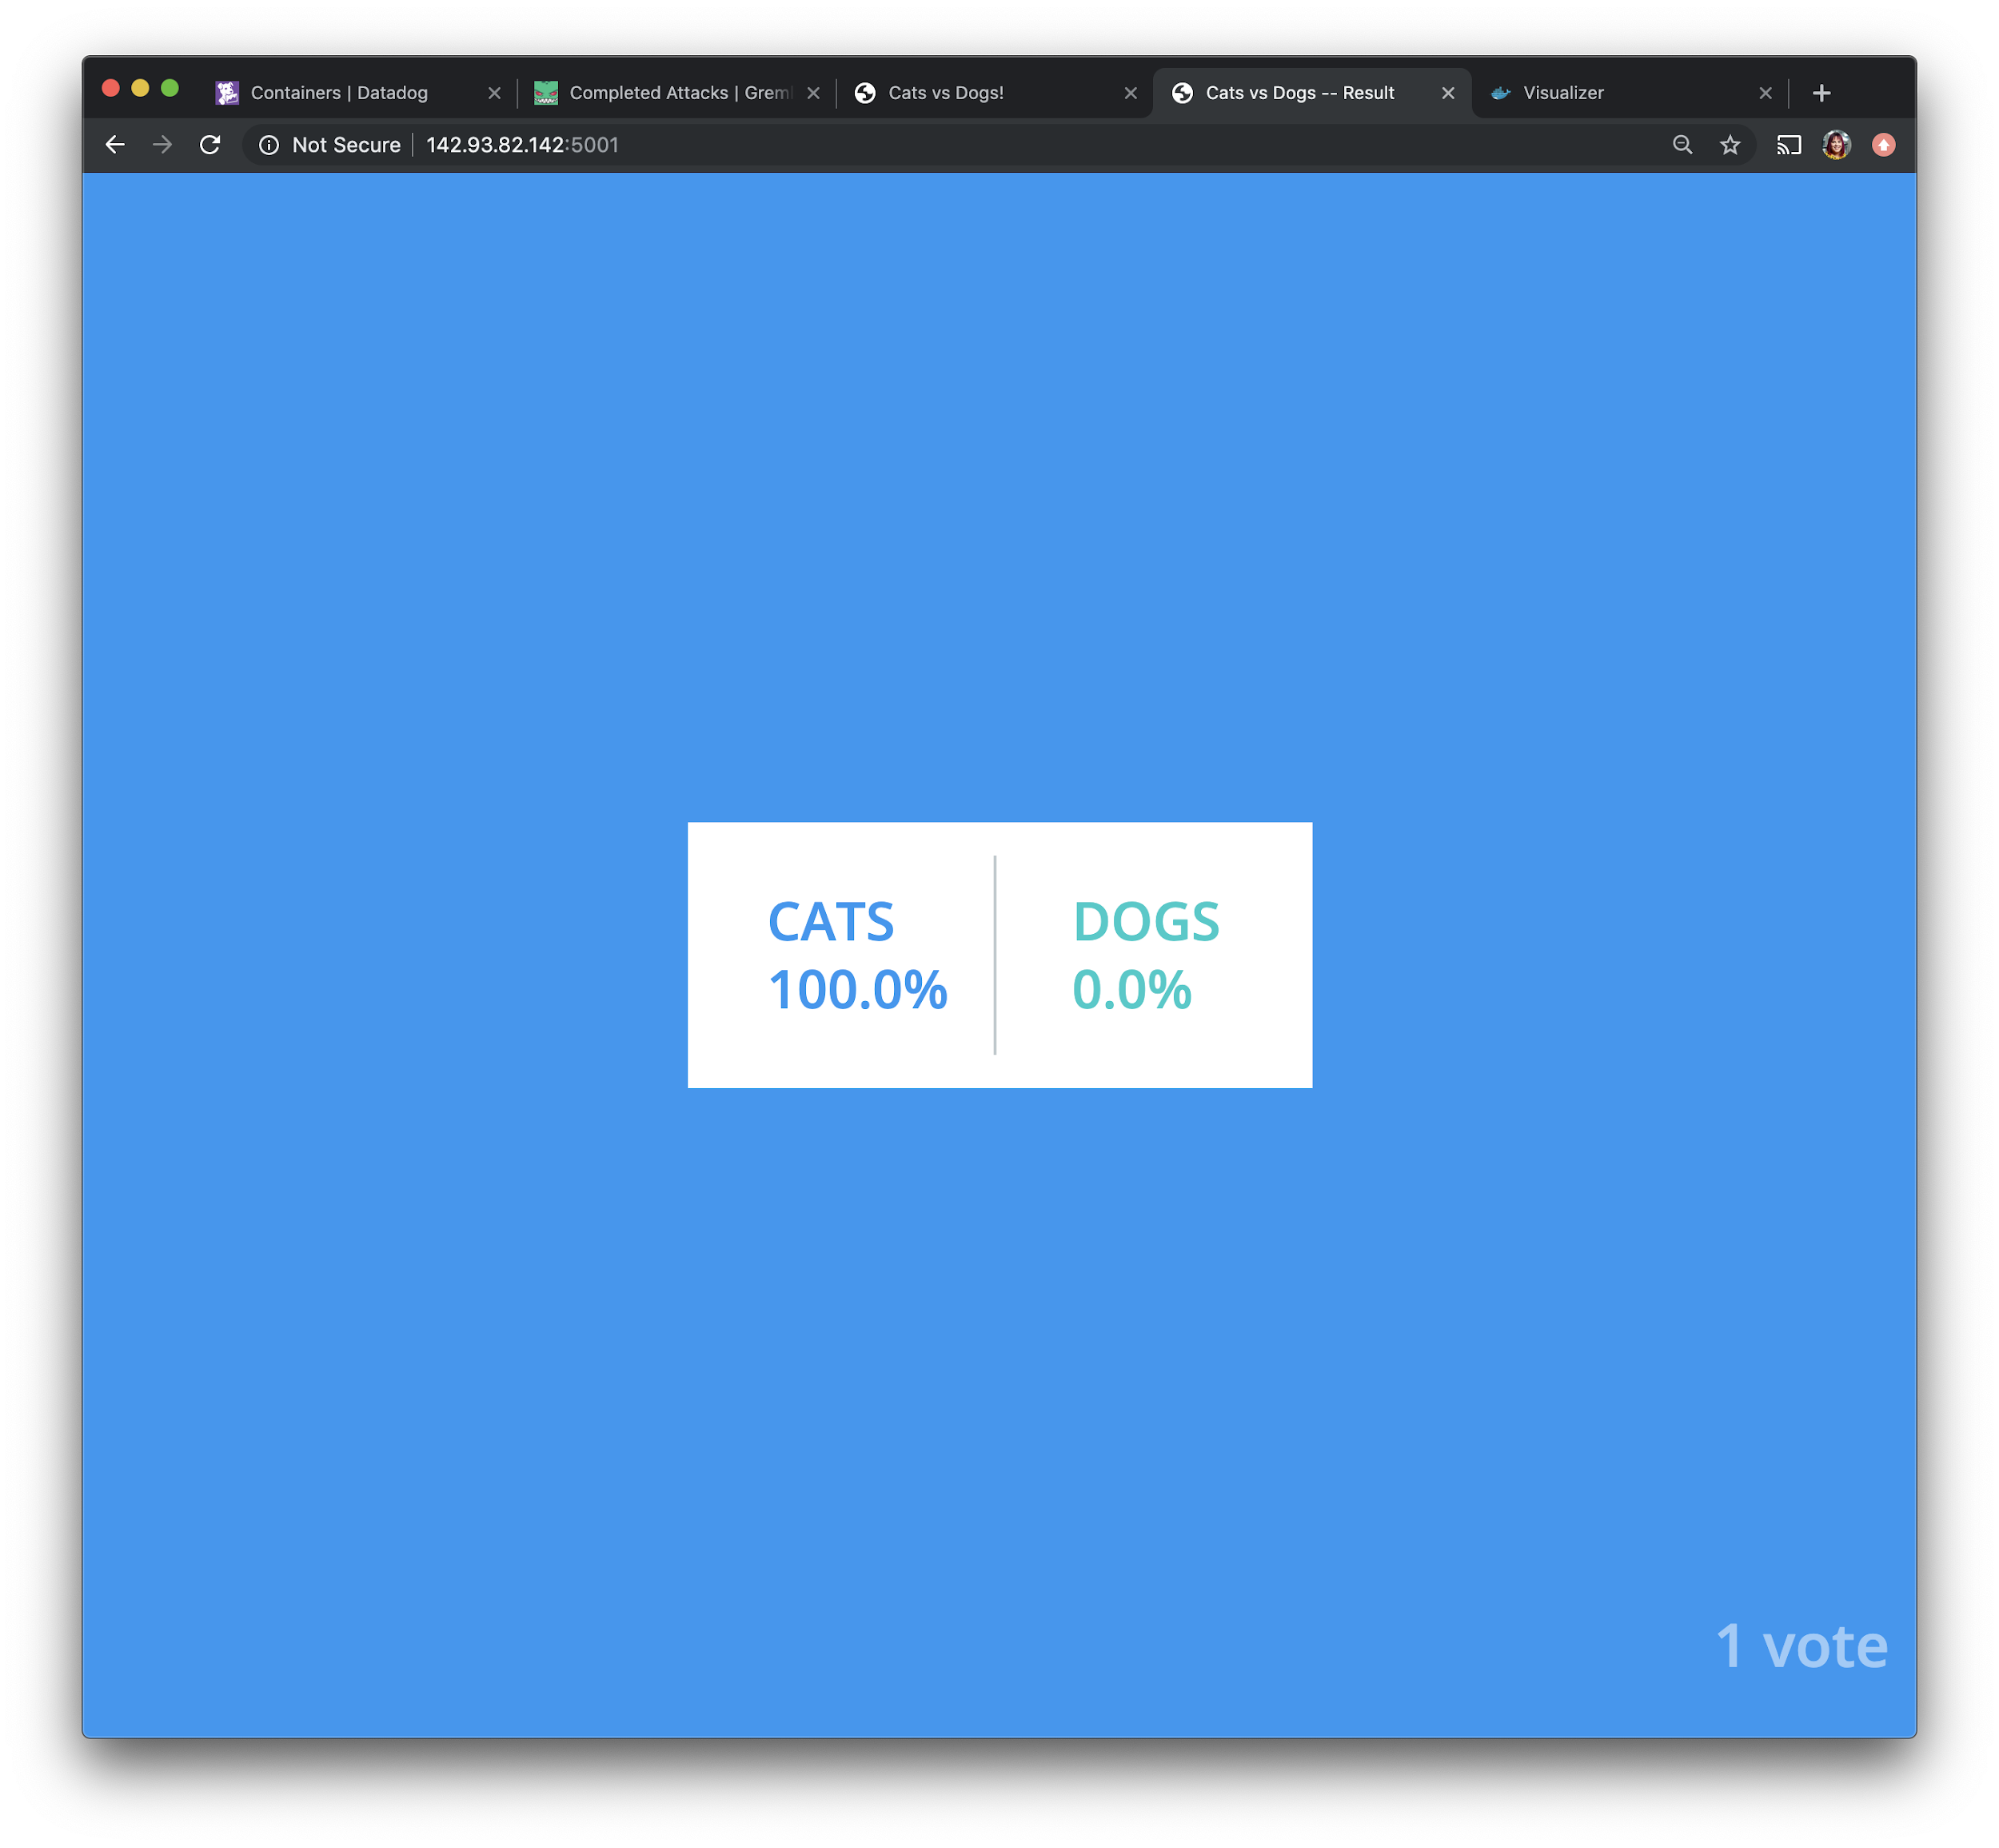
Our hypothesis was, “when we shut down all of our containers for the vote application, we will only suffer a few seconds of downtime as Docker Swarm provisions and deploys new containers.” Let’s verify that first by opening the voting application and the voting results application in a browser.
We can see that our voting results application is running with no downtime, and no data loss.
If we check the container’s monitoring using Datadog and sort by start time, we see that all of our containers are up and running after the restart. This means that Docker Swarm was able to quickly restart the containers, which is exactly what we wanted.
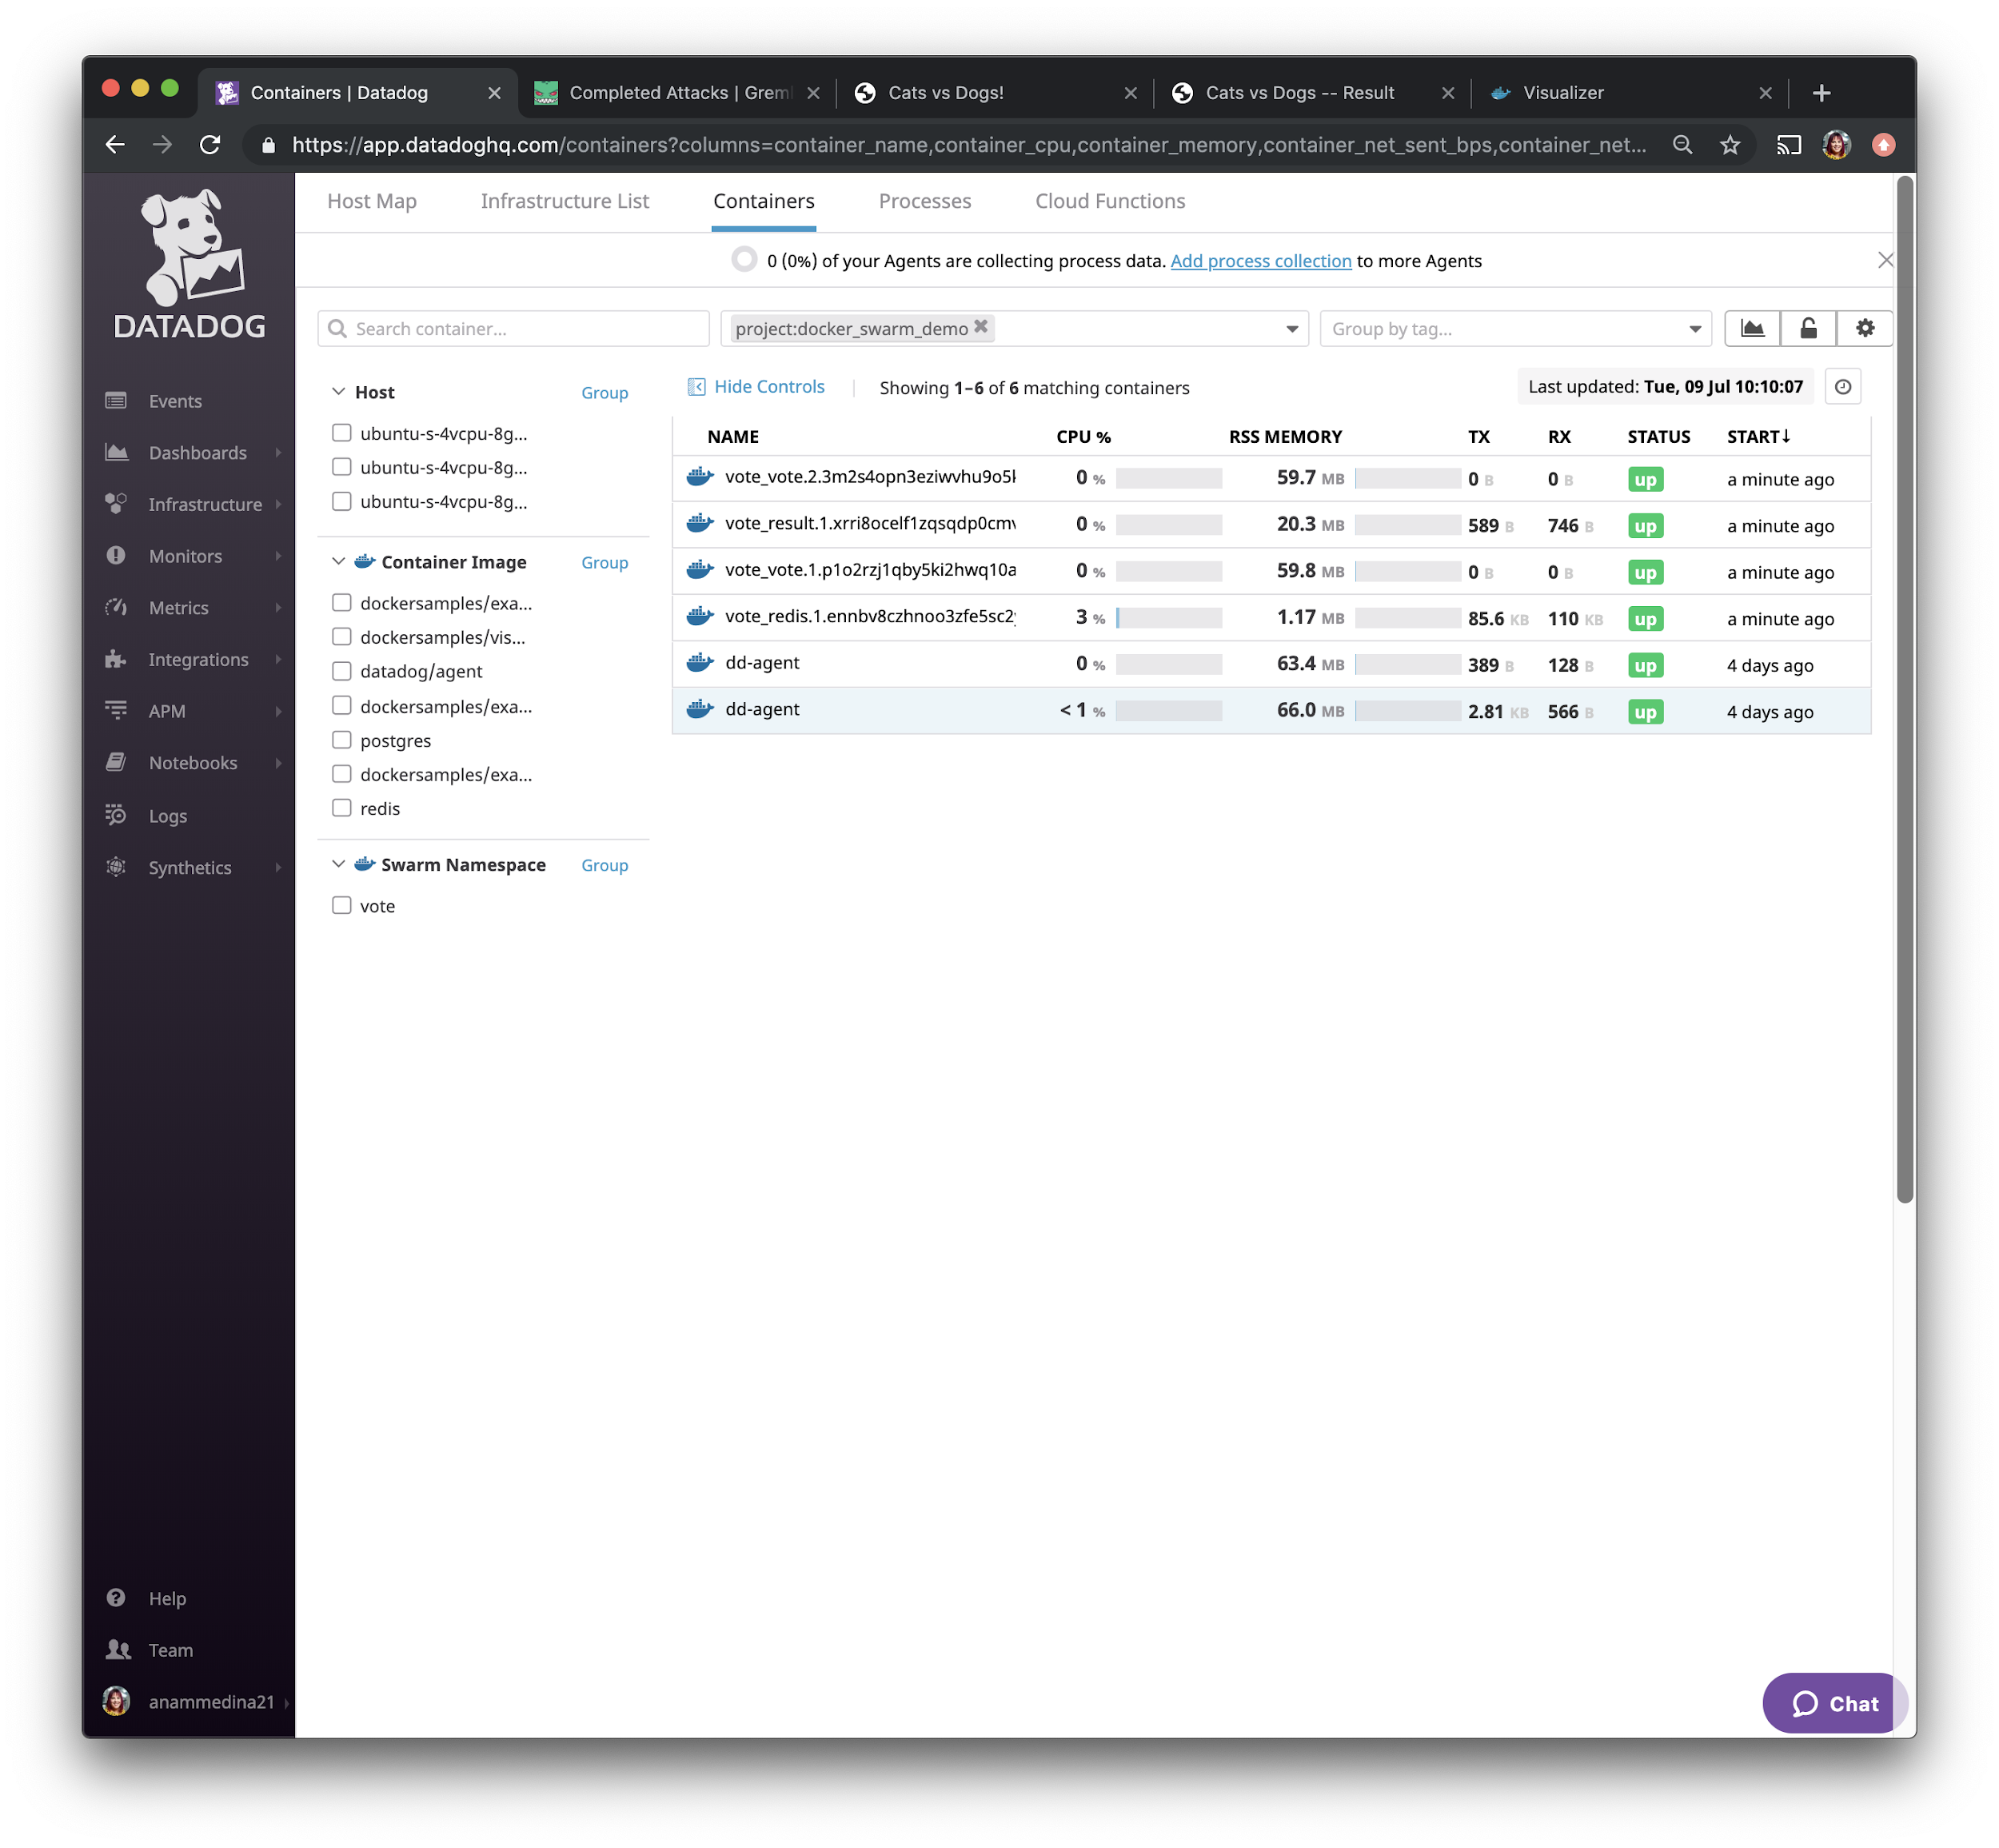
Running exercises like these is great practice for making sure your applications can withstand failure, and that your monitoring is set up correctly.
Conclusion
Congrats! You’ve now learned how to:
- Set up a web application on three hosts using Docker Swarm,
- Monitor containers using Datadog, and
- Use Gremlin to test the resilience of your application.
As a next step, setup PagerDuty Alerts for this application and verify they are working by using the same Chaos Engineering practices you just learned. If you have any questions at all or are wondering what else you can do with this demo environment, feel free to reach out on the Chaos Community Slack(join here)!
Avoid downtime. Use Gremlin to turn failure into resilience.
Gremlin empowers you to proactively root out failure before it causes downtime. See how you can harness chaos to build resilient systems by requesting a demo of Gremlin.

.svg)