Chaos Engineering for PagerDuty Alerts


.svg)
.svg)

 This is an older tutorial
Introduction
PagerDuty offers a platform designed to alert folks of disruptions and outages on their systems and services. Datadog is a monitoring service for cloud-scale applications. Gremlin is a simple, safe and secure service for performing Chaos Engineering experiments through a SaaS-based platform.
Prerequisites
Before you begin this tutorial, you’ll need the following:
- A PagerDuty account (sign up here)
- A Datadog account (sign up here)
- A Gremlin account (request a free trial here)
- A host running Ubuntu 18.04 to run the Chaos Engineering experiments on. This host will run the Gremlin agent. You need to have permissions to run commands as root with sudo on this host.
Step 1 - Install Gremlin
First, ssh into your host and add the Gremlin repo:
Import the GPG key:
Install the Gremlin agent and daemon:
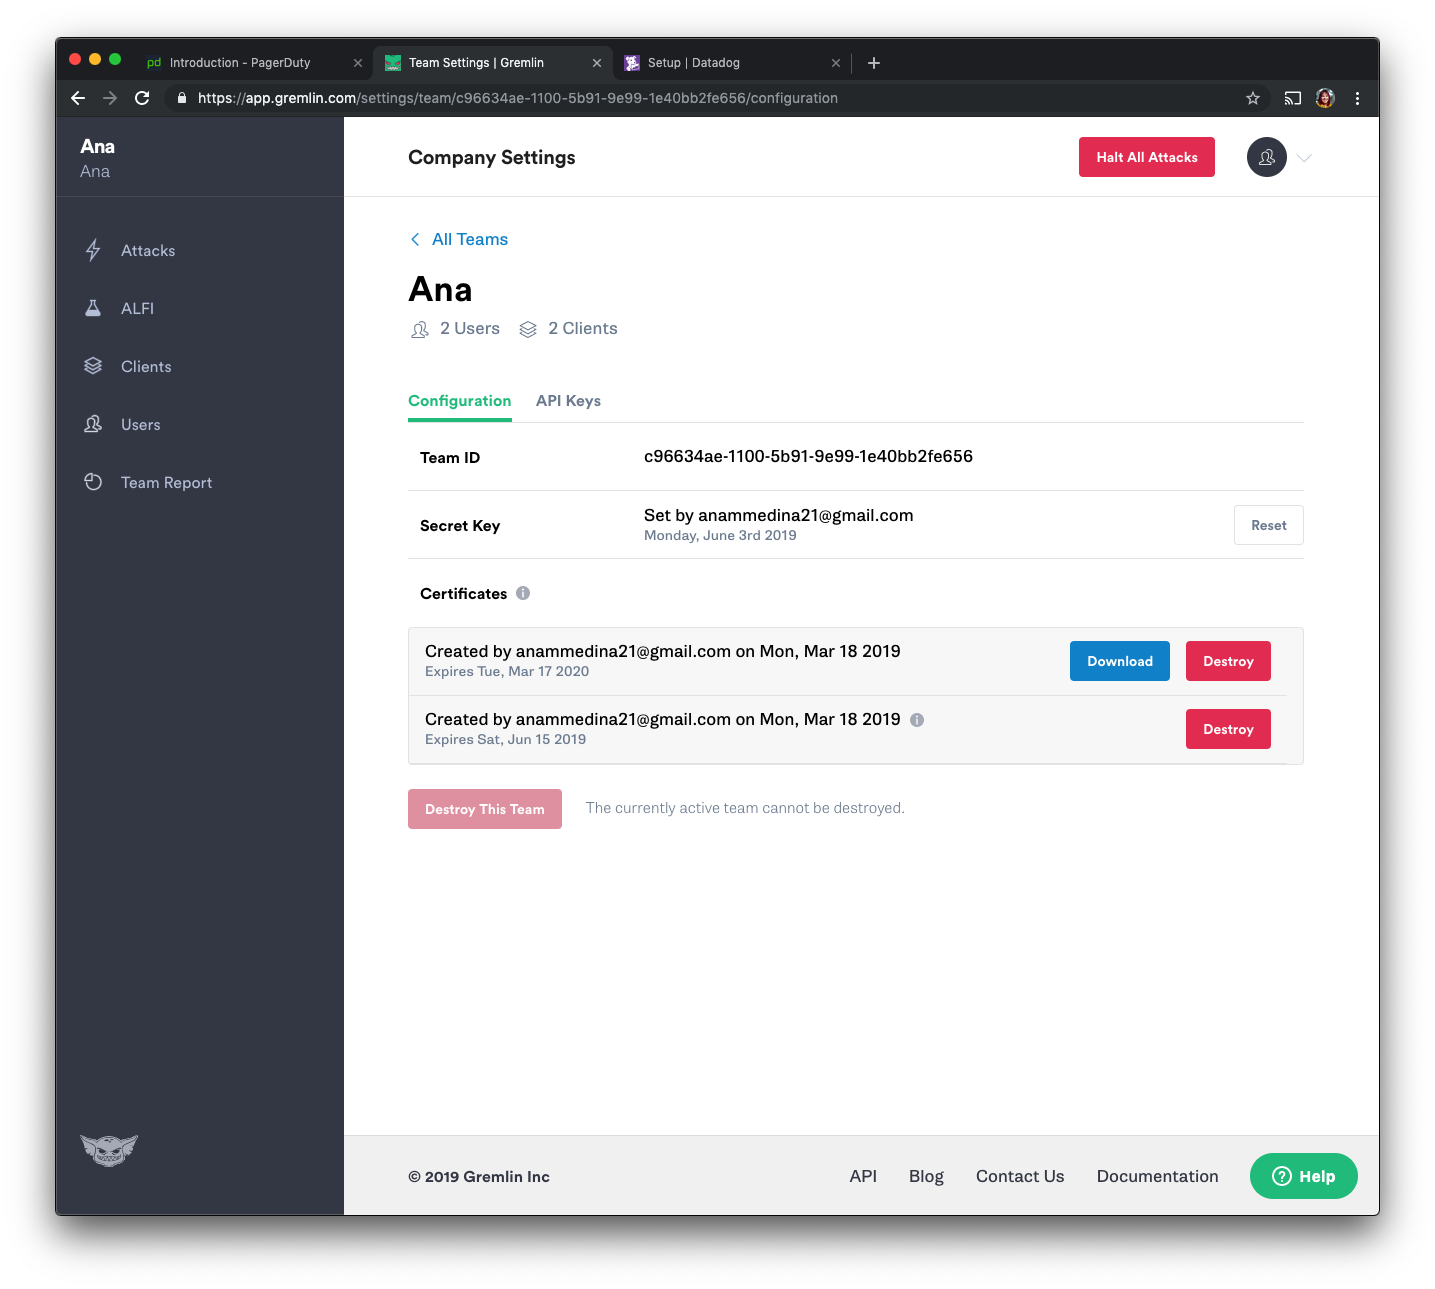
First, make sure you have a Gremlin account (sign up here). Then, we will grab the credentials needed to authenticate the agent we just installed. Log in to the Gremlin App using your Company name and sign-on credentials. (These were emailed to you when you signed up to start using Gremlin.) Click on the right corner circular avatar, selecting “Company Settings”.

Then, select the team you need. The ID you’re looking for is found under Configuration as “Team ID” click on your Team. Make a note of your Gremlin Secret and Gremlin Team ID.
Now, we will initialize Gremlin and follow the prompts.
Use the credentials you have saved from the last step.
Step 2 - Install Datadog
We are going to continue by setting up Datadog (sign up here).
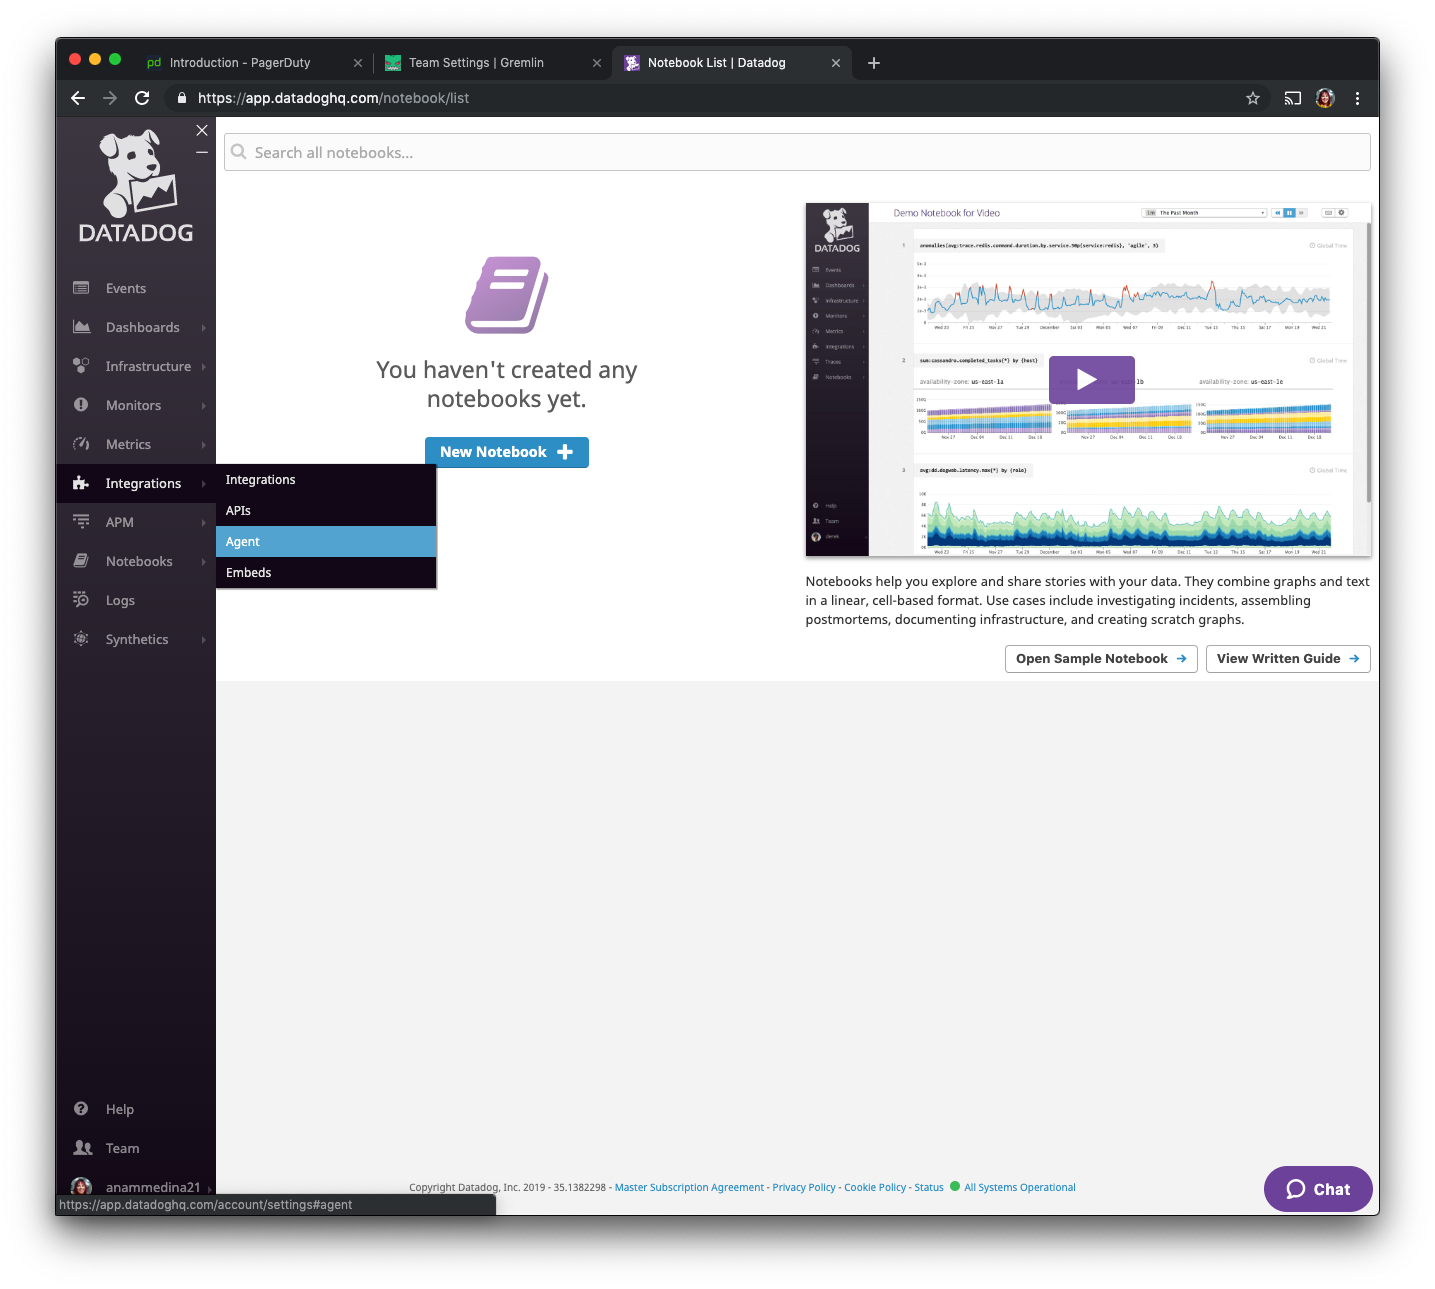
After creating an account, on the left side go over to “Integrations’, and select “Agent”.
We will now select Ubuntu from the options, and install using the instructions under “Use our easy one-step install.”
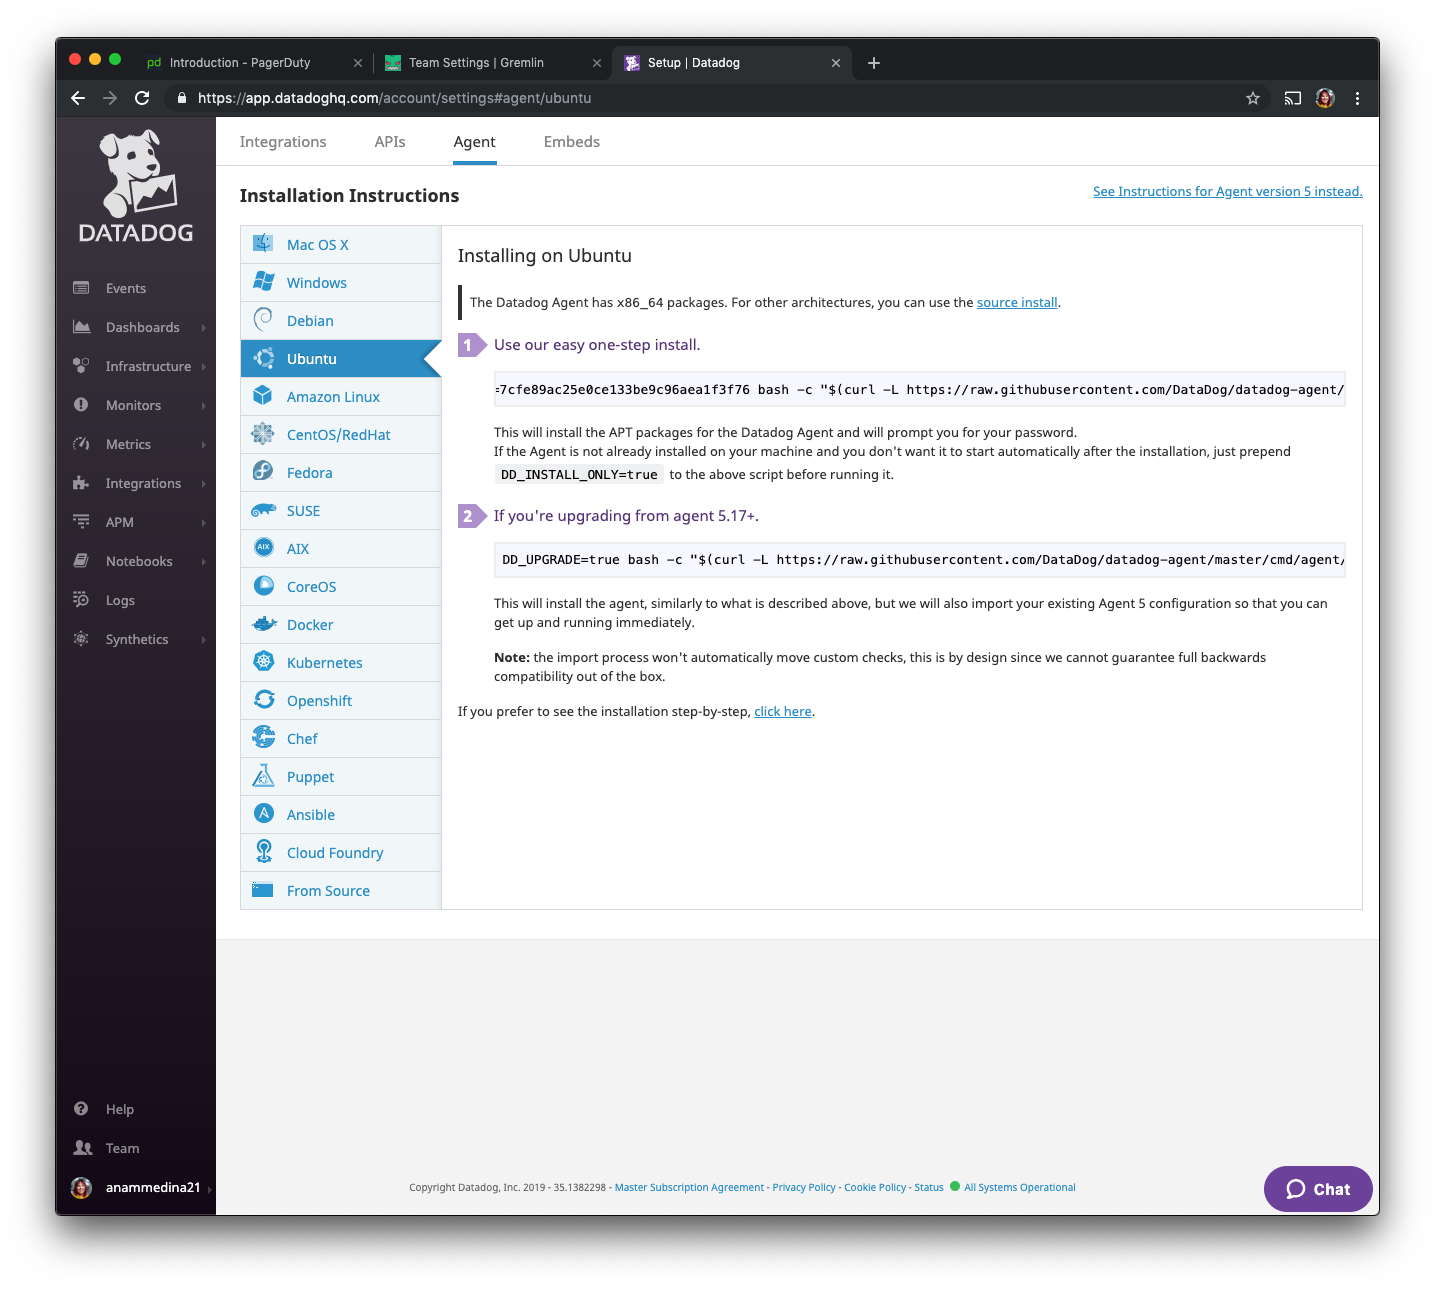
Going back to your hosts, install the Datadog agent:
On the Datadog web UI, use the navigation bar to go to the infrastructure list. After finding the host you’re looking for, select “inspect” and add a tag: <span class="code-class-custom">env:chaos-community</span> . We will use this tag to create a monitor that only looks at hosts with that tag.
Step 3 - Create a monitor using Datadog
Now that we have Datadog installed on our hosts with tags, we want to create a monitor. A monitor is how Datadog notifies us when certain conditions are met. We will go back to the left navigation menu, select Monitors and choose “New Monitor”.
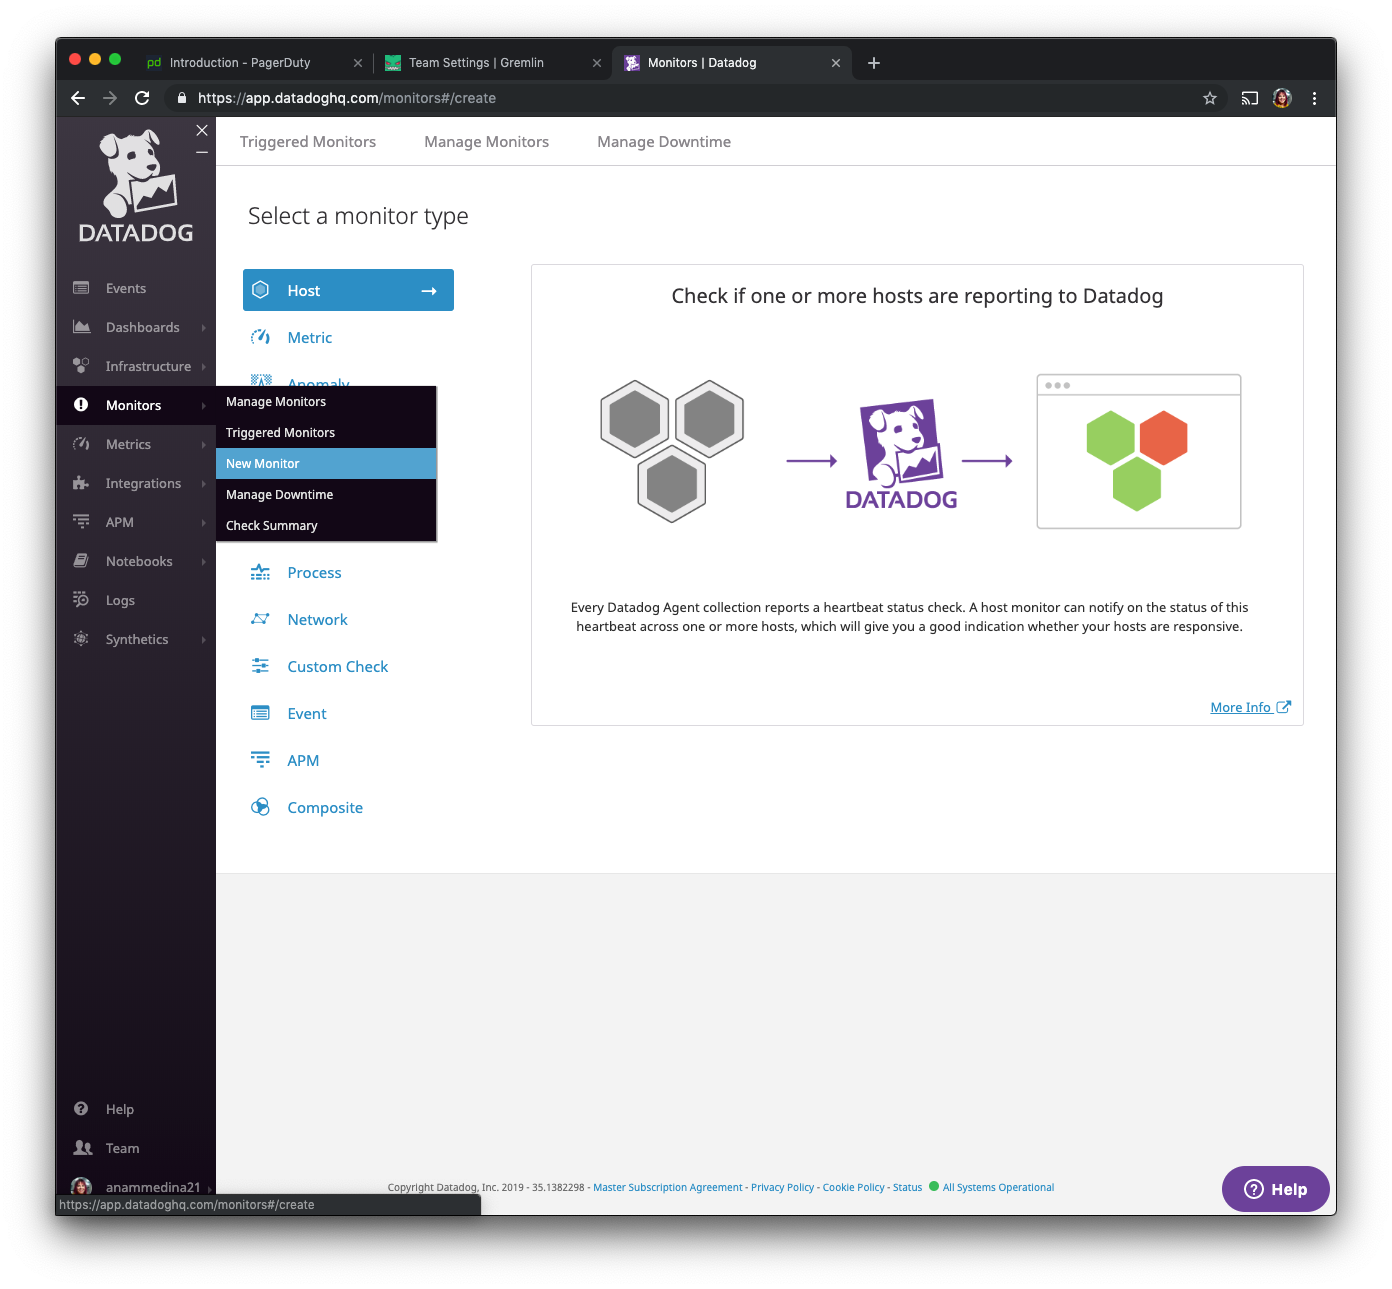
We will be selecting “metric” from the given options.
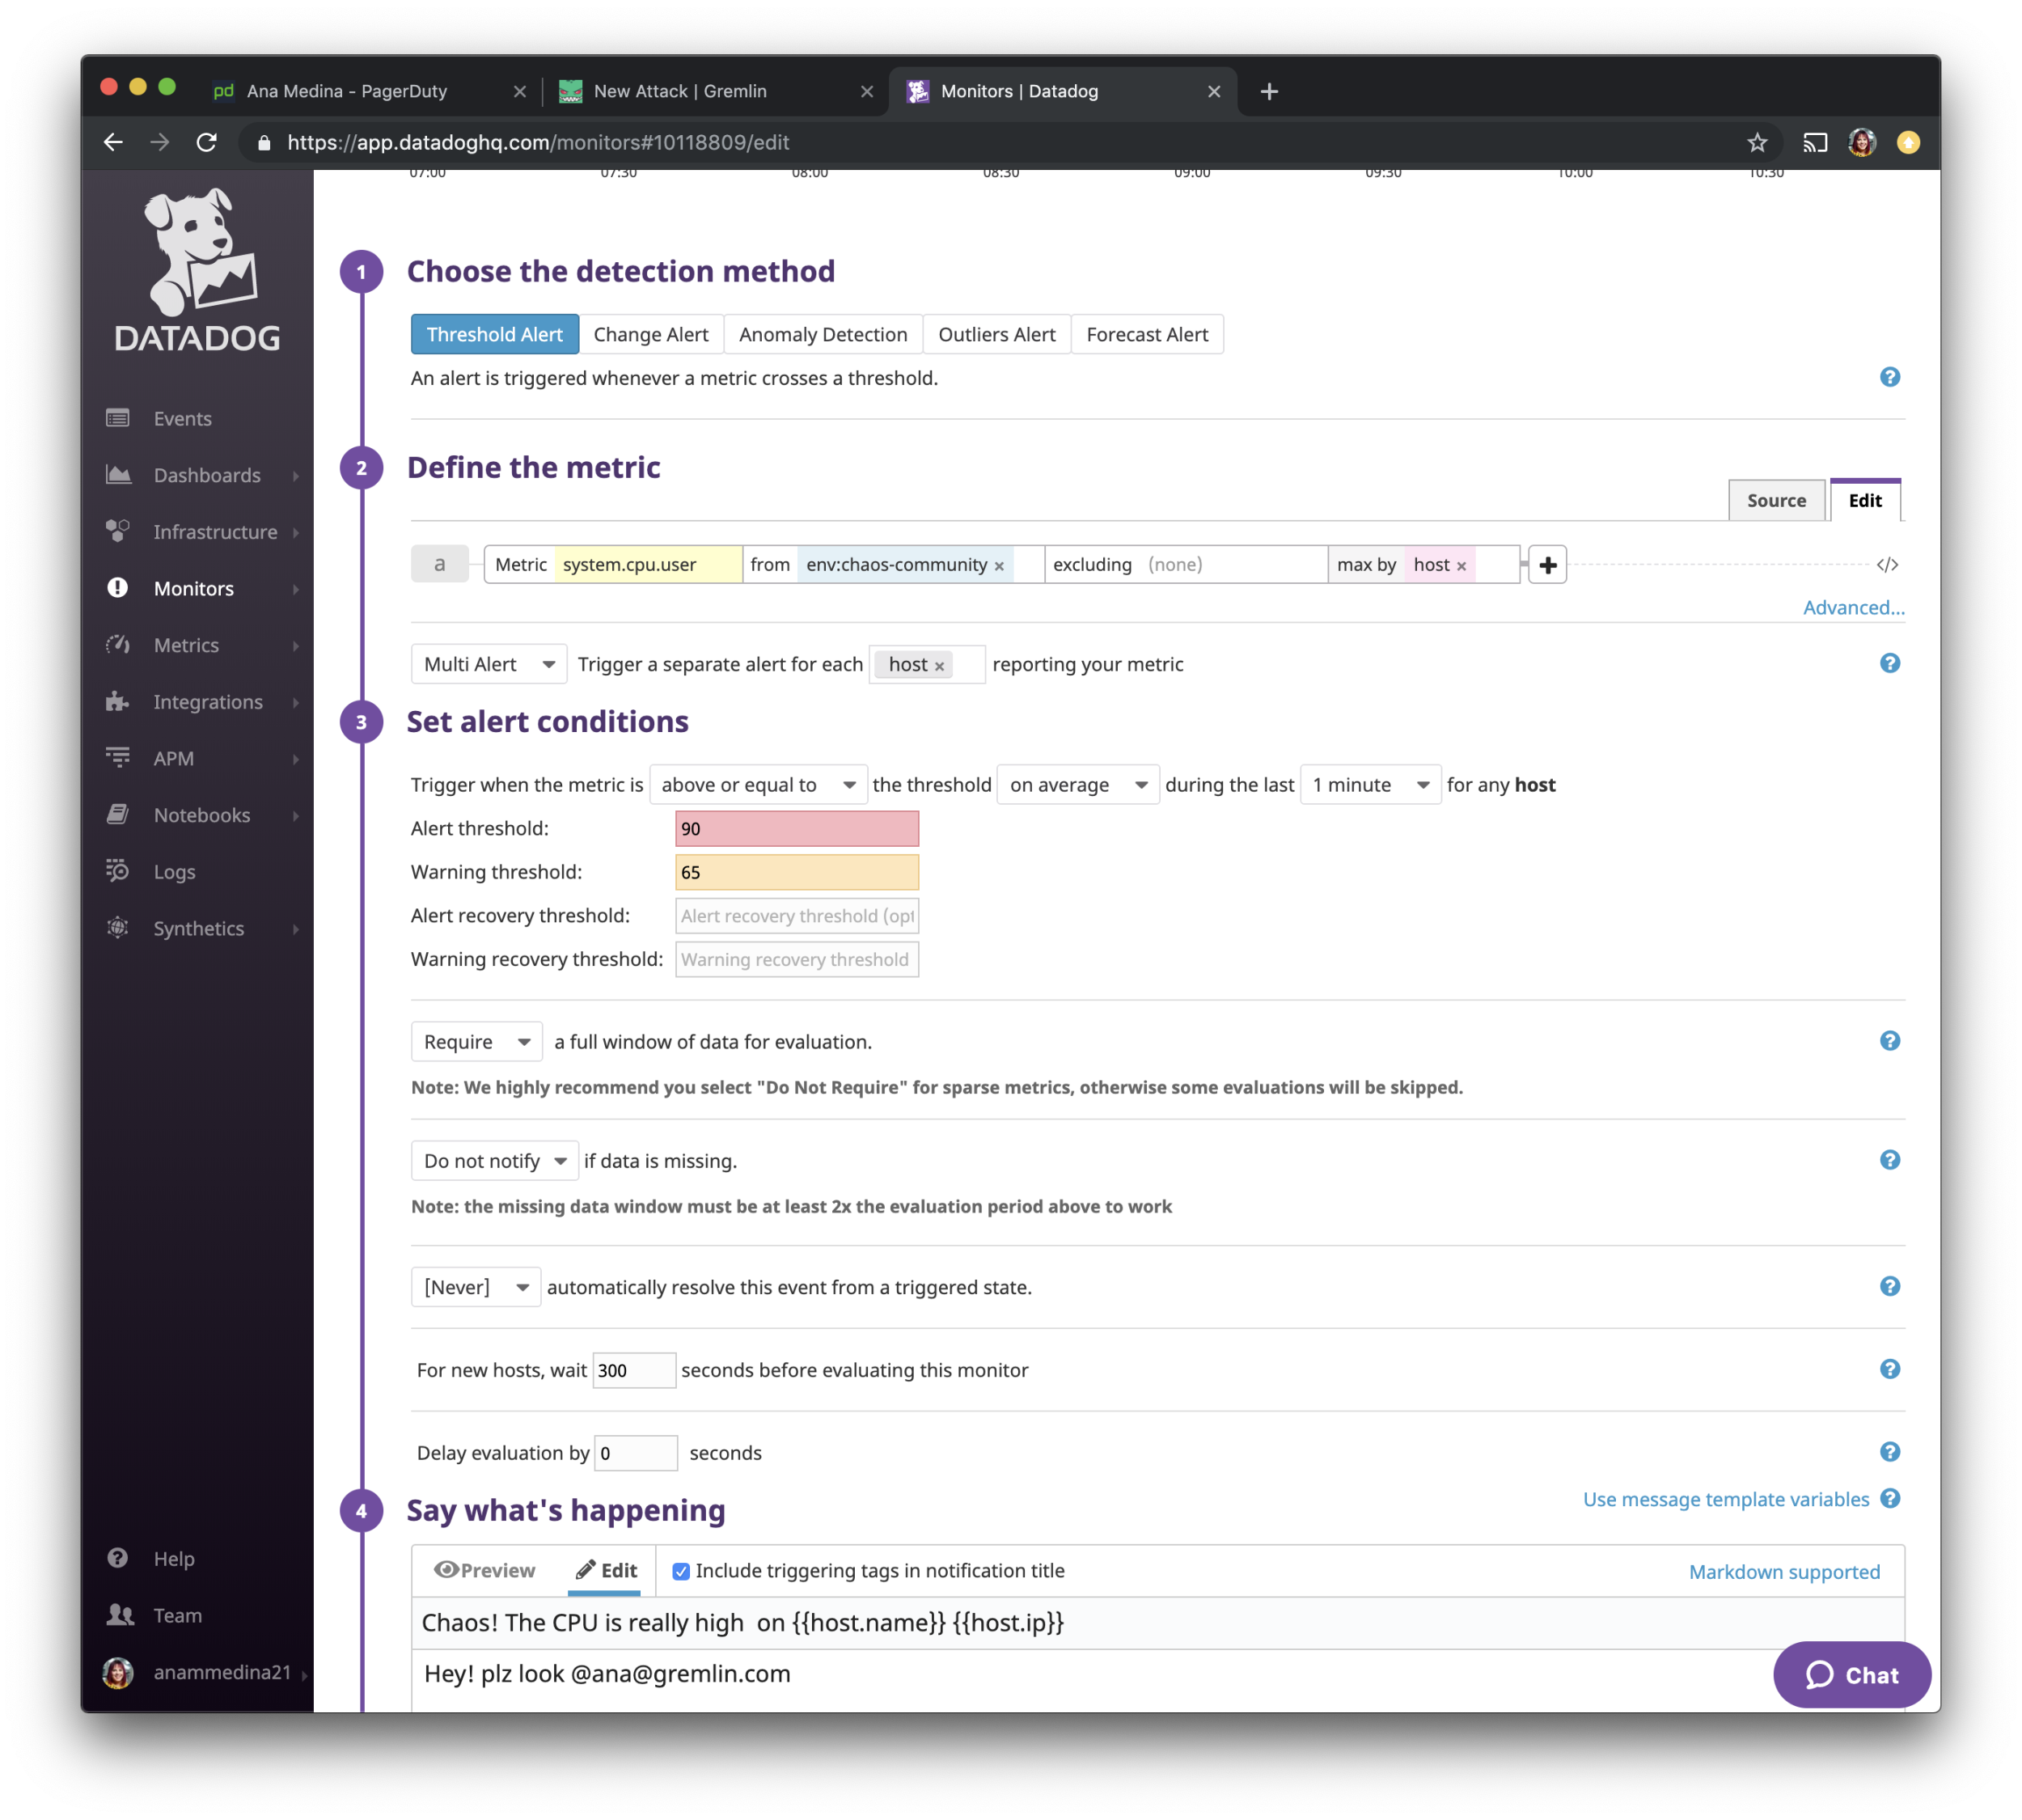
We will define the metric, as system.cpu.user from <span class="code-class-custom">env:chaos-community</span> .
We are also going to make the warning threshold: 65, and Alert threshold: 90. When the average of the CPU resources goes above 65% usage during the last 1 minutes one should get warning notification.
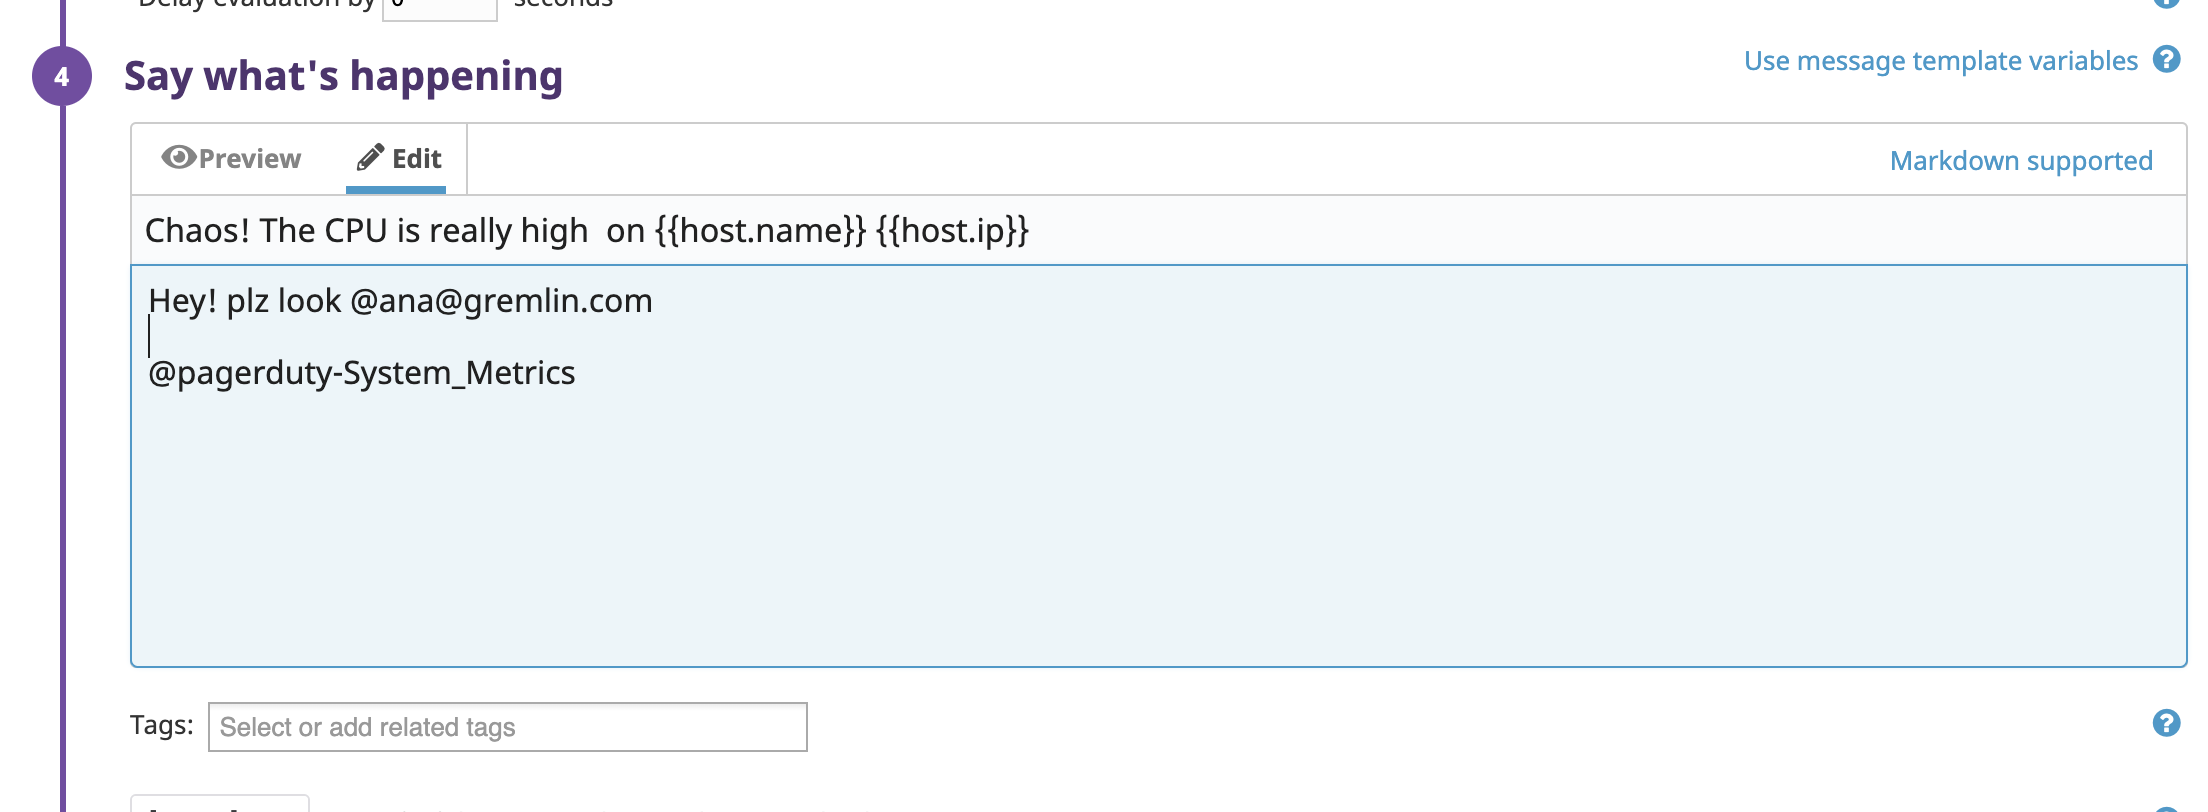
On “Say what’s happening”, we get to edit the notification we receive. I have made the subject of the email to be “Chaos! The CPU is really high on {{host.name}} {{host.ip}}.” Then on the body of the notification I've added some extra wording and by using<span class="code-class-custom"> @ana@gremlin.com</span> I’ve asked it to email me with the notification.
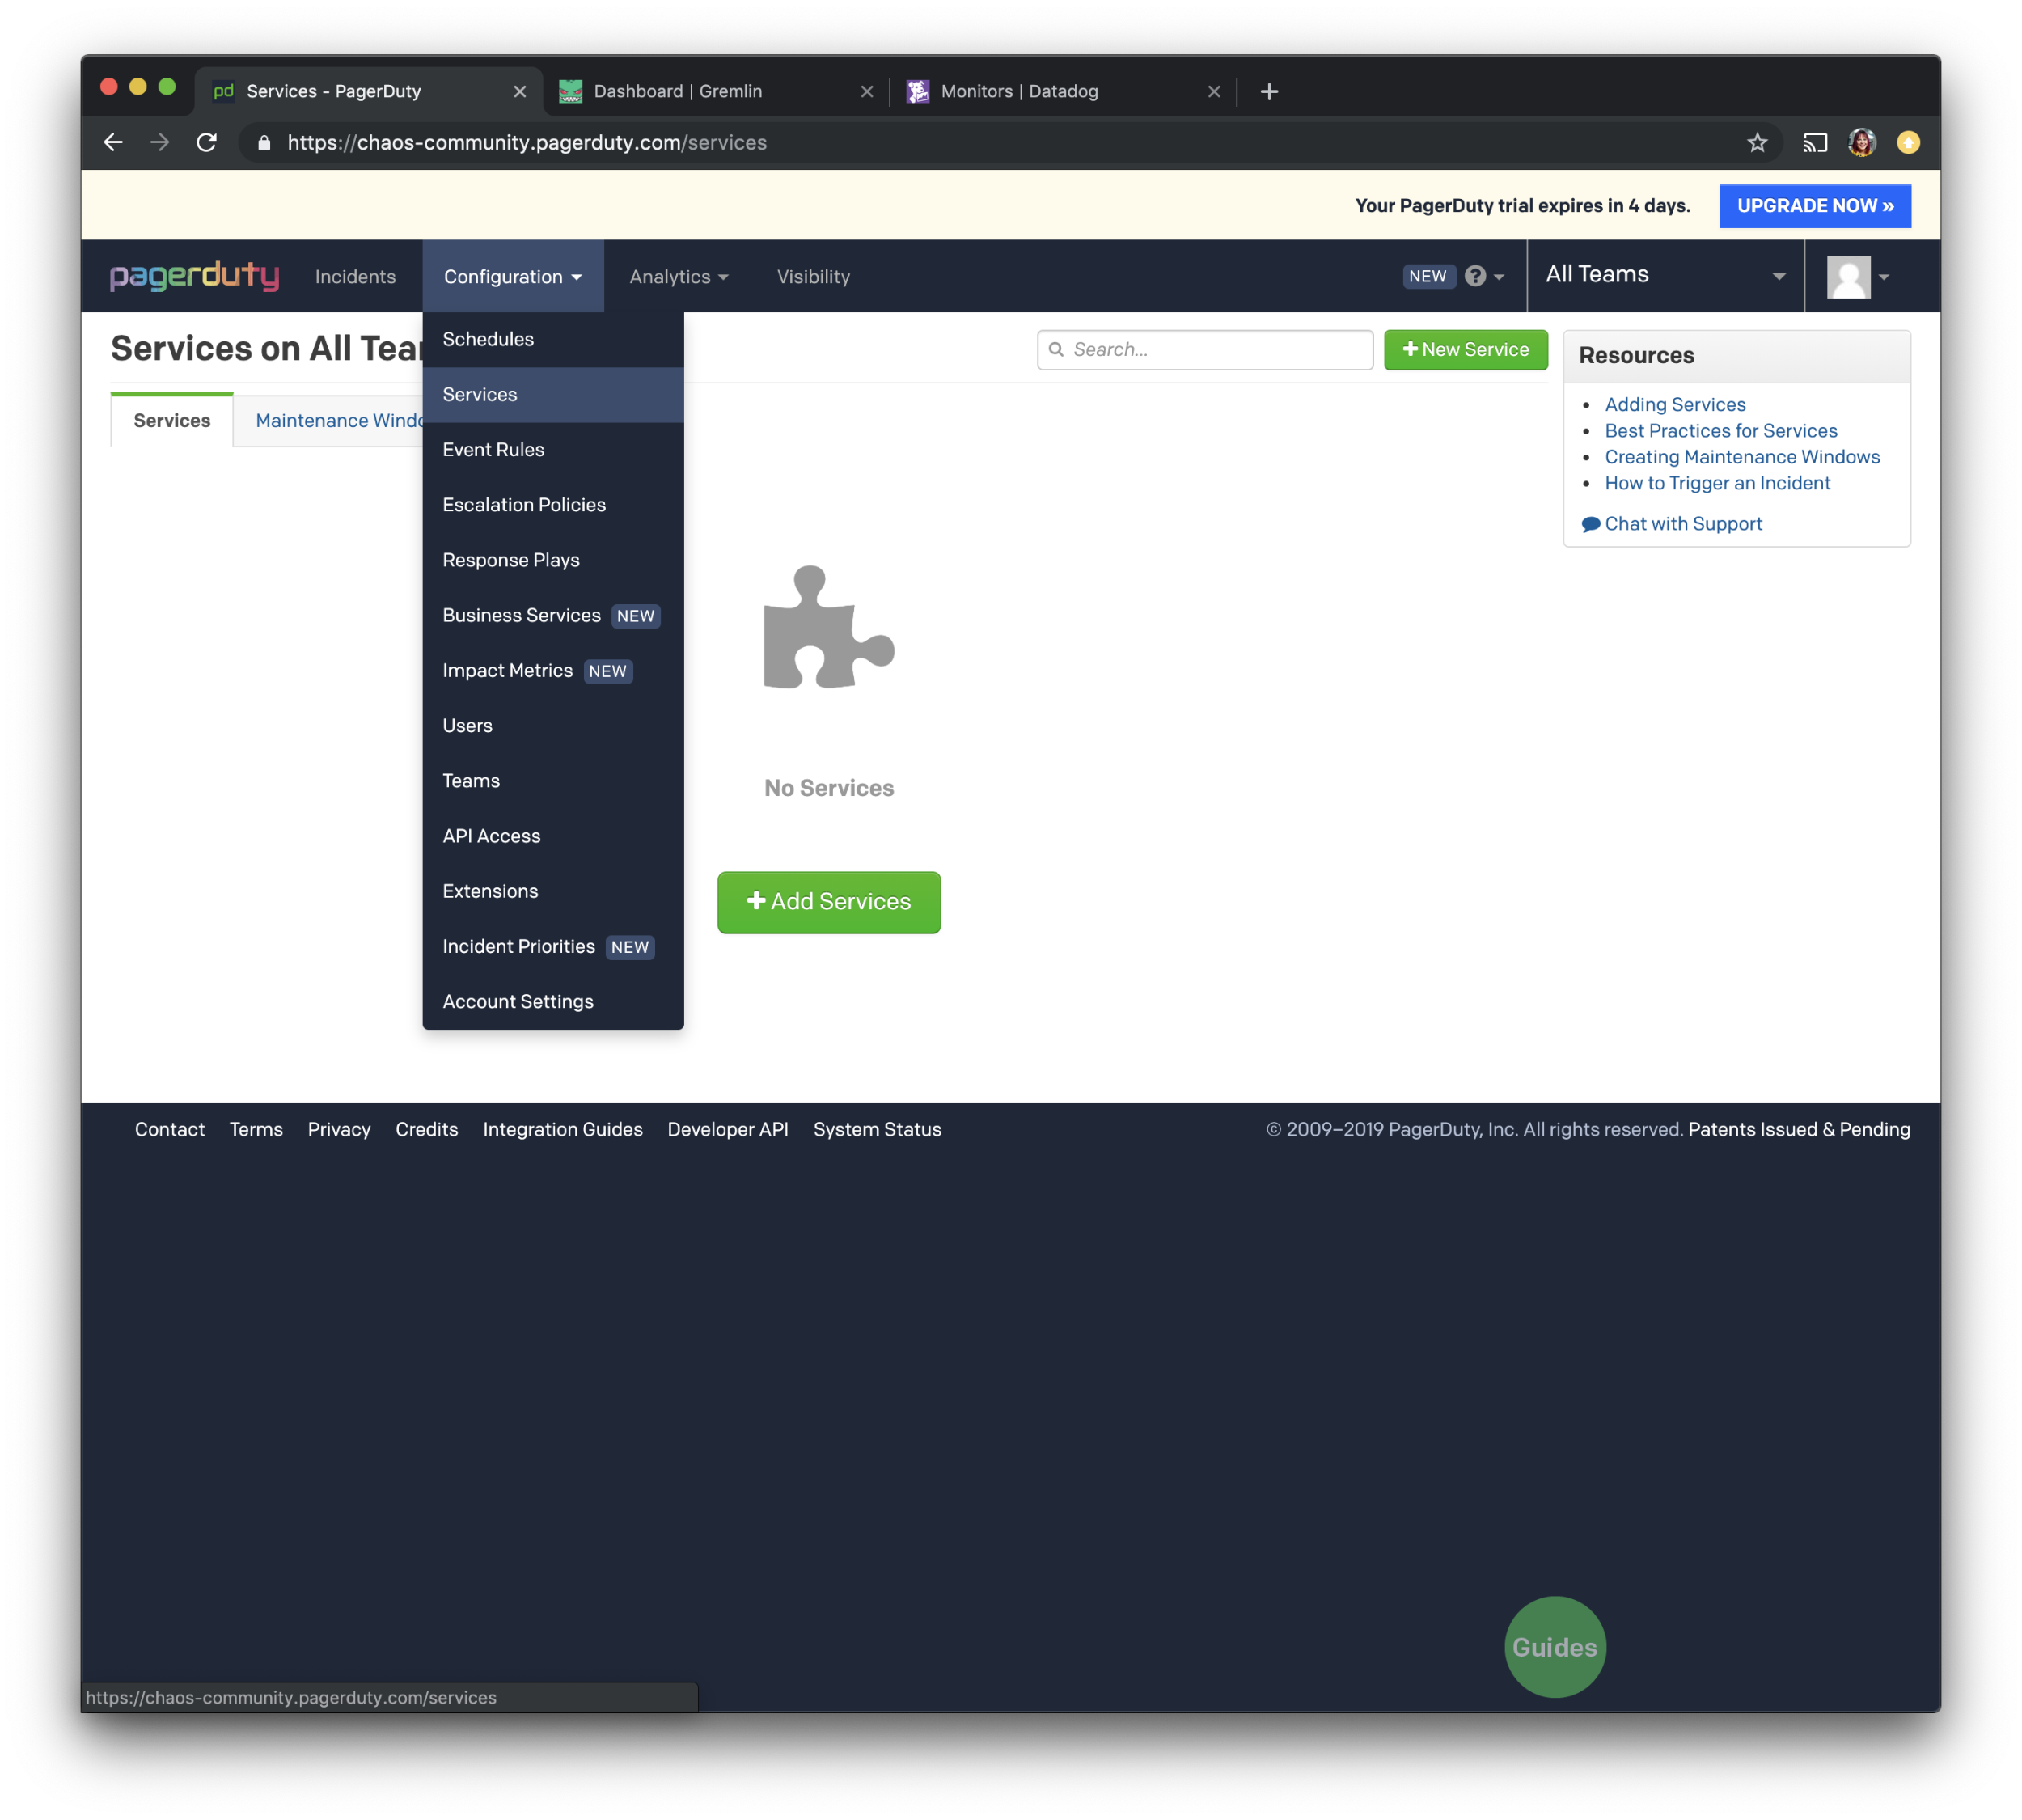
Step 4 - Connect PagerDuty to Datadog
First, you’ll create an account with PagerDuty and log in (sign up here). Then, we will go over to the top navigation bar, and on “Configuration”, we will be selecting “Services”.
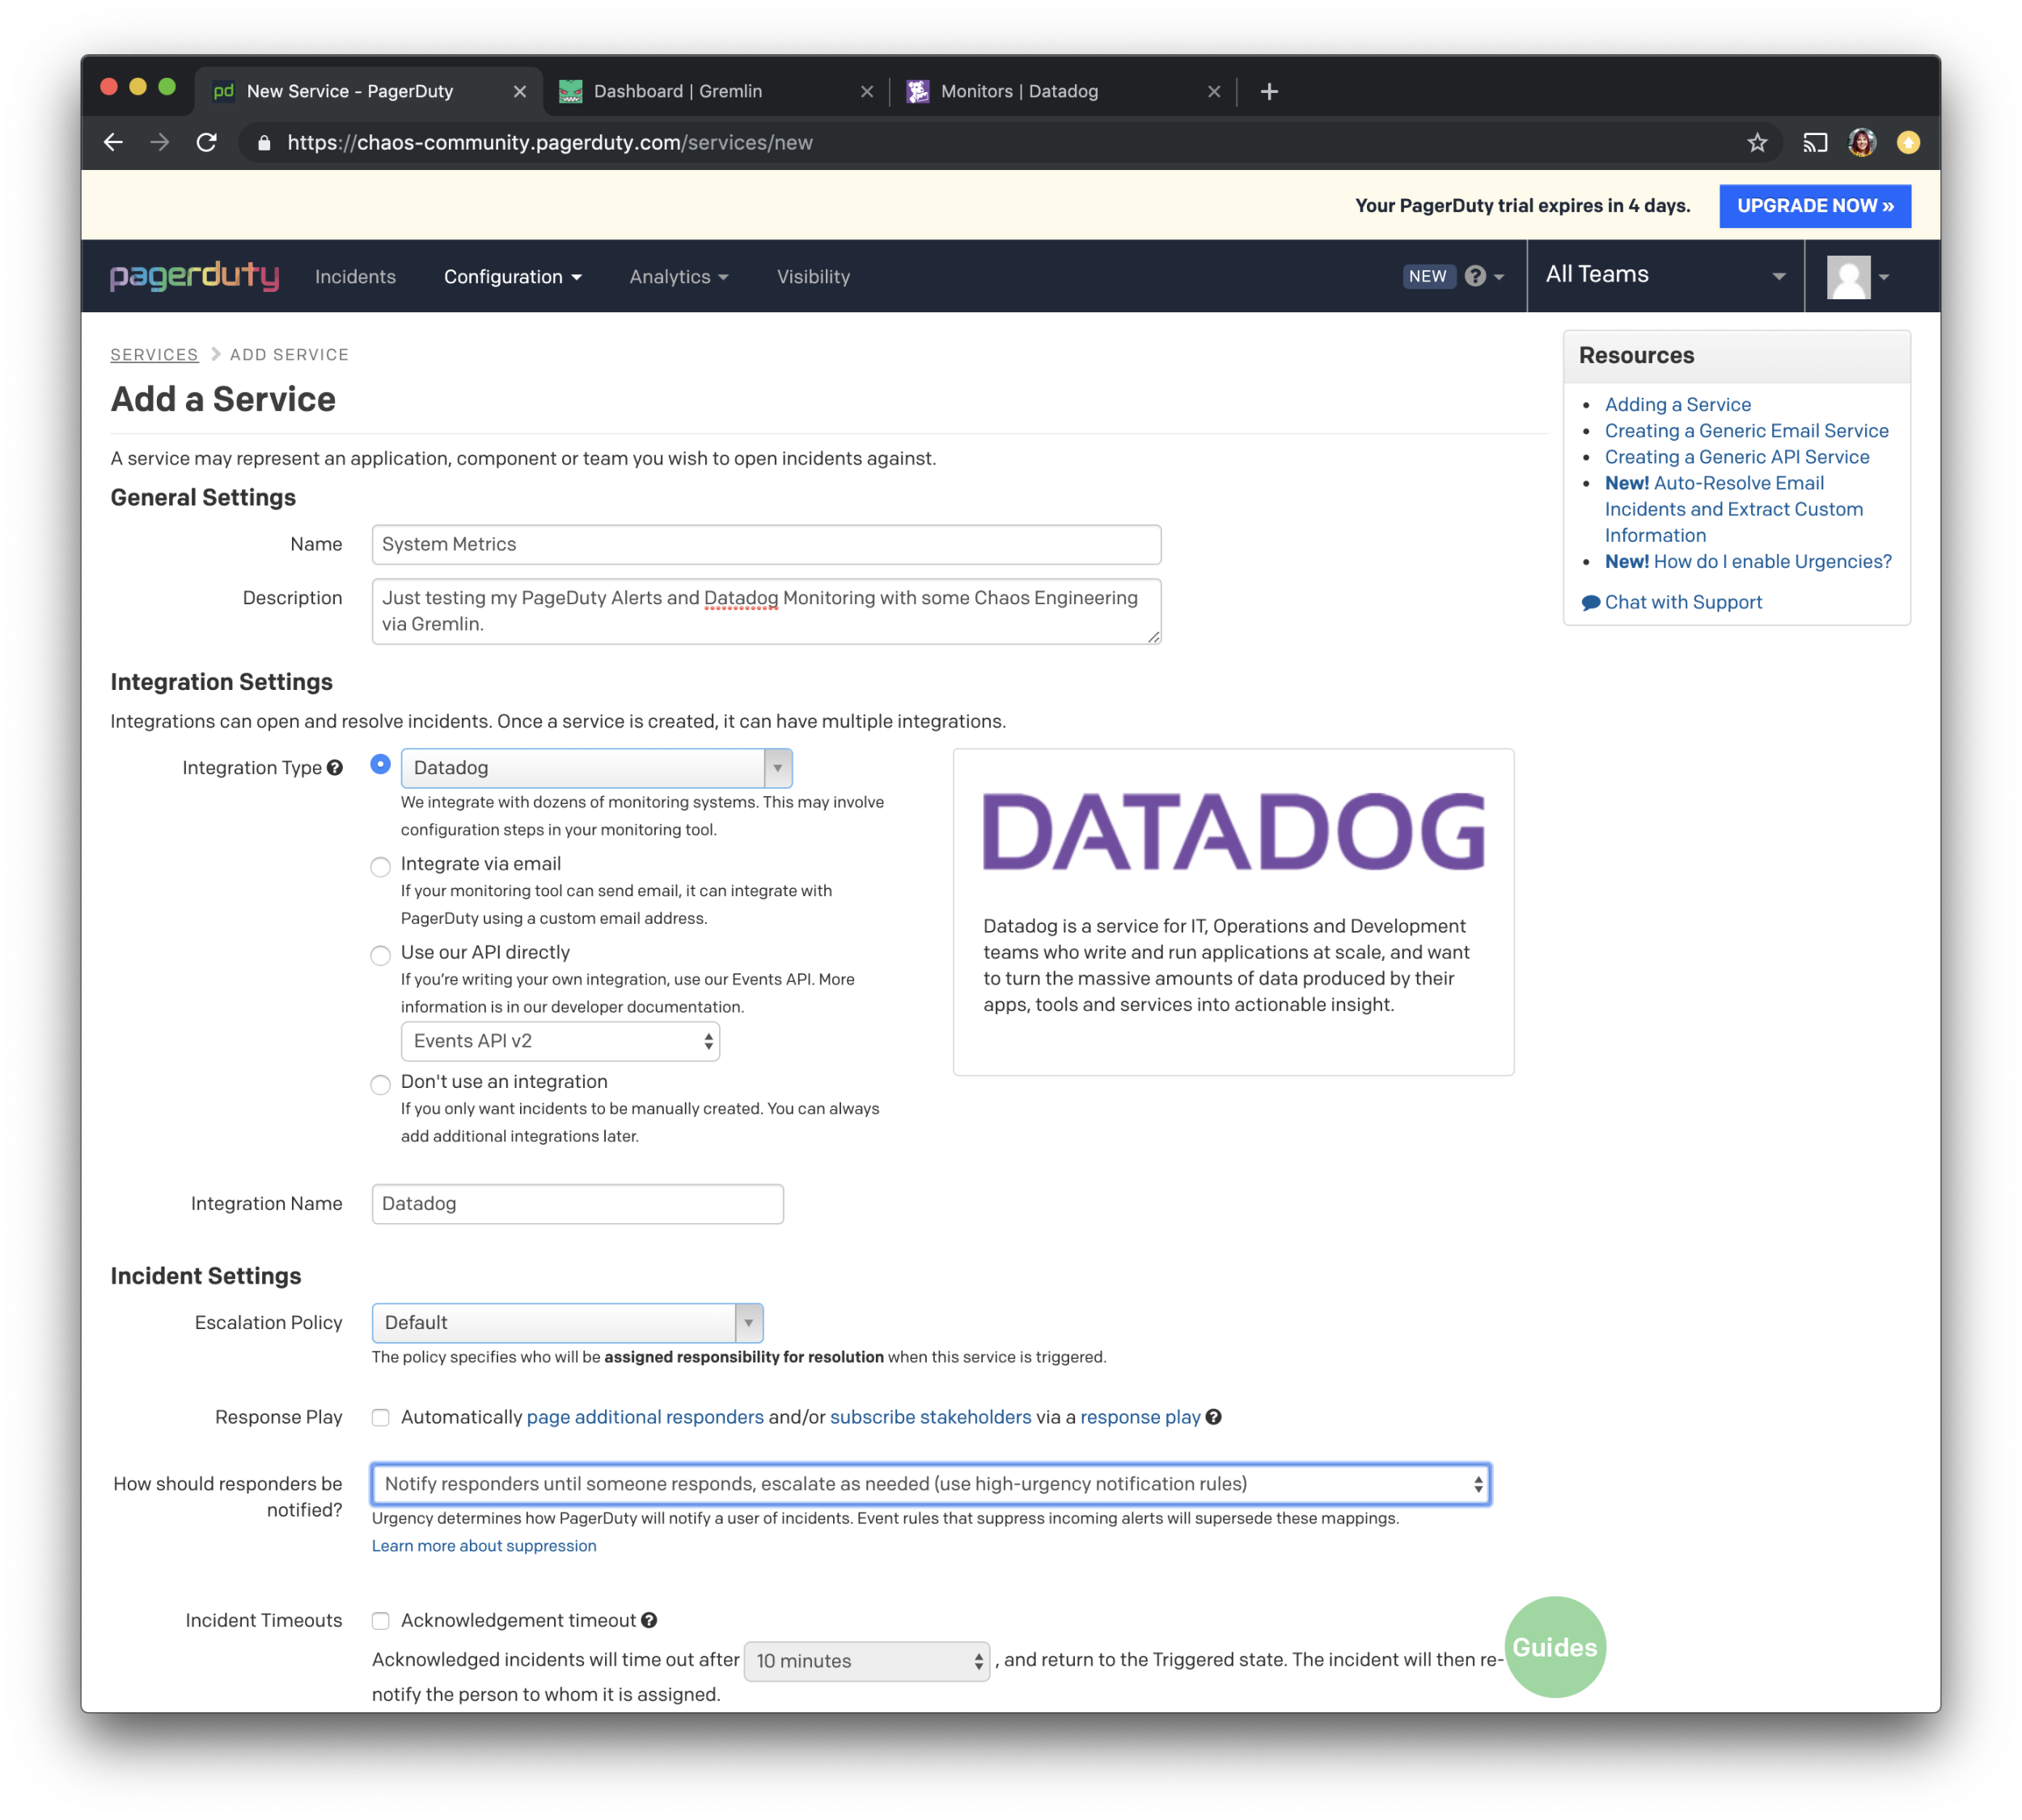
Give the Service a name and description. For this example, I will be using “System Metrics”. Make sure to select the first radio button that says “Integration Type” and choose “Datadog” from the list. A default escalation policy has been created for you when you created the account, we will be using that for this tutorial. Feel free to leave the default settings for the rest and make sure to save the information by pressing the green “Add Service” button.
Now that you’ve created the service you need, we will go back to Datadog and on the left navigation bar select “Integrations” and then search for “PagerDuty” from the list by pressing the “Install” button.
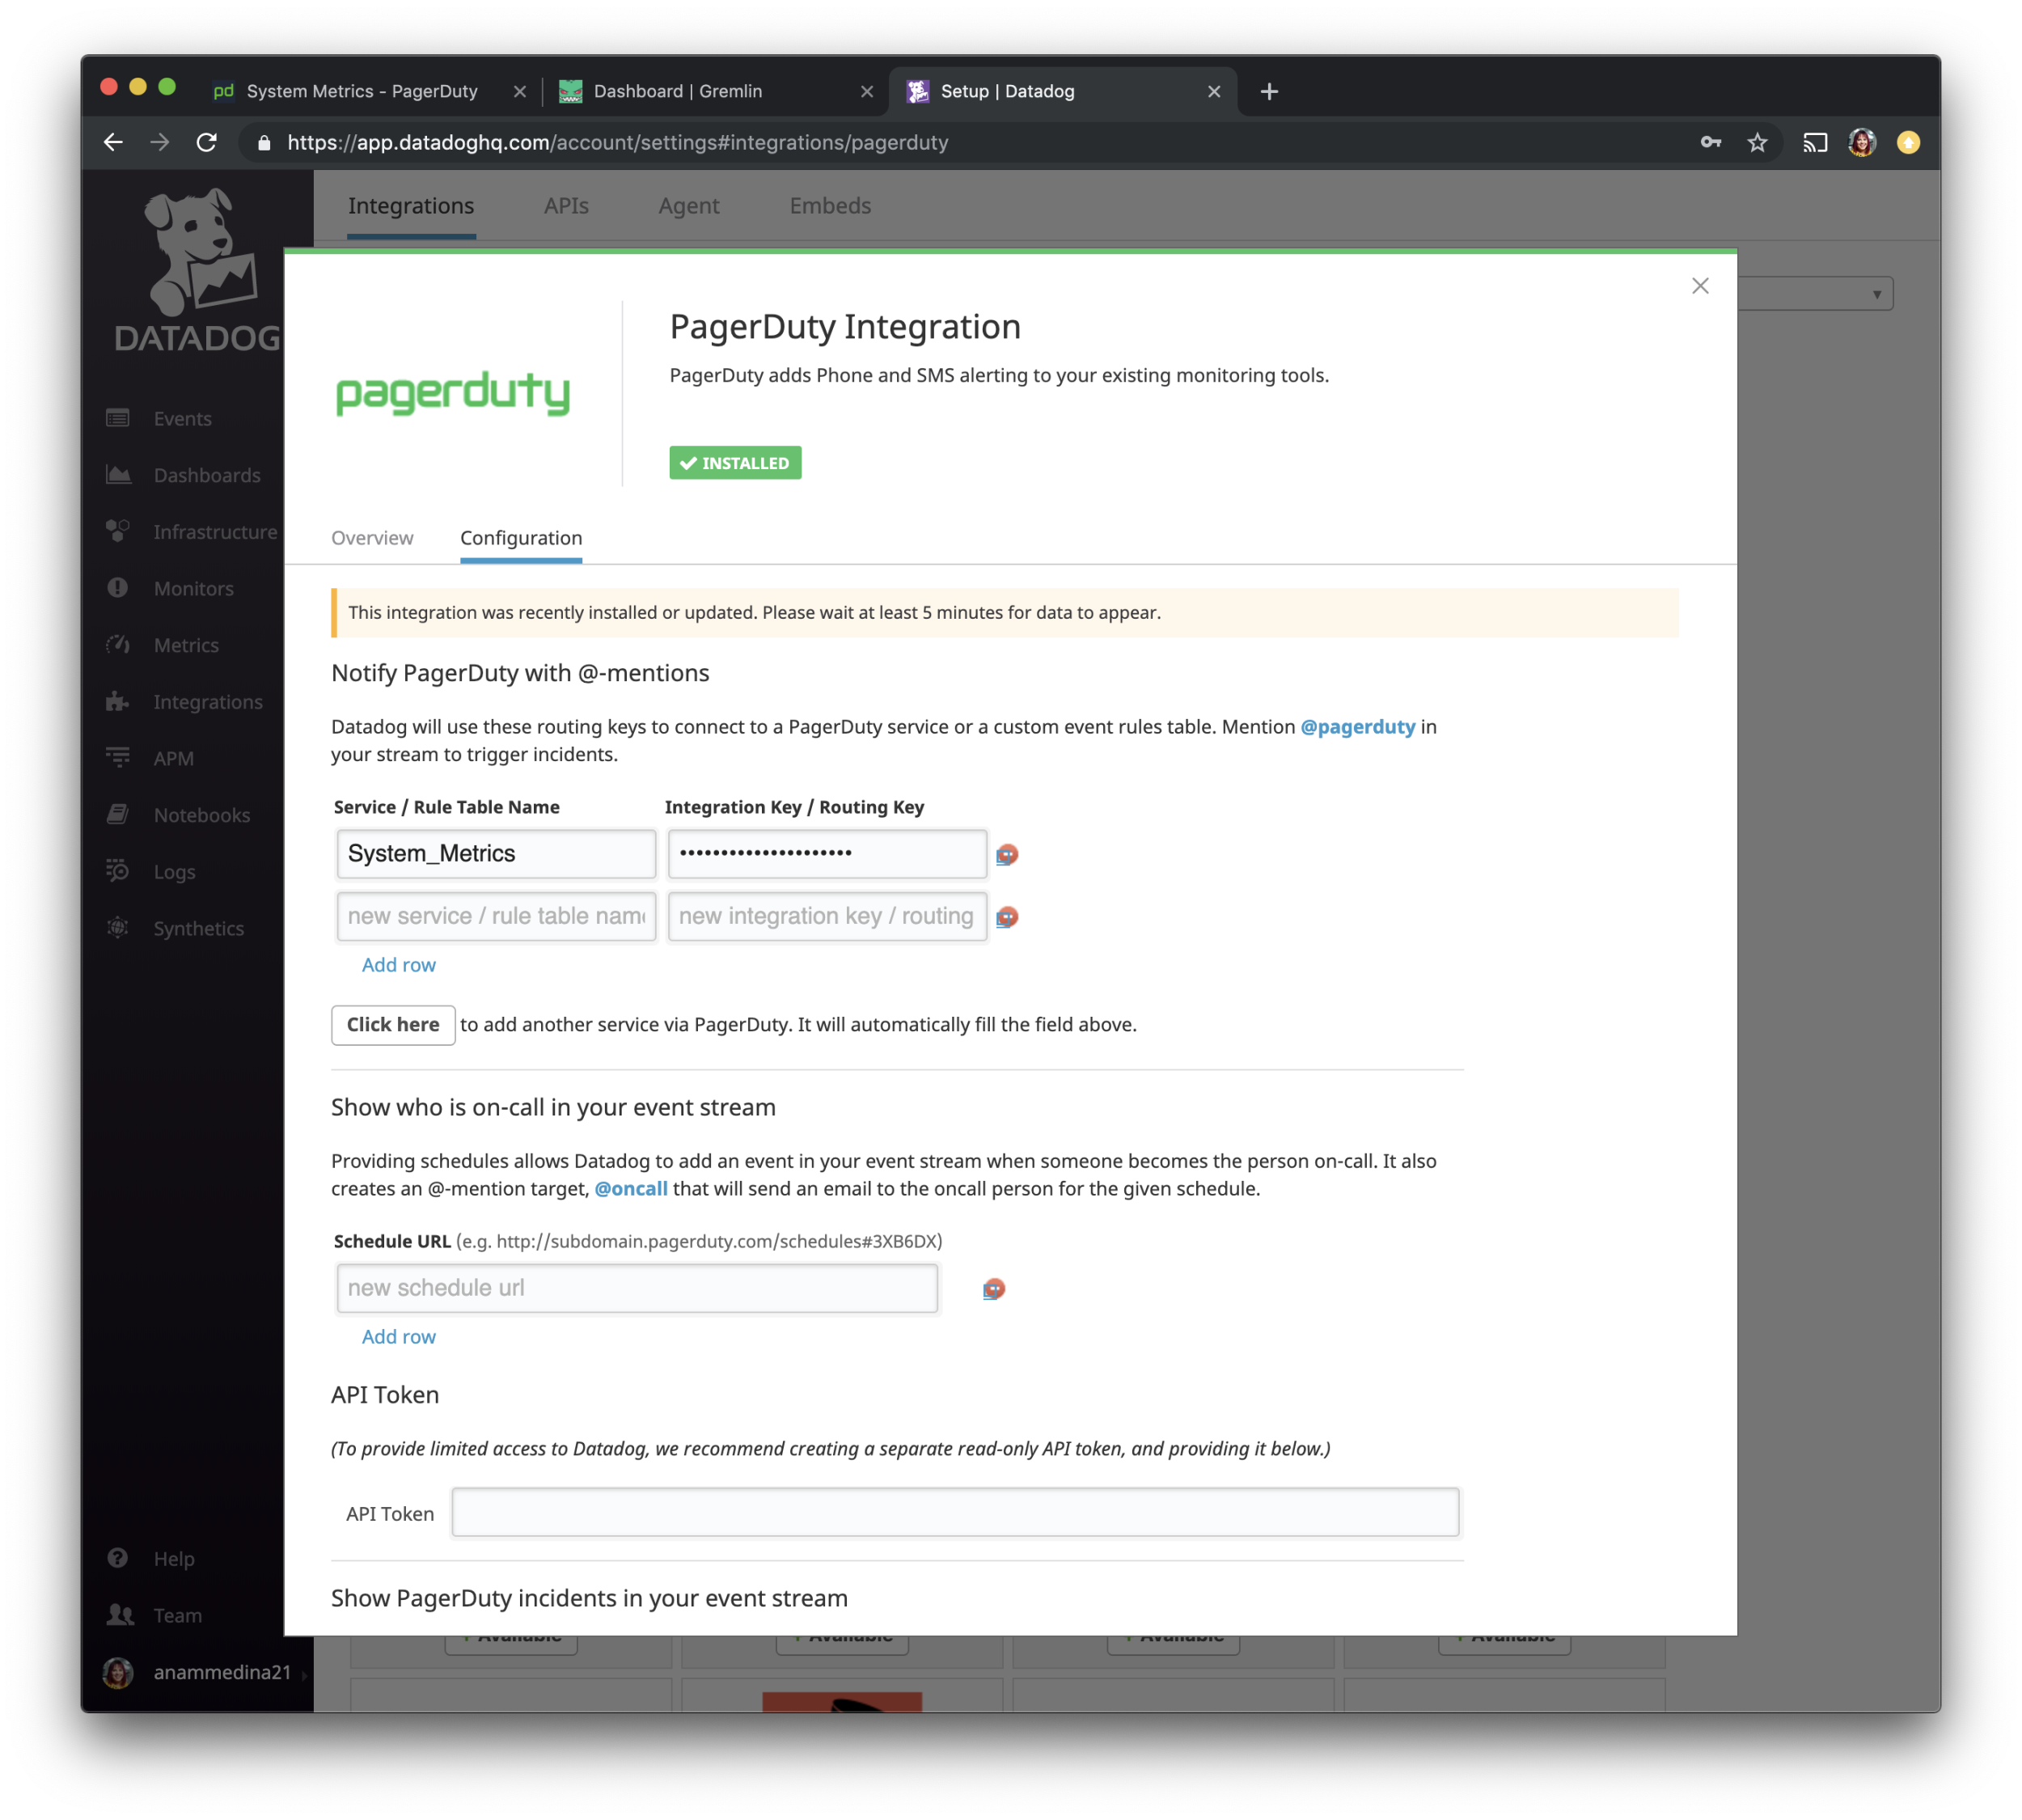
A pop up will display all the settings for the configuration. The Service Name and Integration key will be pre-filled for you and no action is needed.
We will now go back to the Datadog and edit the monitor we configured. Apart from it sending an email notifying us of the CPU spike, we want it to also ping the PagerDuty service we just configured, we will do that by adding<span class="code-class-custom"> @pagerduty-System_Metrics</span> to our Monitor message.
Step 5 - Run a CPU Attack using Gremlin
Do you think you’ve configured it properly? Let’s find out by running a Chaos Engineering experiment!
We are going to create our first Chaos Engineering experiment. We want to validate that we have configured our Monitoring and Paging properly and that they will alert us when a CPU spike affects us for more than a minute. Our hypothesis is, “When we consume CPU resources, our monitoring tool, Datadog, will help up alert our paging tool, PagerDuty.”
Going back to the Gremlin UI, select Attacks from the menu on the left and press the green “New Attack” button. We will be choosing the four hosts from the list.
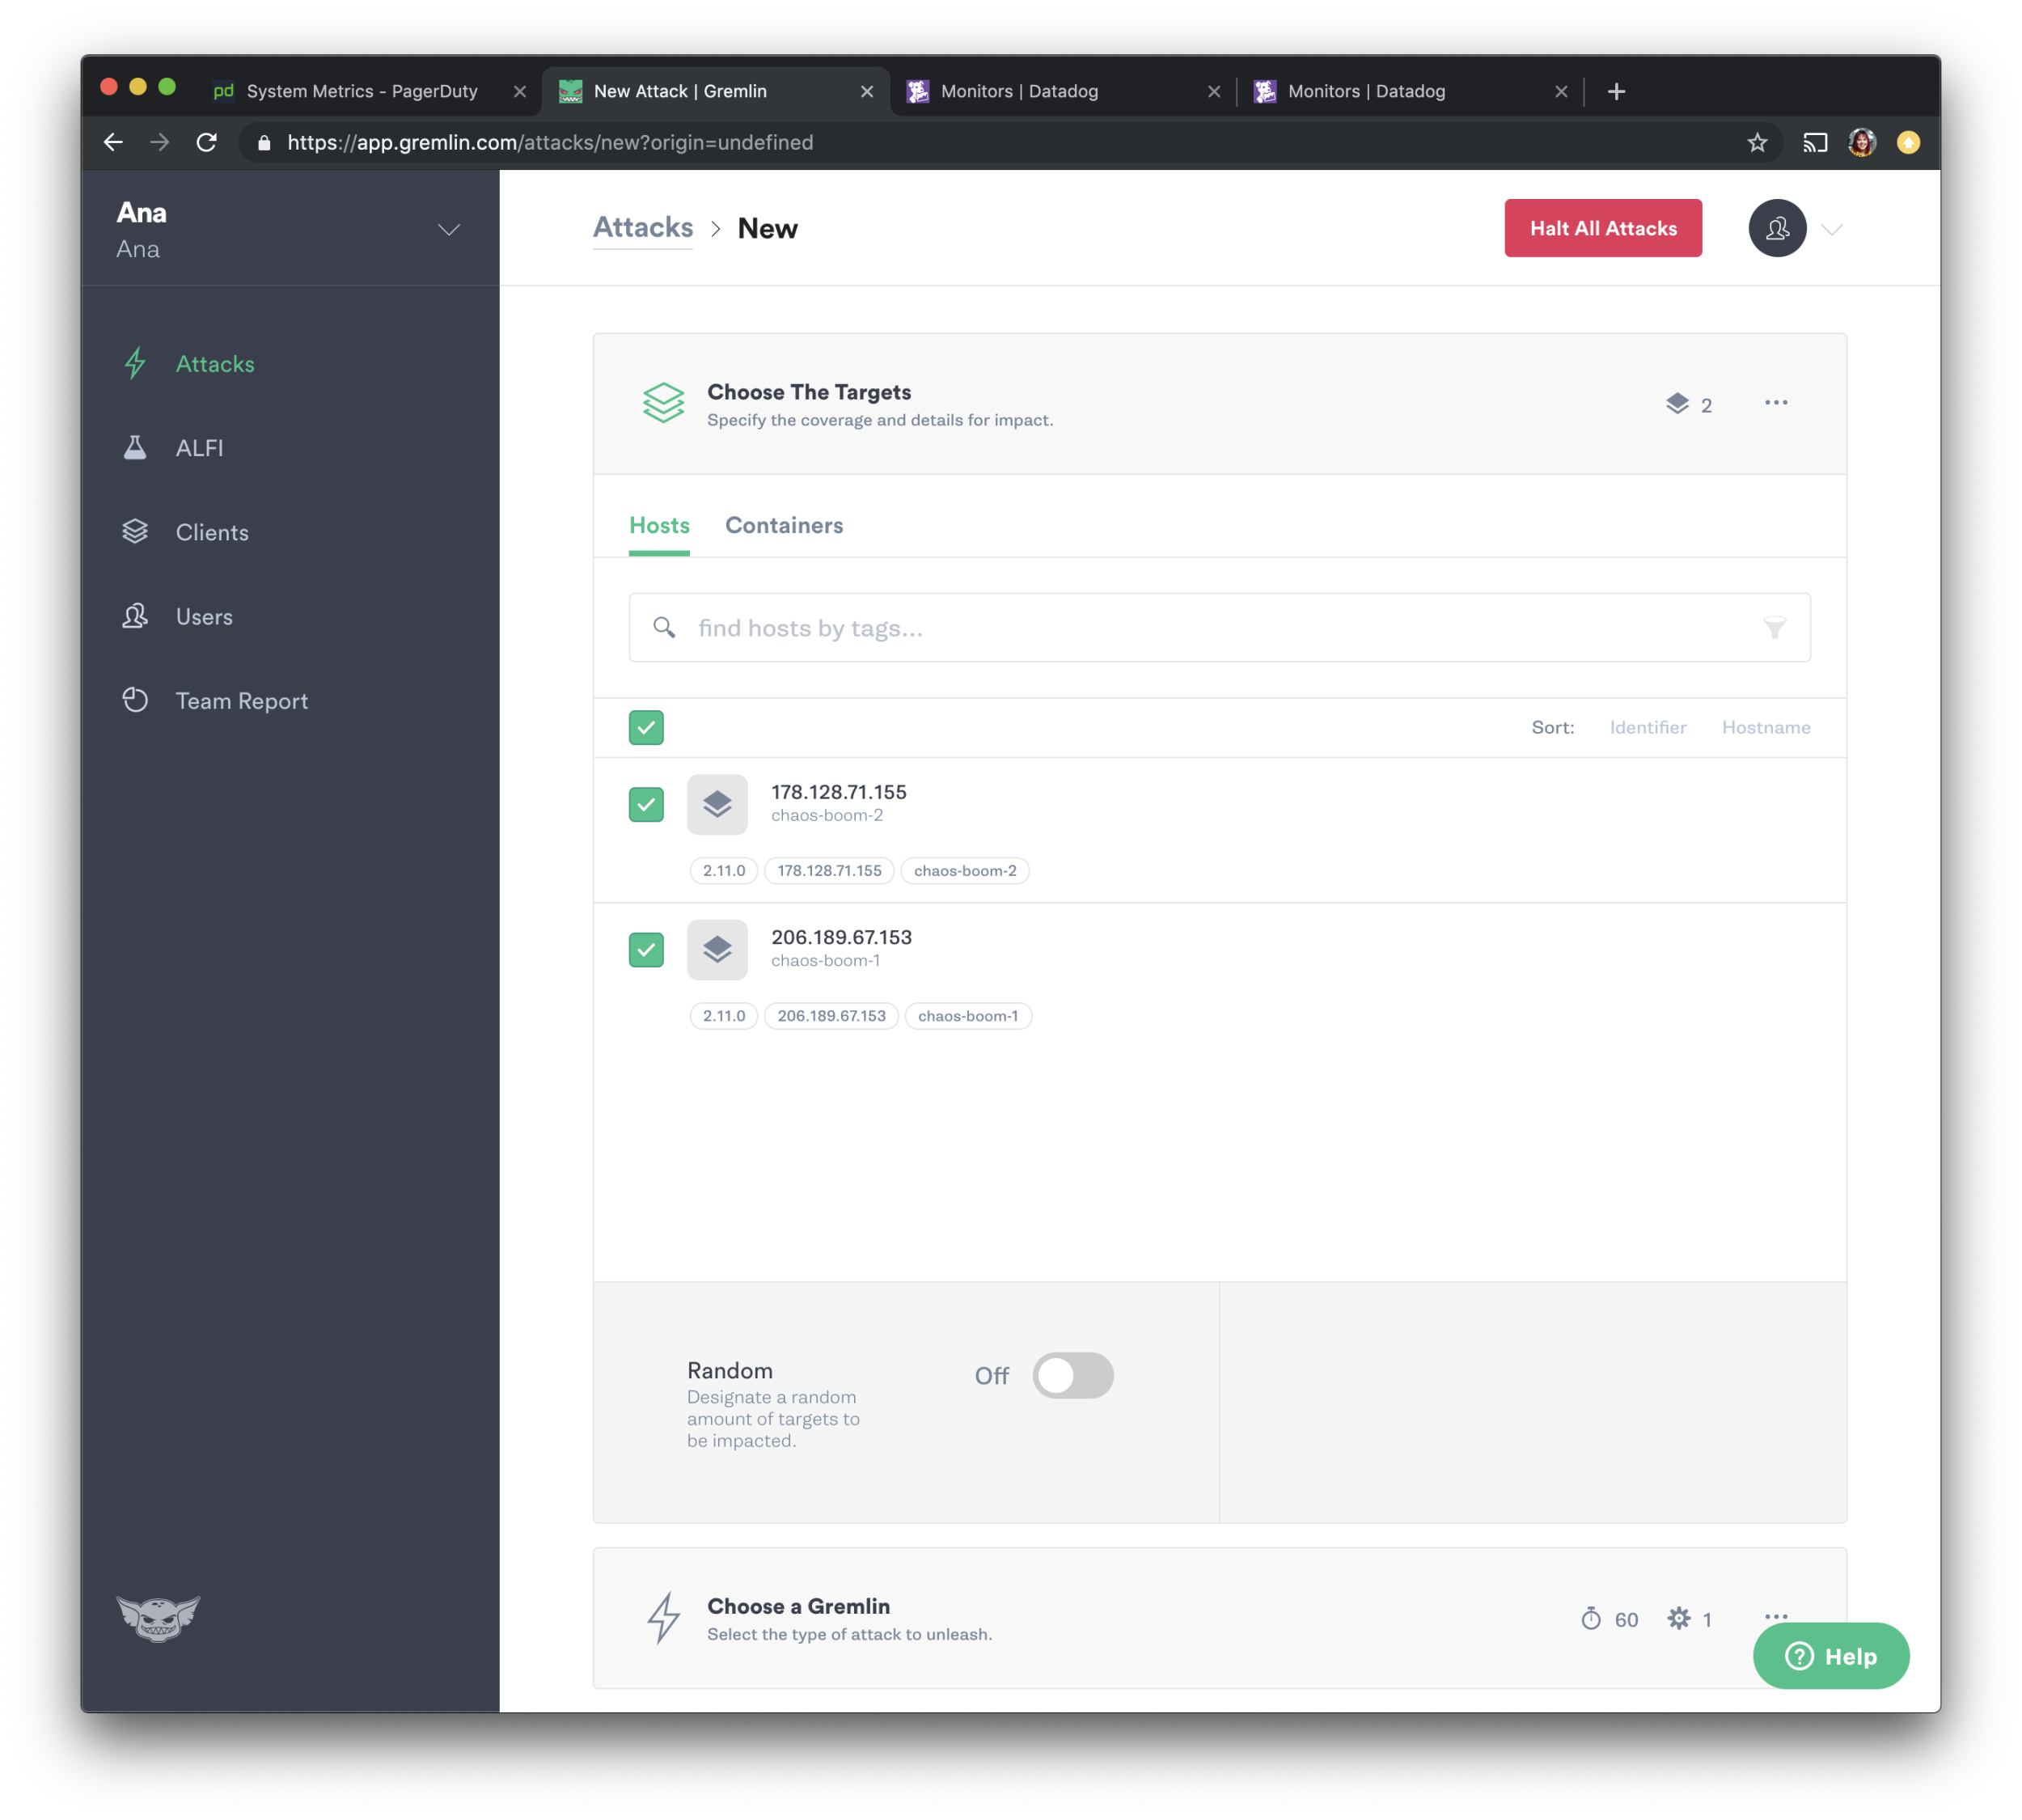
We will now go over to choosing the Gremlin. We will run a resource Chaos Engineering Attack, select “Resource” and choose “CPU” from the options. We will make the length 300 seconds, ask it to consume all cores at 100 percent, and then press the green button to Unleash the Gremlin.

Experiment Results
Our hypothesis was, “When we consume CPU resources, our monitoring tool, Datadog, will help up alert our paging tool, Pagerduty.”
If we configured everything properly, we should have been getting a text, email, and call on regards to the CPU spike on the hosts.
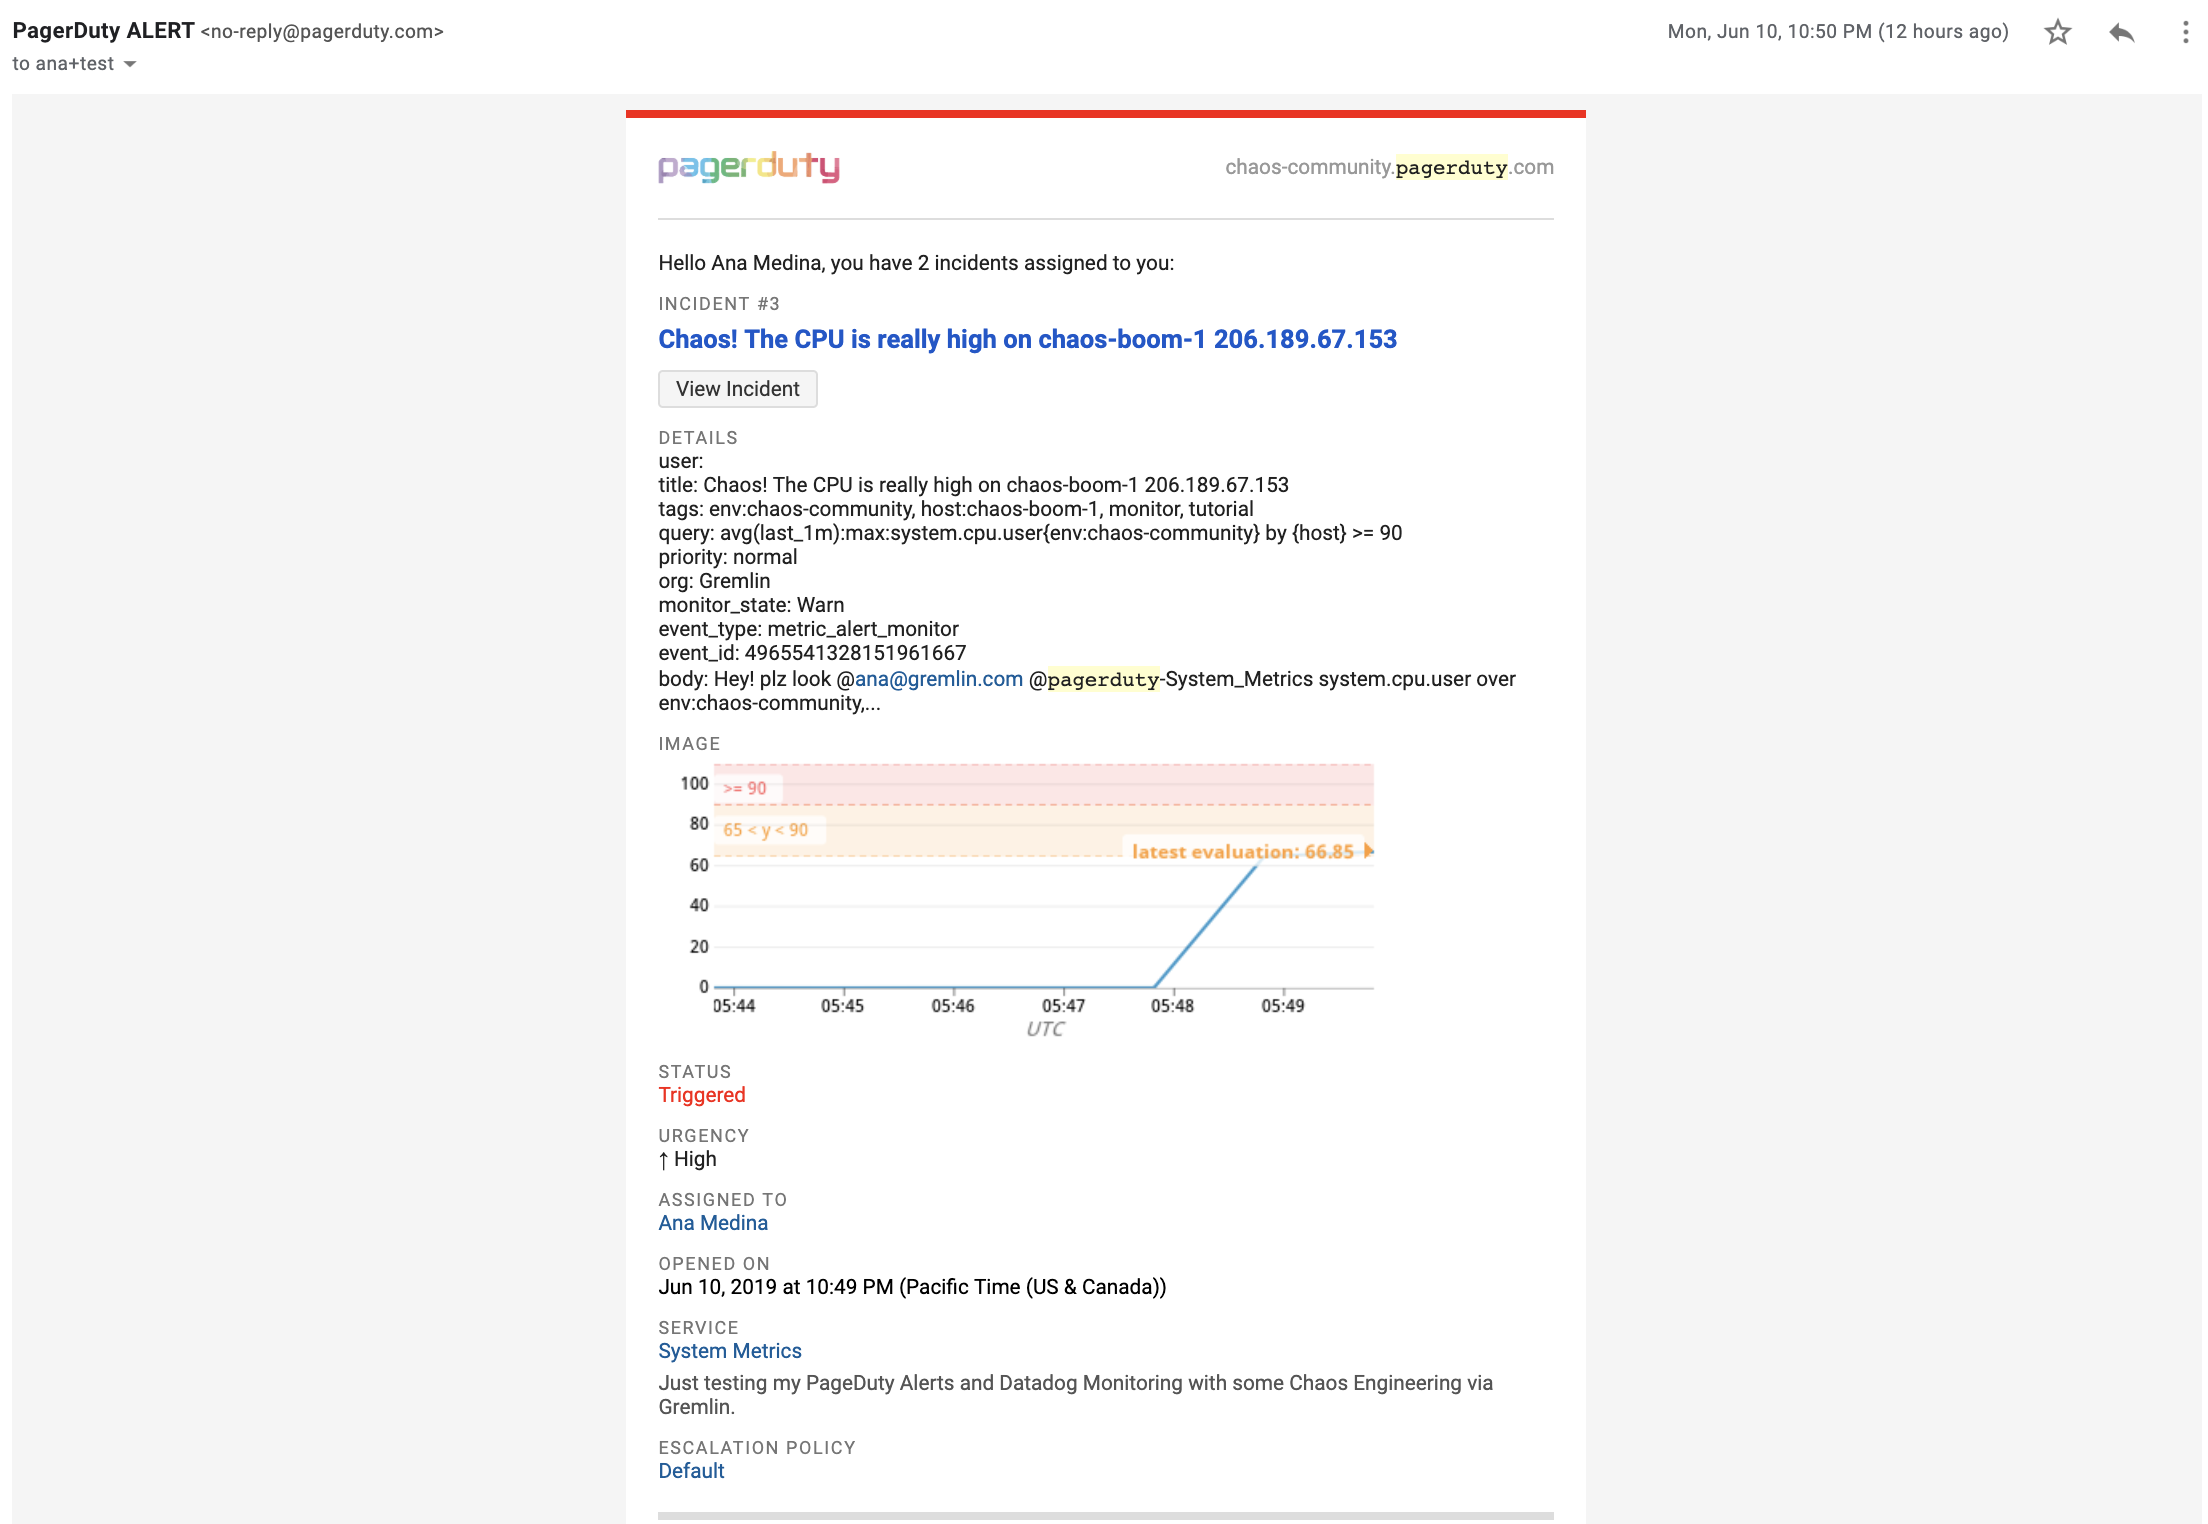
The email should look something like this:
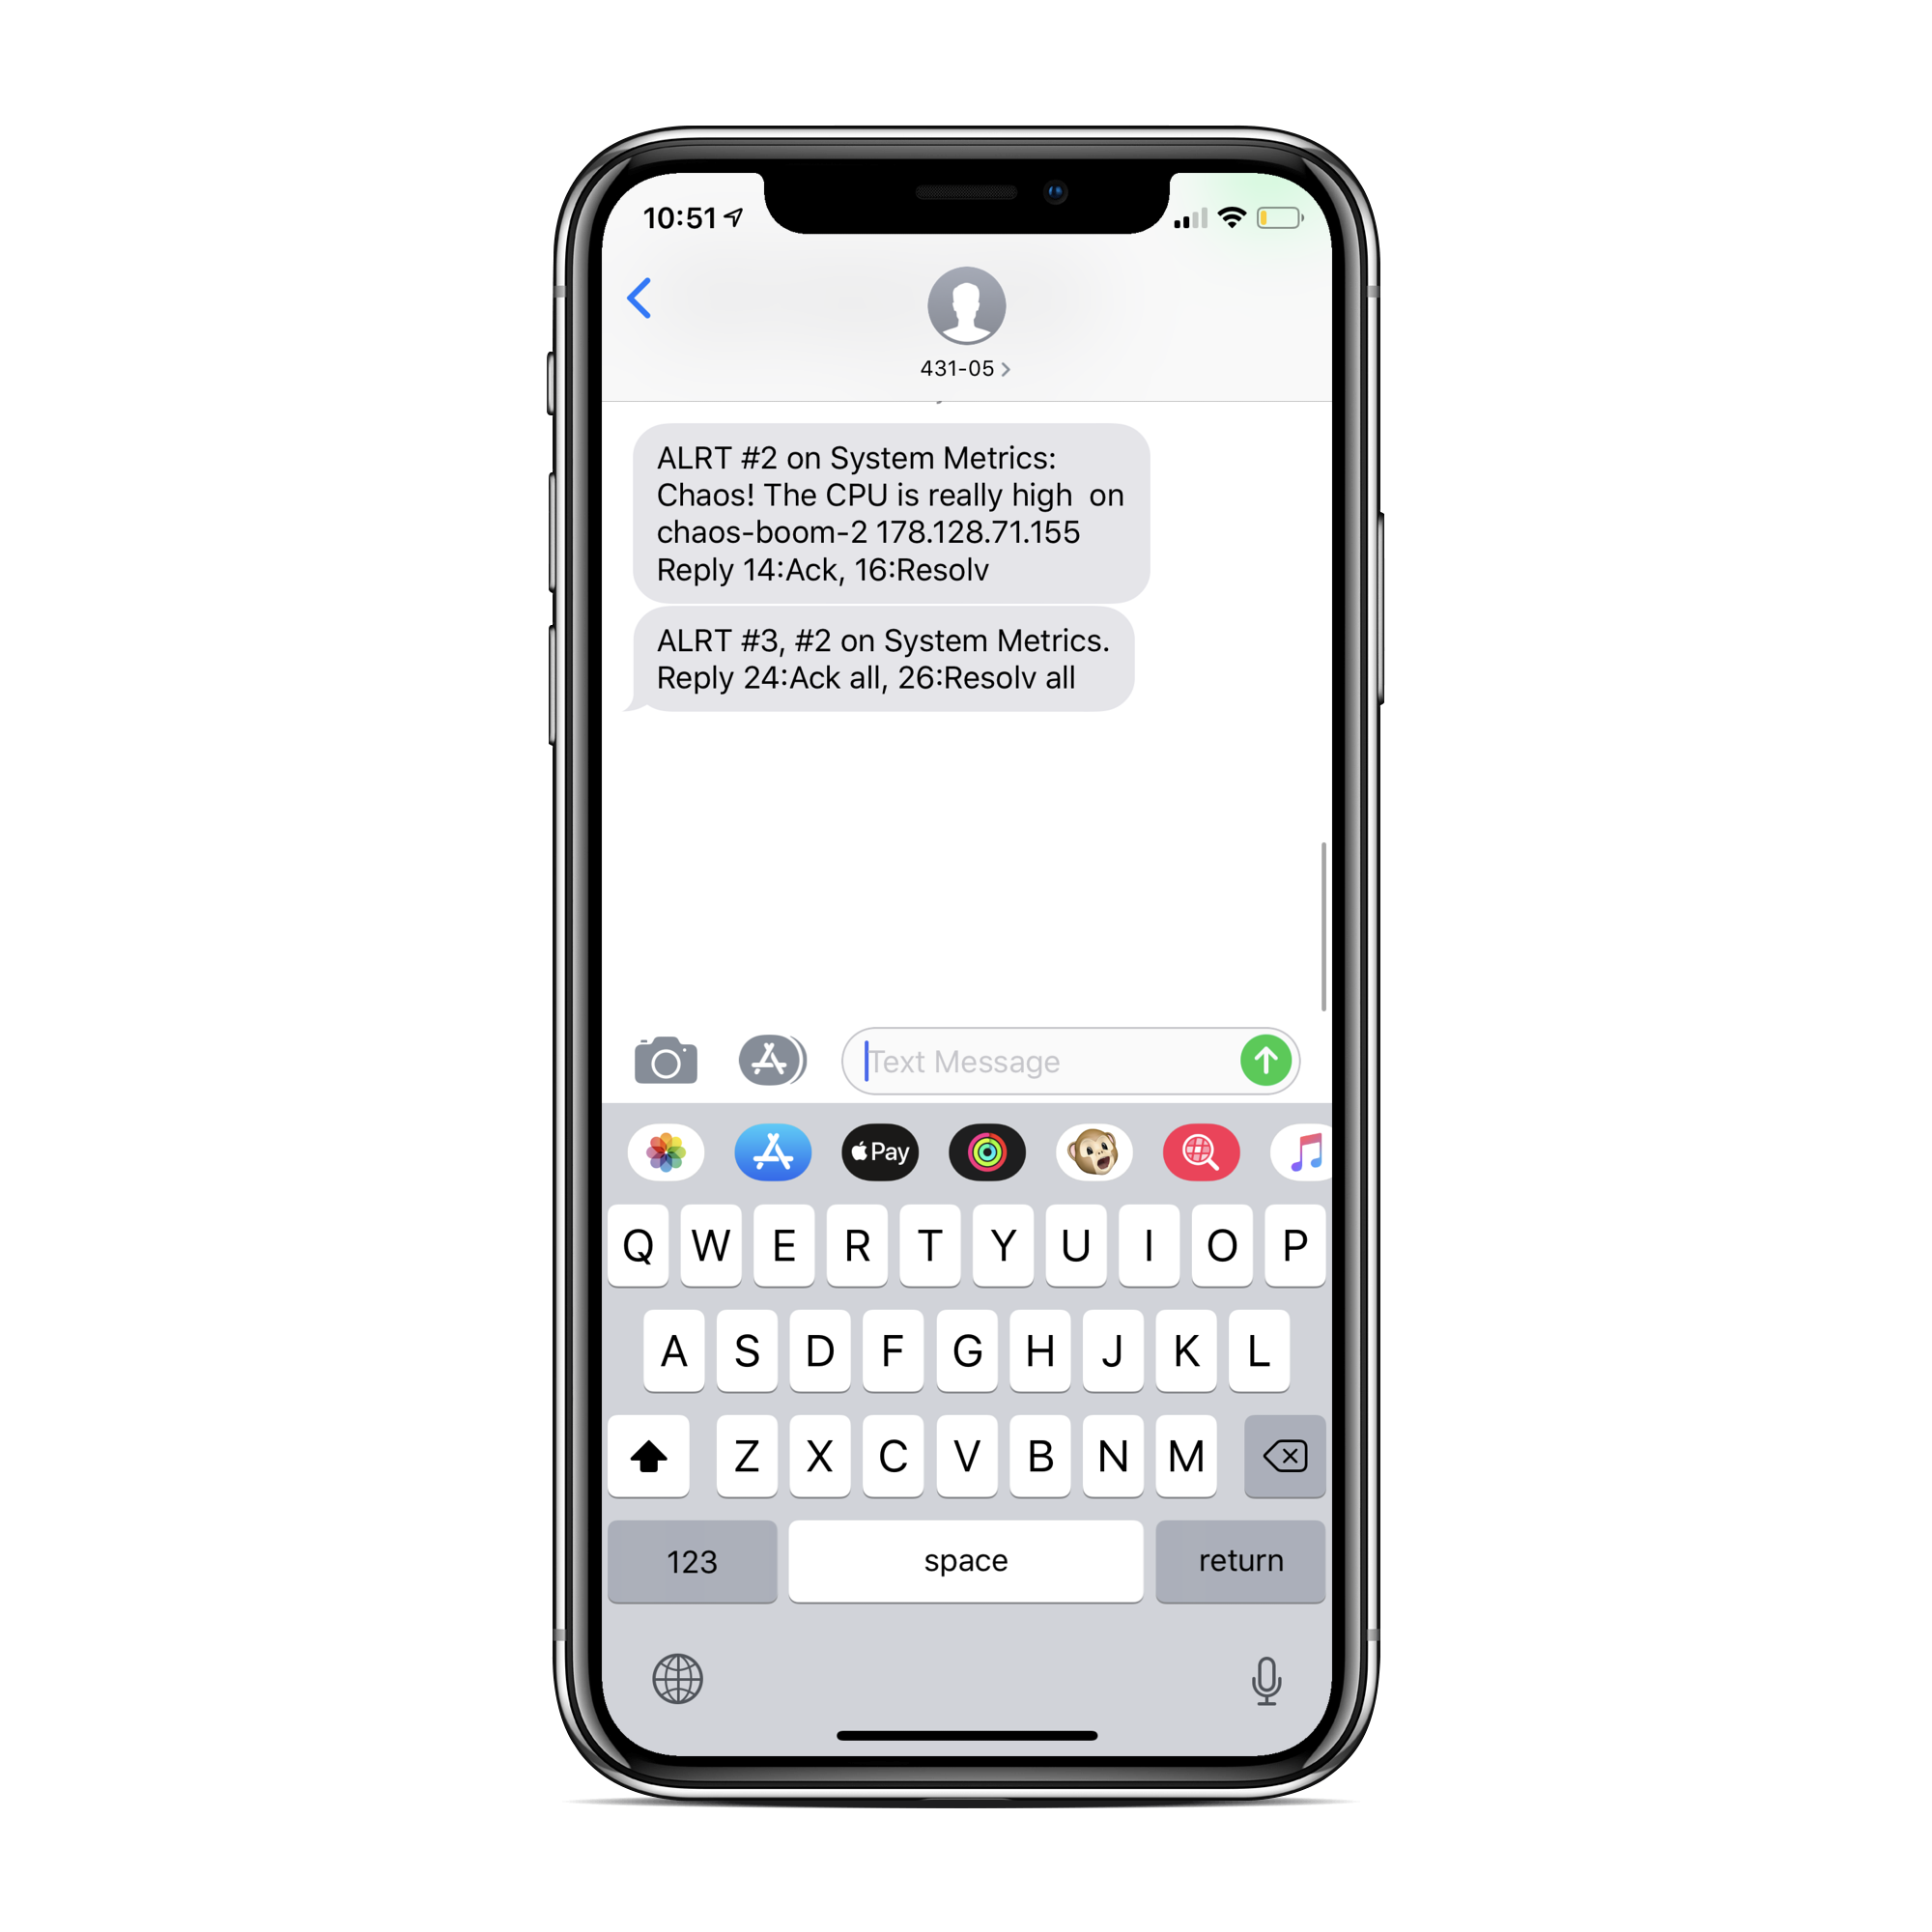
The text message should look something like this:
Conclusion
Congrats! We’ve now seen how you can use Gremlin to test your PagerDuty alerts. We’ve also learned how to configure a monitor using Datadog and enabled the integration to alert PagerDuty. There’s a lot more than you can do using products. As a next step, try shutting down one of your hosts to see if you get an alert. If you have any questions at all or are wondering what else you can do with this demo environment, feel free to join the Chaos Engineering Slack (join here!).
Avoid downtime. Use Gremlin to turn failure into resilience.
Gremlin empowers you to proactively root out failure before it causes downtime. See how you can harness chaos to build resilient systems by requesting a demo of Gremlin.

.svg)