


Managing running, scheduled, and past experiments
Supported platforms:
Gremlin provides two ways to manage current and upcoming activities: “Now Running,” and “What’s Scheduled.” The Now Running page shows which experiments, Scenarios, and reliability tests are actively running in your Gremlin team. The What’s Scheduled page shows the experiments, Scenarios, and reliability tests scheduled to run within the next week. Gremlin also provides a page for reviewing recent experiments called “What Ran.”
Now Running
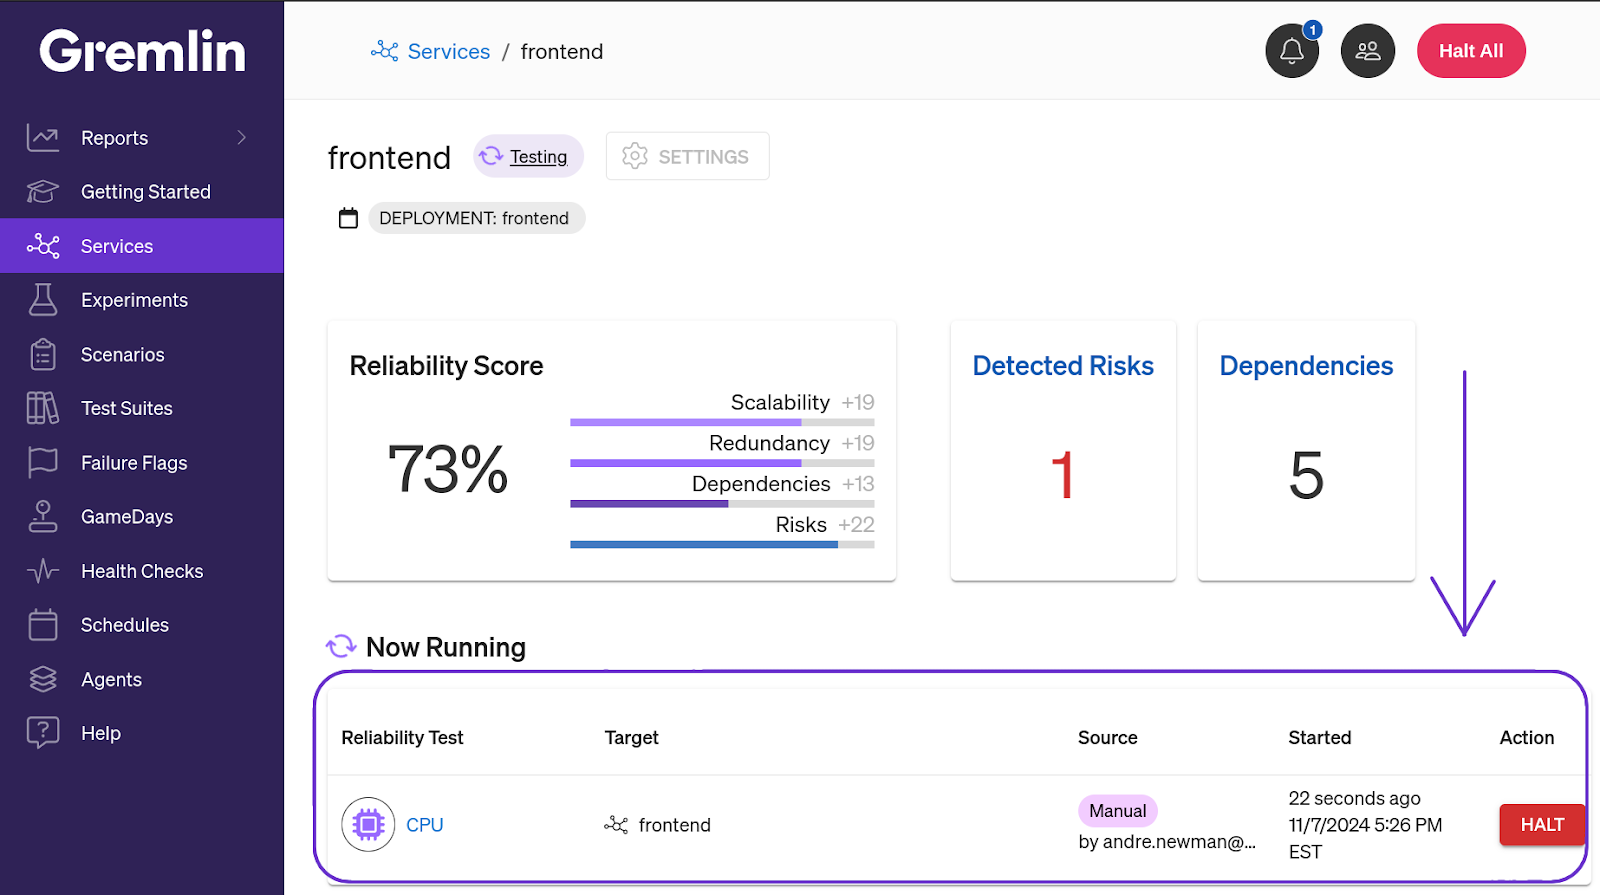
The Now Running page shows all actively running reliability tests, Scenarios, experiments, and Failure Flags in your Gremlin team. With each activity, you’ll also see the service or target(s) it’s running on, who initiated the activity, and when it was started. You can also stop any running activities by clicking the Halt button.

A smaller version of this page is also shown on services that have a reliability test running:
What’s Scheduled
What’s Scheduled shows all experiments, Scenarios, and reliability tests scheduled for next week.
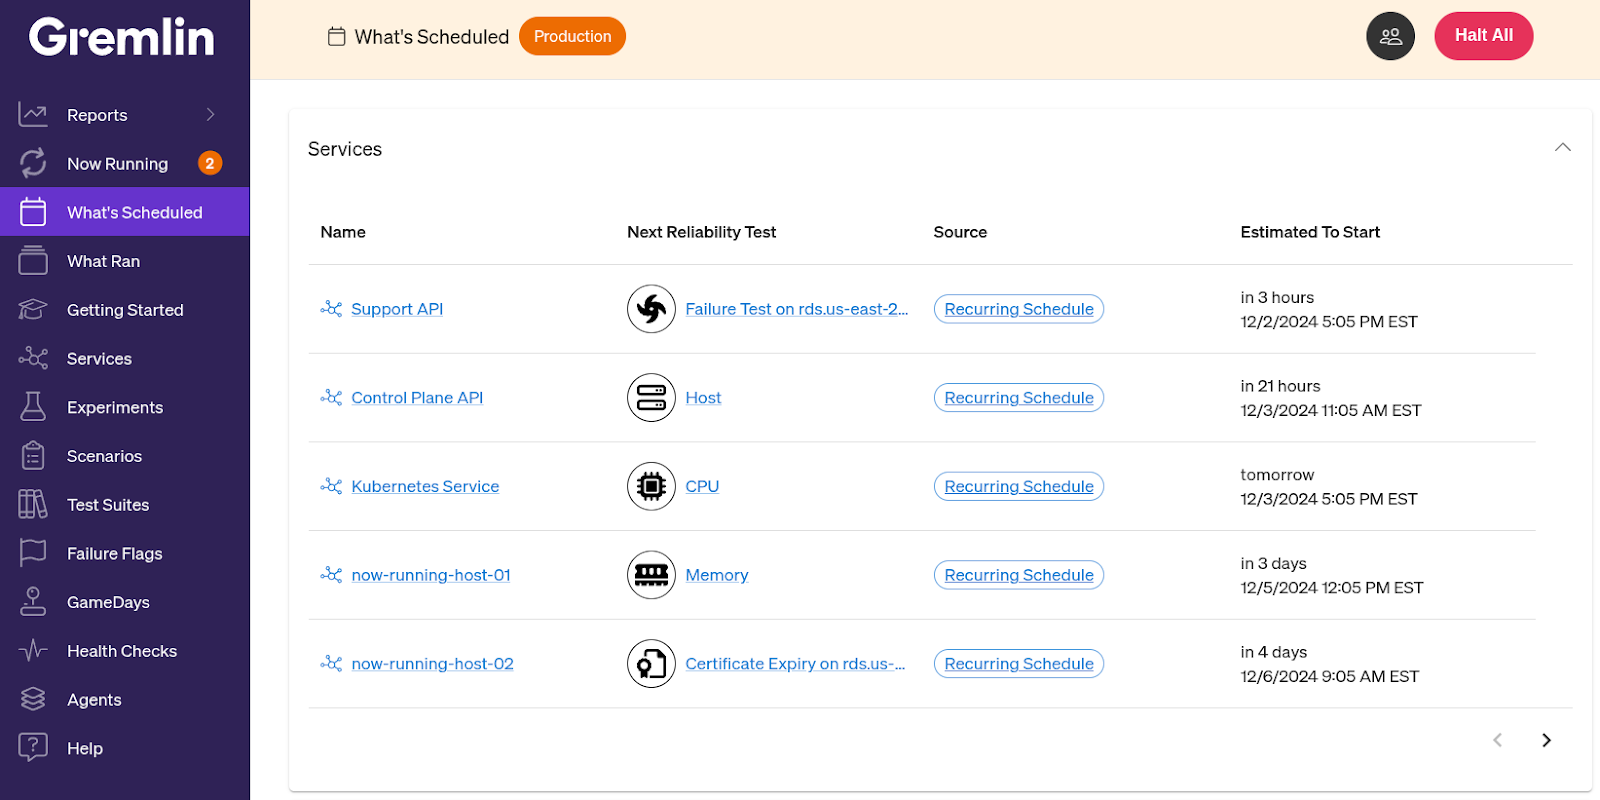
For services, Gremlin shows the next scheduled reliability test, its source (who or what scheduled the test), and when it is estimated to start. This estimation is based on the service’s test window when autoscheduling is enabled.
For Scenarios and experiments, Gremlin shows all scheduled events, including the target system(s), the source (who or what initiated the experiment), and when it’s estimated to start. The estimated start time is the date and time chosen when scheduling the experiment.
You can view the schedule details by clicking on the experiment. This opens a side panel showing the experiment’s cadence, time window, target(s), and details. You can also delete the schedule from this panel.
What Ran
The What Ran page shows your Gremlin team's reliability tests, experiments, and Scenarios executed within the past week.
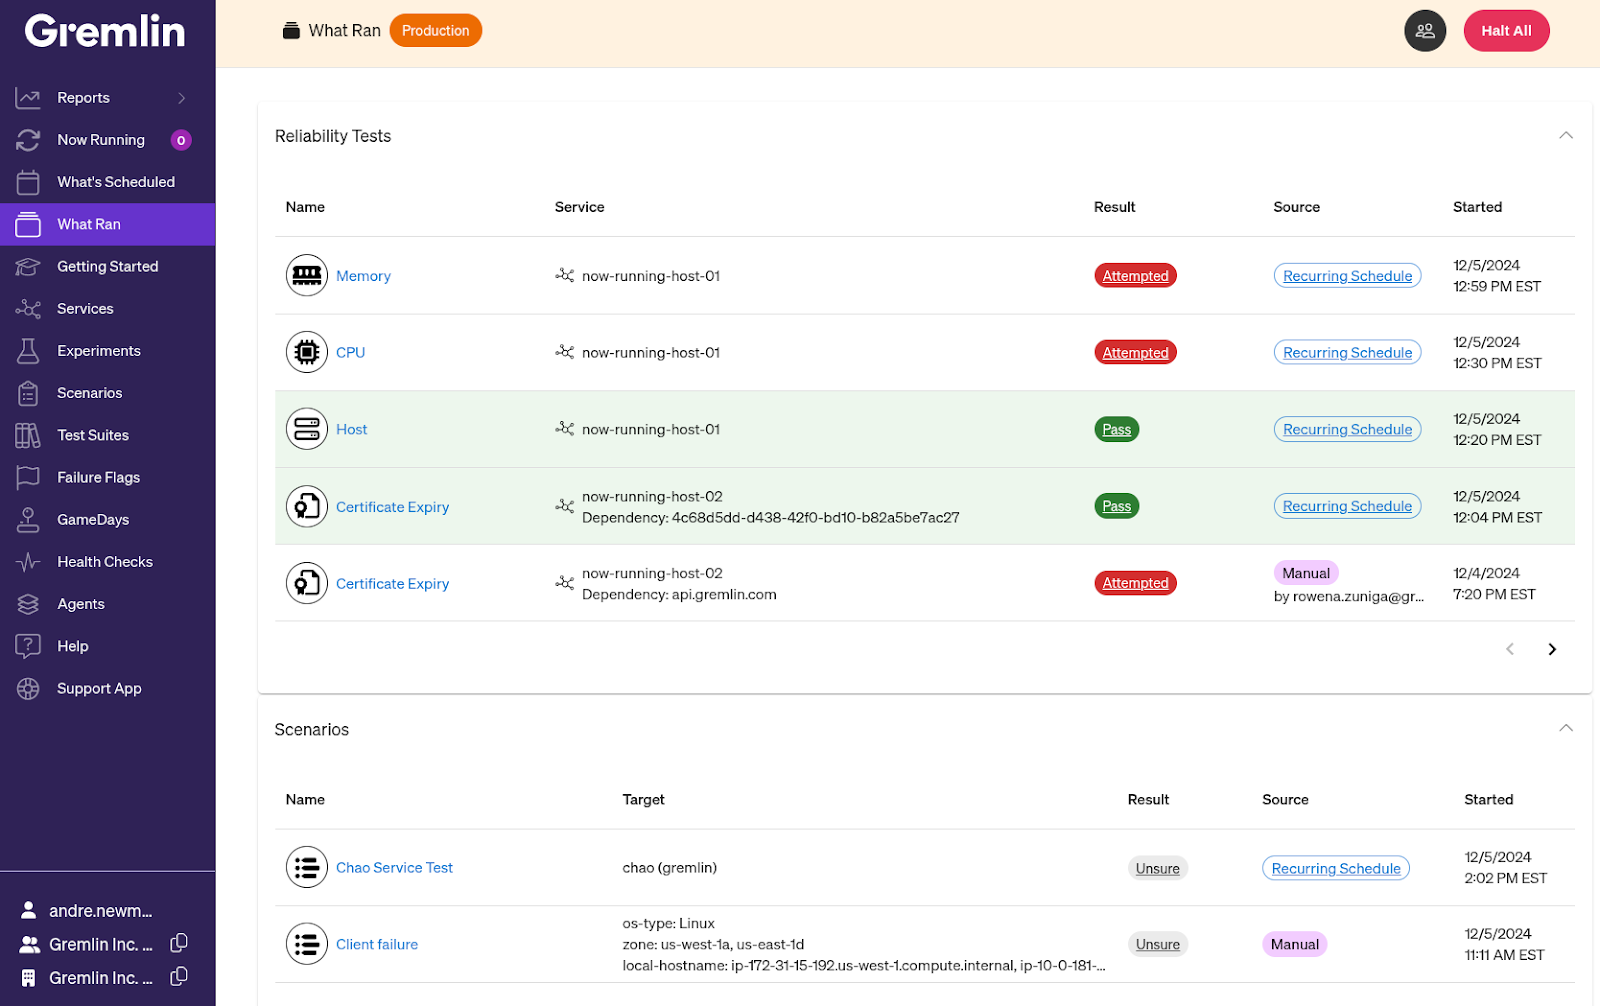
Like the What’s Running page, this page shows the name of each test, its target(s), who or what initiated the test, and when it was started. For reliability tests and Scenarios, this page also shows the result.