The first 3 Chaos Experiments to run on Windows


.svg)
.svg)

 This is an older tutorial
Microsoft Windows is the preferred server operating system for many organizations. Nearly a third of the world’s online systems run on Windows, from small businesses to multinational enterprises. No matter the size of their deployment, teams need to be confident that their Windows servers, services, and applications are resilient to failure.
While Windows has several built-in fault-tolerance and high availability features, simply turning these features on isn’t enough to guarantee reliability. Teams need to verify that these systems are working as intended and providing adequate protection against outages, and the way to do this is with Chaos Engineering.
In this tutorial, we’ll demonstrate the value of Chaos Engineering on Windows systems. We’ll do this by executing three example chaos experiments on Windows Server, Microsoft SQL Server, and Microsoft Exchange. This will help us better understand how our infrastructure is operating, find weaknesses in our deployments, test the high availability systems we have in place, and improve our overall reliability. By reading this guide, you’ll learn how to create and execute chaos experiments on your Windows systems using Gremlin.
Before you begin, we recommend creating a Gremlin account and installing the Windows agent onto a test server so that you can run experiments and practice Chaos Engineering firsthand.
Why do we need Chaos Engineering for Windows?
Chaos Engineering is the practice of proactively testing systems for failure with the goal of making them more resilient. We do this by injecting small amounts of controlled harm into a system, observing the results, and using this information to address shortcomings. This lets us find and fix problems with our systems before they can cause issues for our users, while also teaching us more about how these systems behave.
Many existing Chaos Engineering tools were designed for Linux systems. While much of the world is powered by Linux, many organizations operate with Windows at their core. Network resources are managed using Active Directory, emails are hosted using Microsoft Exchange, virtual machines are managed using Hyper-V, and employees use Windows 10 to work. Windows and software designed for Windows runs critical workloads for many organizations, and it’s essential that IT teams architect these systems to run reliably.
With Gremlin, we can run chaos experiments on our Windows infrastructure and verify that reliability features—such as high availability, clustering, and replication—are working as intended. This way, our users experience fewer interruptions, we have fewer production outages and on-call incidents, and our IT staff can rest easier.
How to approach Chaos Engineering for Windows systems
Next, we'll run three chaos experiments on Windows Server, Microsoft SQL Server, and Microsoft Exchange. But first, we need to explain what a chaos experiment is.
A chaos experiment is an intentional, planned process through which we inject harm into a system to learn how it responds and ultimately, to find and fix problems before they happen in a way that impacts customers. Before starting any attacks on your systems, you should fully think out and develop the experiments you want to run.
When creating an experiment:
- Start with a hypothesis stating the question that you’re trying to answer, and what you think the result will be. For example, if your experiment is to increase CPU usage on a server to 100%, your hypothesis might state that you expect the performance of applications running on the server to drop.
- Define your blast radius. The blast radius includes any and all components affected by this test. A smaller blast radius will limit the potential damage done by the test. We strongly recommend you start with the smallest blast radius possible. Once you are more comfortable running chaos experiments, you can increase the blast radius to include more components.
- ^You should also define your magnitude, which is how large or impactful the attack is. For example, a low-magnitude experiment might be to test application responsiveness after increasing CPU usage by 5%. A high-magnitude experiment might be to increase usage by 90%, as this will have a far greater impact on performance. As with the blast radius, start with low magnitude experiments and scale up over time.
- Monitor your infrastructure. Determine which metrics will help you reach a conclusion about your hypothesis, take measurements before you test to establish a baseline, and record those metrics throughout the course of the test so that you can watch for changes, both expected and unexpected.
- Run the experiment. You can use Gremlin to run experiments on your infrastructure in a simple, safe, and secure way. We also want to define abort conditions, which are the conditions where we should stop the test to avoid unintentional damage. With Gremlin, we can actively monitor our experiments and immediately stop them at any time.
- Form a conclusion from your results. Does it confirm or reject your hypothesis? Use the results you collect to modify your infrastructure, then design new experiments around these improvements.
Repeating this process over time will help us harden our Windows servers and applications against failure. In this guide, we’ll focus on three features and products: Microsoft Windows Server Failover Clustering, Microsoft SQL Server high availability, and Microsoft Exchange Server back pressure. The experiments presented in this guide are by no means exhaustive, but should act more as a starting point for when you experiment on your own systems.
Experiment 1: Windows Server Failover Clustering
Windows Server 2016 introduced Failover Clustering (WSFC), which provides high availability by letting you seamlessly run applications and services on different servers. Rather than designate a single server as the file server or the email server, WSFC lets us delegate these roles to multiple servers. If one fails, another one immediately takes its place and continues running the application with no perceivable interruptions in service.
Here’s how it works: a WSFC cluster consists of one active server (called a node) and one or more inactive nodes. The active node runs the application or service, while the inactive nodes remain on standby. If the active node fails, the cluster automatically reroutes incoming traffic to an inactive node, making it the new active node. Application data is stored on a shared storage device that is accessible to the entire cluster, meaning any node can immediately pick up from where the last node left off.
Depending on the application, deploying a clustered application also creates a unique network access point that clients use to access the application. For example, a clustered file share uses a share name that remains static no matter which node is hosting the share. Clients connect to the share, and WSFC routes requests to the appropriate node behind the scenes. This allows for an interruption-free experience without the need to reconfigure your clients.
Where does Chaos Engineering fit in? While failover clustering is designed to work automatically, we don’t know what the actual behavior will be until we experience an actual failure. We might find that the process works without a hitch, or we might find that all of our applications and users connected to the share are disconnected, potentially causing hours of lost productivity, lost revenue, and possible data loss. We need to be confident that we can failover without interruption, and Chaos Engineering lets us verify this in a safe and controlled way.
Running the experiment
For this example, let’s consider a business that hosts a company-wide file share on a dedicated server. This share stores mission-critical data for all departments, from HR records to sales forecasts to customer information. The share must be available 24/7, as any interruptions in service will effectively bring the company to a standstill. As the business’ IT team, we want to migrate our current single-node share to a multi-node WSFC cluster. We created a two-node cluster, enabled the File Server role, and created the new share. But before we start moving files to the new share, we’ll use Chaos Engineering to make sure the failover process works the way we expect it to.
For this experiment, we want to verify that we can shut down the primary node without losing access to our file share, and that our users and applications remain connected throughout the process. Our hypothesis is that the failover process will occur automatically and seamlessly by rerouting traffic to the inactive node, allowing users to keep accessing files without having to reconnect to the share or enter a different share address.
Our methodology is simple: run a shutdown Gremlin on the active node and try to access files while the system is offline. We can find the active node for our cluster in the Failover Cluster Manager (shown as “current host”).
While WSFC is designed specifically to handle scenarios like this, running a chaos experiment could cause our systems to respond in unexpected and potentially dangerous ways. To be safe, we’ll define abort conditions and immediately stop the test if any of these conditions are met:
- The cluster state becomes invalid, corrupted, or otherwise broken
- Our secondary node also goes offline
- We experience any data loss
Now, let’s run the experiment. We’ll open the Gremlin web app, find our target node (called win-1 in this example), and run the shutdown Gremlin. We can monitor the progress of the attack in real-time to see exactly when the node goes offline. Once it’s down, we’ll try opening a file in the file share. We can view the results of the attack and record our observations in the Attack Details screen:
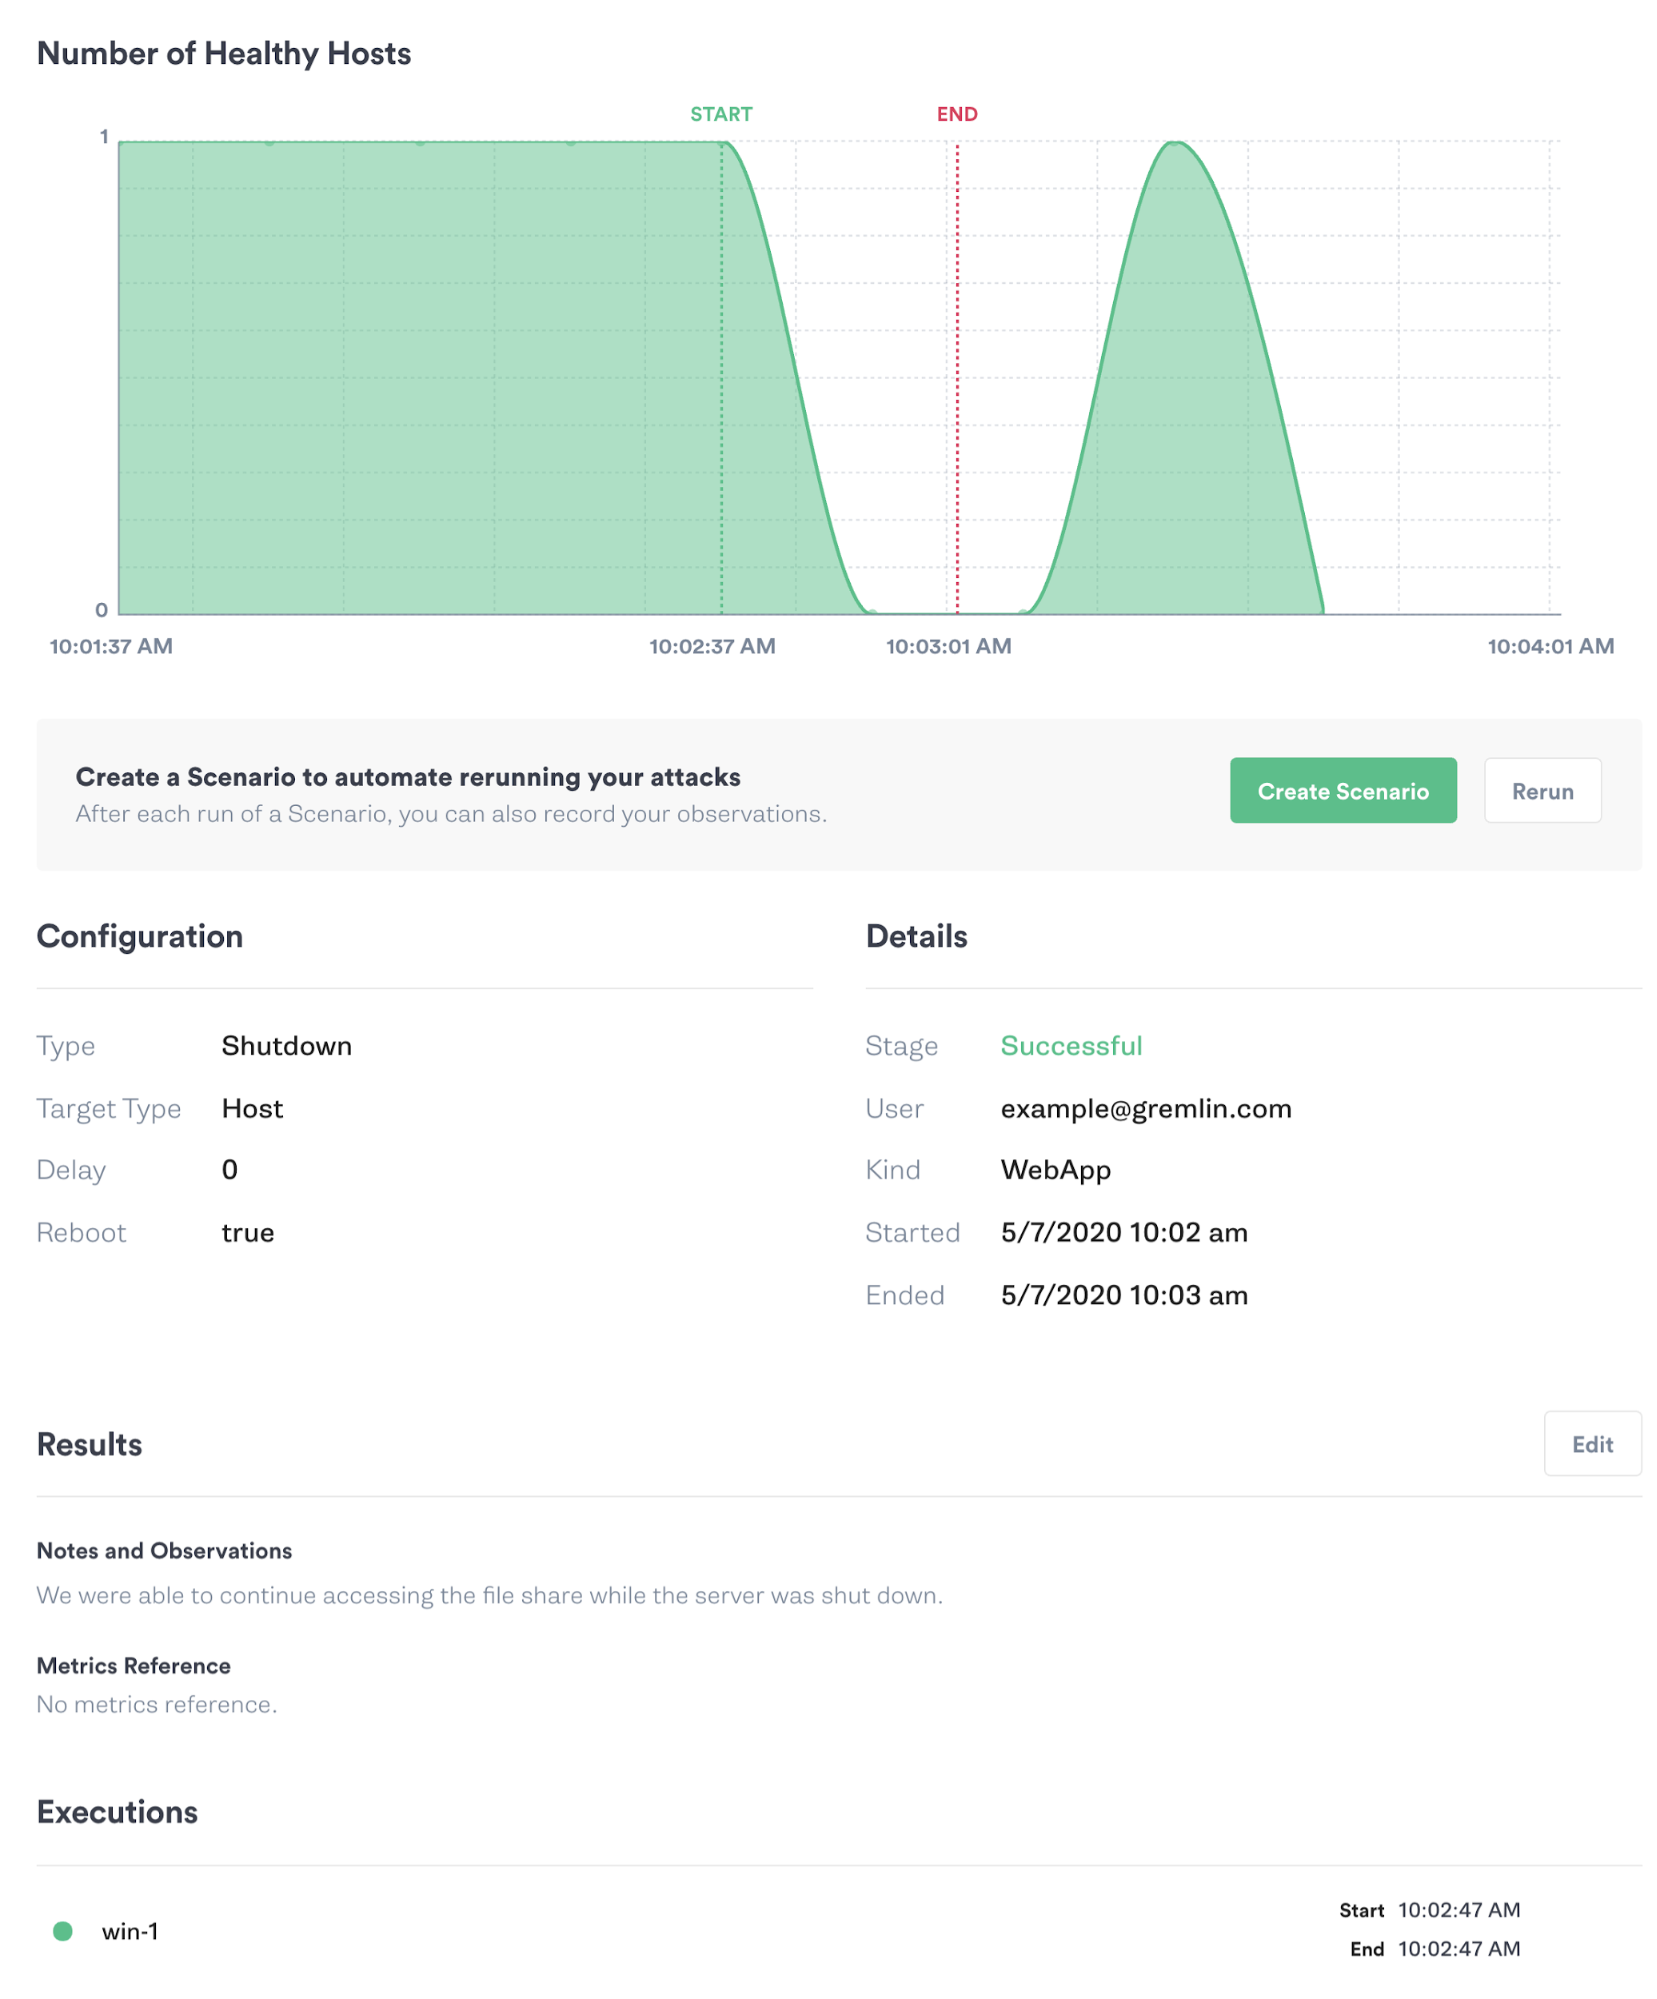
Conclusions
If all goes as planned, we should still be able to read files from the share without experiencing an error, timeout, or disconnection. WSFC automatically detected the outage and rerouted traffic to the inactive node, allowing us to continue accessing our files exactly as if they had been served from the active node. When the “win-1” node finishes rebooting, it should automatically rejoin the cluster as an inactive node.
While failover is typically quick, it’s not instantaneous. This could be problematic for applications that require a persistent or low latency connection. In addition to verifying that WSFC is configured correctly, we should also monitor our applications to make sure the failover process doesn’t cause them to timeout or generate errors. If it does, we should consider tuning our failover thresholds or application timeout thresholds.
Another potential failure point is the shared storage. WSFC relies on shared storage to maintain the state of the application or service between nodes. For example, if our shared storage is a single RAID 0 array with no backups, all we’ve done is moved our failure point from the node to the storage device. When deploying a production WSFC cluster, we should make sure our storage solution is also set up for high availability and create experiments that adequately test its failover capabilities.
Experiment 2: SQL Server Always On Availability Groups
SQL Server is one of the applications that can leverage WSFC for failover, but it also offers its own high availability features. One of these is Always On availability groups (AG), which provide replication and fault tolerance on a per-database level. With AG, a set of databases (the availability group) can be replicated up to nine times across different nodes. One node (the primary) handles all read and write operations, while the others (the secondaries) mirror the primary. As with WSFC, a failure on the primary node results in immediate failover to the next healthy secondary.
One important difference from WSFC is that AG requires an AG listener, which acts as a health monitor and proxy between SQL Server clients and the database. Clients connect to the AG listener, which then routes traffic to the primary SQL Server instance. Much like the file share example, the AG listener provides a static SQL Server address and dynamically routes traffic to the appropriate node behind the scenes.
Continuing from the previous example, assume our company hosts its primary application database using SQL Server. As with our file server, any failures on our database server could mean disaster for the business in terms of lost revenue, angry customers, and late nights for our engineers. To mitigate this risk, we deployed a second SQL Server instance onto our two-node WSFC cluster, added an AG listener, and connected our application to the listener. As with our WSFC cluster, we want to ensure that the failover process works the way we expect it to, and we can use Chaos Engineering to confirm that it does.
Running the experiment
For this experiment, we want to confirm that our application can continue to query the database in the event of a primary node failure. Our hypothesis is that when the primary node can’t be reached, the AG listener will automatically redirect our queries to one of the secondaries and our application will continue working as normal. Node health is determined by the session-timeout period, which marks a node as unhealthy if it fails to respond to a check within a certain amount of time (10 seconds by default). This means that at most, we’ll experience 10 seconds of latency until the AG listener elects a new node as the primary.
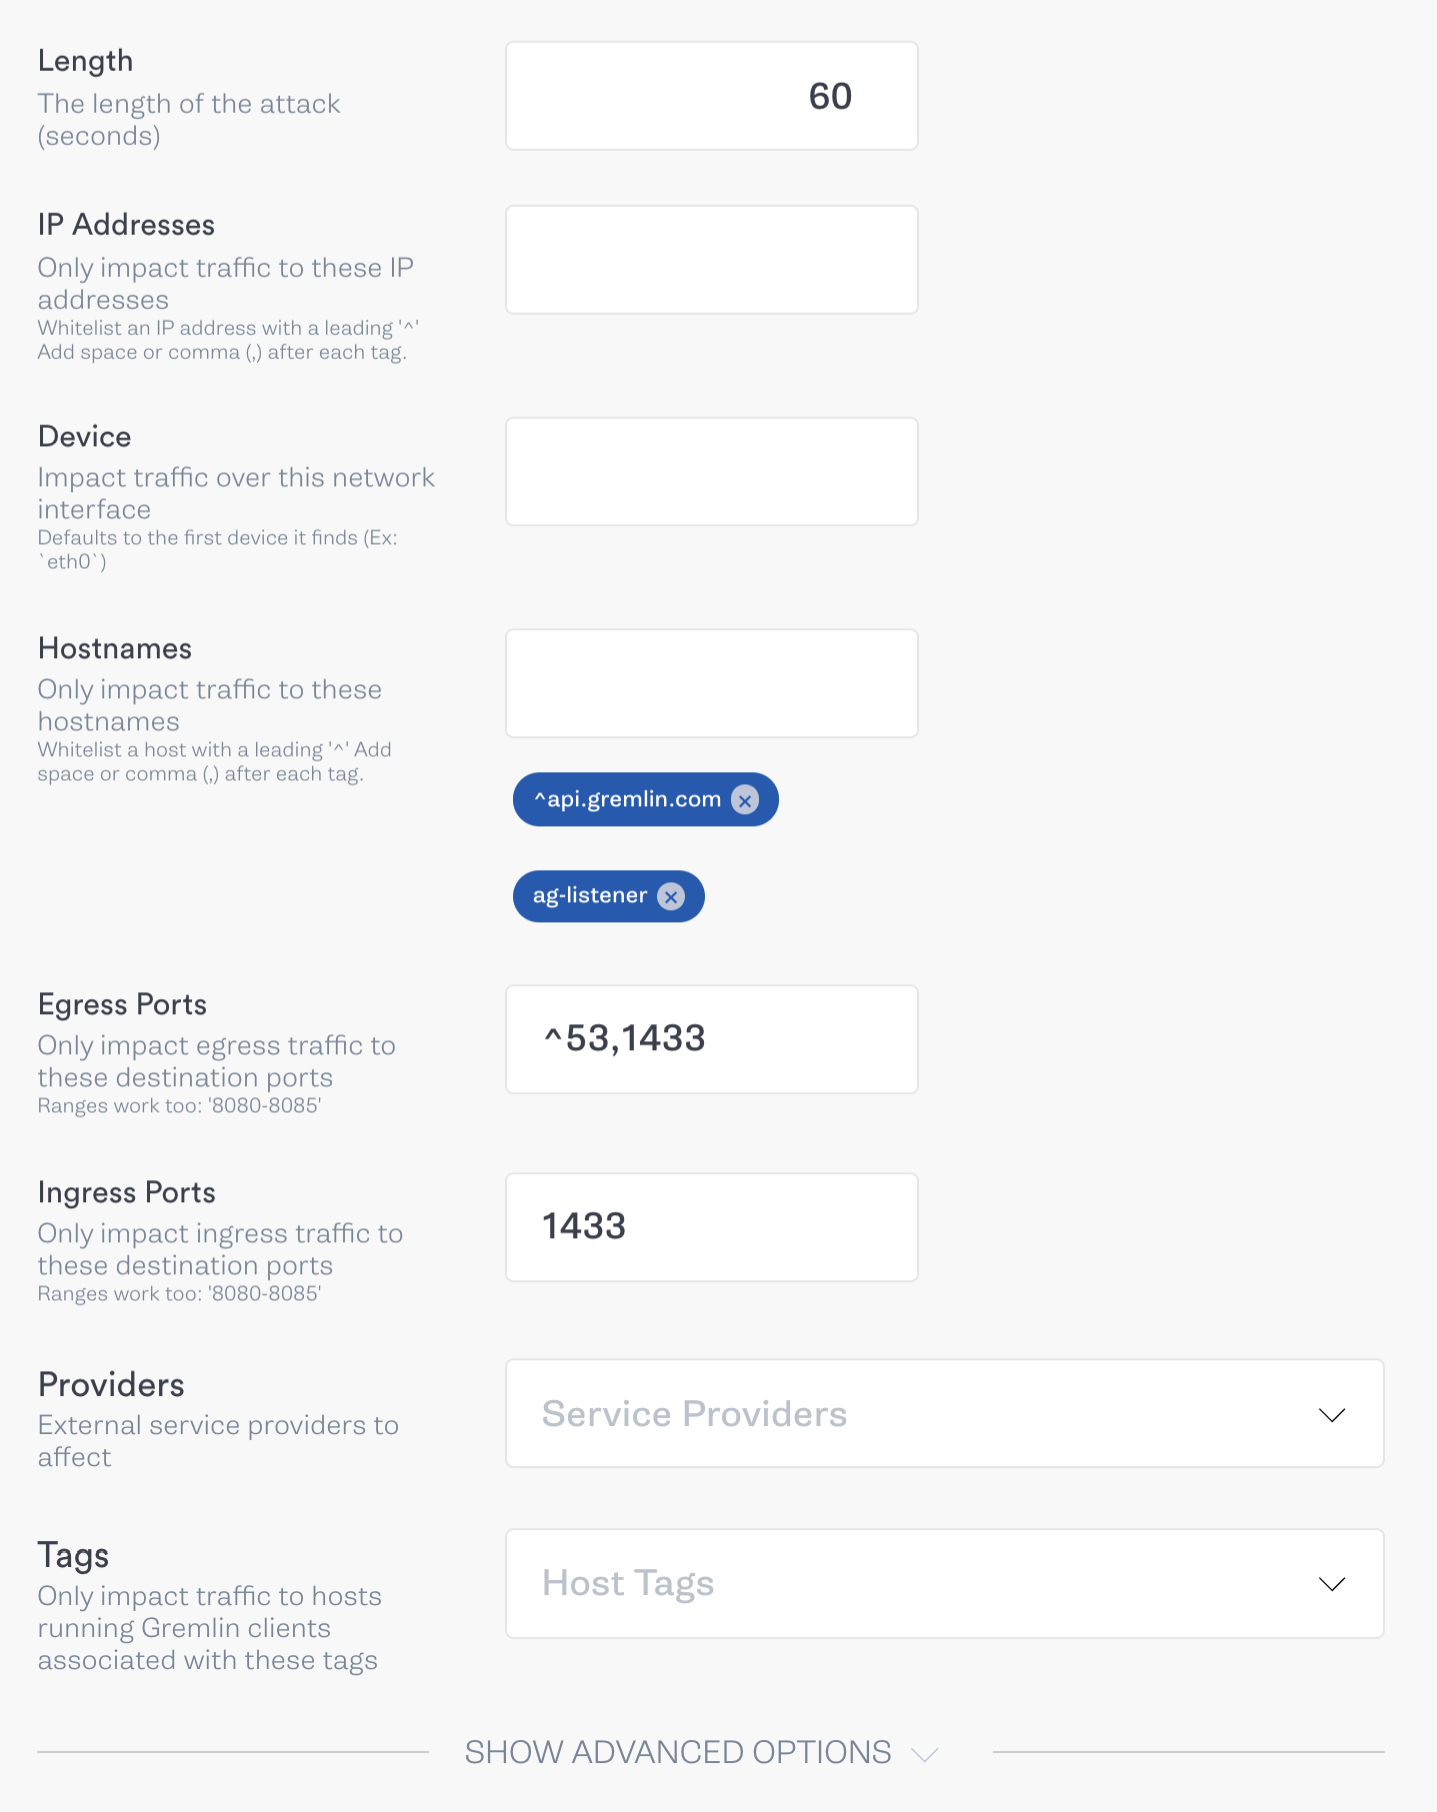
To do this, we’ll use a blackhole Gremlin to drop all SQL Server-related network traffic on our primary node. We’ll do this by blocking port 1433 in both directions. To be thorough, we’ll also block all traffic between the primary node and the AG listener. This should force the AG listener to mark the primary node as unhealthy and reroute traffic to the secondary node. Here is how our attack is structured in the Gremlin web app:
In addition to the abort conditions for the previous test, we should abort this test if the time it takes for the cluster to respond to our query is longer than our session timeout period (10 seconds). This indicates that the AG listener is still trying to access the primary node despite passing the session timeout period.
Conclusions
If everything is configured correctly, blocking traffic to the primary node causes the AG listener to elect a secondary as the new primary and route traffic to it instead. We should experience at most a 10 second delay (our timeout duration) while the AG listener waits for a response from the primary. After this initial delay, our queries should perform as normal with little to no change in latency.
Experiment 3: Microsoft Exchange Server back pressure
Microsoft Exchange is one of the more popular mail servers available, especially for companies hosting mail on-premise or in a private cloud. Email is the primary way that many teams communicate, making it just as essential to business operations (if not moreso) as file sharing and database management.
A significant challenge when deploying Exchange is choosing the right capacity for your server. There are calculators built for estimating capacity by factoring in dozens of variables, from the number of users in your company to the speed of your storage devices. Exchange continuously monitors server capacity to make sure it has enough resources to continue running, and if it doesn’t, it triggers a back pressure system. This system slows down or stops various Exchange features in order to prevent resources from being completely exhausted, depending on which resource is being constrained. This can include flushing caches, delaying mail processing, or even rejecting all incoming and outgoing mail, none of which are ideal in the middle of a work day.
The back pressure system has three response levels for each monitored system resource and transitions between levels based on thresholds. These are:
- Low or normal: The resource isn’t being overused, and Exchange is operating normally.
- Medium: The resource is slightly overused, and a limited amount of back pressure is being applied. For example, mail from other servers might be delayed.
- High: The resource is severely overused. All message flow stops, both from external servers and local Exchange messages, until utilization drops to a more stable level.
While we hope to never hit the medium or high thresholds, we can use Chaos Engineering to better prepare by taking actions such as:
- Learning how the system behaves when experiencing back pressure
- Observing the downstream impact on our applications and users
- Configuring and testing custom back pressure thresholds
- Implementing and testing monitoring solutions meant to detect back pressure or high resource consumption
- Testing our ability to scale vertically and increase node capacity as usage grows
- Testing a high availability cluster and whether we can gracefully failover from a stressed node to a stable node
Let’s assume that our company’s application occasionally sends out emails to customers for things like email verification and marketing messages. Our application connects to Exchange via SMTP, but if it can’t connect (or it receives an error), it should fall back to SMS or another form of communication. We can verify this behavior using Chaos Engineering.
Running the experiment
For this experiment, we want to see the effect that back pressure has on our upstream applications. We’ll deliberately trigger the back pressure system by consuming disk space on our Exchange server. High disk consumption is a common problem in Exchange caused by growing transaction logs, operation logs, inbox sizes, etc, so simulating disk consumption is a realistic scenario that we can benefit from being prepared for.
To do this, we’ll use a disk Gremlin to utilize 99% of the server’s total disk space, which should surpass the high threshold. We’ll monitor Exchange to make sure the back pressure mechanism triggers as expected, and we’ll also monitor our application to see if it falls back to an alternative communication method, or simply fails. Our hypothesis is that Exchange will respond according to the High threshold for the UsedDiskSpace action, which means rejecting incoming and outgoing messages. We’ll abort the test if Exchange Server crashes, the node fails, or if we lose any mail data.
Conclusions
If all goes as planned, Exchange will reject any messages that are sent or received, but will otherwise continue running. Exchange will generate a temporary delivery failure report with the status code 4.3.1, and connecting to SMTP via telnet will return code 452, indicating that the system has insufficient resources. When our application tries to send an email, Exchange should return an error code, and our application should interpret this as a signal to switch to SMS. Once disk usage decreases, we should see mail transfer return to normal.
How does validating back pressure help us improve reliability? By experimenting, we gain an understanding of how our server behaves when it reaches its absolute limits. We can use this to tune our monitoring systems and receive automated alerts before Exchange starts slowing down or disrupting mail delivery. This also helps us justify and plan out capacity upgrades, design a high availability infrastructure, or set our own back pressure thresholds. Experiments like these help us validate these changes work as intended without compromising either performance or availability, even under the most stressful conditions.
How to Move Forward with Chaos Engineering on Windows
Windows provides the IT backbone of many organizations, and keeping these systems up and running is a top priority. Chaos Engineering gives IT administrators and site reliability engineers (SREs) the necessary tools to test the reliability of their Windows deployments, detect issues, and implement solutions that provide a high level of resilience. Proactively testing for failure helps reduce the risk of outages, saving the company time and money in the future.
Now that you’ve seen three different chaos experiments for Windows, start creating your own. Try running a simple resource or network experiment and observe the impact on your systems. If running the attack caused an unexpected result—for example, an application crashed—consider how you might prevent the problem from happening when you repeat the experiment. Once you implement a fix, repeat the experiment to verify that it works, then incrementally increase both the magnitude (the severity of the experiment) and the blast radius (the number of systems impacted by the experiment). Be sure to start each experiment with a clear hypothesis, monitor your systems during the experiment, and record your observations. This will not only help guide your experimentation process, but also creates a record of your progress as you improve reliability.
Additionally, you can use the following experiment cards to quickly validate your system against common failure modes using Gremlin's Recommended Scenarios.
Lastly, if you’re interested in introducing Chaos Engineering to the rest of your organization, read our guide on How to convince your organization to adopt Chaos Engineering. From there, you can read our Chaos Engineering adoption guide to learn how to implement Chaos Engineering throughout your organization by defining objectives, designing and running experiments, and automating attacks as part of your CI/CD pipeline.
This shutdown attack will make Gremlin force shutdown the host system. Your offering should gracefully exit when this happens, and restart when the system comes back up.
Length:
1 step
Attack Type
Shutdown
.svg)
As hosts fail, shutdown, or are taken offline, their workload will be distributed without users noticing any effects and there will not be any errors thrown.
Length:
3 steps
Attack Type
Shutdown
Avoid downtime. Use Gremlin to turn failure into resilience.
Gremlin empowers you to proactively root out failure before it causes downtime. See how you can harness chaos to build resilient systems by requesting a demo of Gremlin.

.svg)