


Experiments
Supported platforms:
An experiment is Gremlin’s term for injecting fault into some part of a system in a safe and secure way. This can include causing network outages, creating latency, shutting down hosts, and exhausting compute resources. In addition to running ad-hoc experiments, you can also schedule regular or recurring experiments, create experiment templates, and view reports of historical experiments. Experiments form the foundation of Gremlin’s other features, such as Scenarios and Test Suites.
Experiment categories
Gremlin provides three categories of experiments:
- Resource experiments: test against sudden changes in consumption of computing resources.
- Network experiments: test against unreliable network conditions.
- State experiments: test against unexpected changes in your environment, such as power outages, node failures, clock drift, or application crashes.
The tables below show the experiments that belong to each category.
Resource Experiments
Resource experiments consume compute resources like CPU, memory, and I/O throughput.
| Experiment | Impact |
|---|---|
 CPU
CPU
|
Generates high load for one or more CPU cores. |
 Memory
|
Allocates a specific amount of RAM. |
 GPU
GPU
|
Generates high compute load on a GPU. |
|
|
Puts read/write pressure on I/O devices such as hard disks. |
 Disk
Disk
|
Writes files to disk to fill it to a specific percentage. |
 Process Exhaustion
|
Simulates running processes on a target to consume process IDs (PIDs). |
State Experiments
State experiments modify the state of a target so you can test for auto-correction and similar fault-tolerant mechanisms.
| Experiment | Impact |
|---|---|
 Shutdown
|
Performs a shutdown (and an optional reboot) on the host operating system to test how your system behaves when losing one or more cluster machines. |
 Time Travel
|
Changes the host's system time, which can be used to simulate adjusting to daylight saving time and other time-related events. |
 Process Killer
|
Kills the specified process, which can be used to simulate application or dependency crashes. Note: Process experiments do not work for Process ID 1, consider a Shutdown experiment instead. |
Network Experiments
Network experiments test the impact of lost or delayed traffic to a target. Test how your service behaves when you are unable to reach one of your dependencies, internal or external. Limit the impact to only the traffic you want to test by specifying ports, hostnames, and IP addresses.
| Experiment | Impact |
|---|---|
 Blackhole
|
Drops all matching network traffic. |
 Certificate Expiry
|
Checks for expiring security certificates. |
 Latency
|
Injects latency into all matching egress network traffic. |
 Packet Loss
|
Induces packet loss into all matching egress network traffic. |
 DNS
DNS
|
Blocks access to DNS servers. |
Network experiments on Linux
On Linux, Gremlin uses traffic policing features built into the Linux kernel to drop matching IP packets. The Gremlin agent does not interact with firewalls like iptables or nftables, so it does not interfere with firewall rulesets.
Network experiments on Kubernetes
Please see these important considerations when running network experiments on Kubernetes.
How to run an experiment
There are three ways to run an experiment: using the Gremlin web app, REST API, and Gremlin CLI (command-line interface). To run an experiment using the Gremlin web app:
- Log into the Gremlin web app and click on the Experiments link in the left-hand navigation menu.
- Click the New Experiment button.
- Select the type of system that you want to run the experiment on. Gremlin supports host, container, and Kubernetes-based targets (for running experiments on applications and serverless functions, see Failure Flags).
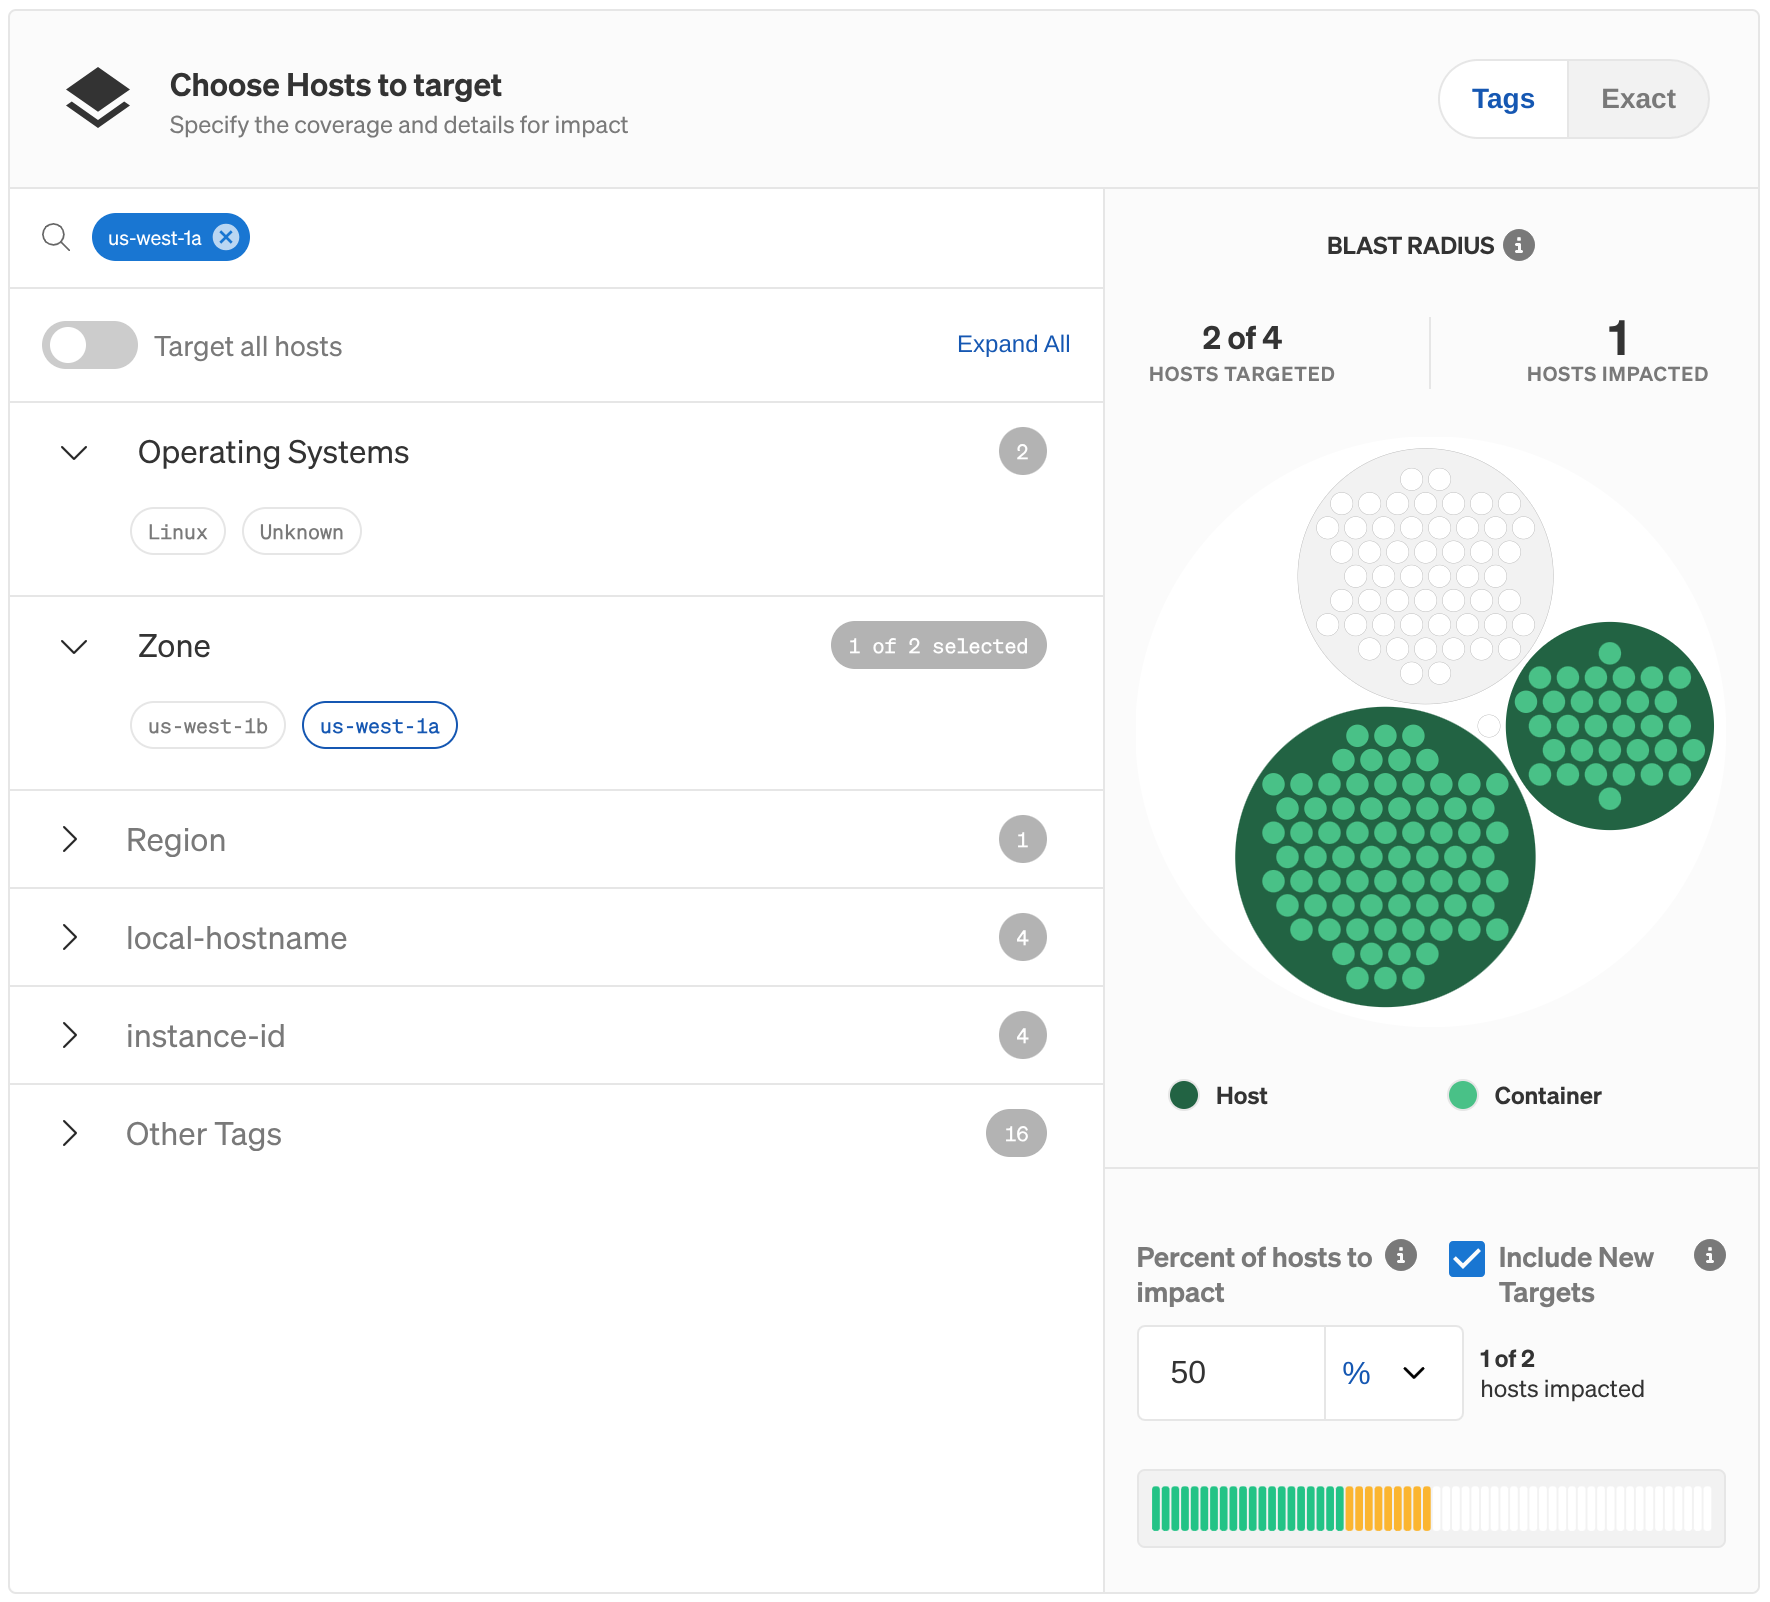
- After selecting a type, you’ll need to refine your selection to specific targets. For all three target types, you can select specific targets individually, or by using tags (or “Selectors” for Kubernetes). The default view groups targets by tag, but you can click the Exact button to switch to the individual target list.
- You can review and refine your selection further using the Blast Radius graph. The graph shows each host, container, and Kubernetes resource, and will highlight the resources that your experiment will impact. You can hover the mouse over any item in the graph to see its name.
- If you want to limit the impact to a random subset of resources, you can use the Percent to impact box. For example, if you have two hosts and set this value to 50%, Gremlin will randomly choose one of the hosts as the experiment target when the experiment is run. If you'd rather define a percentage instead of a number, use the drop-down box to switch units. See the image below for an example.
- By default, Gremlin will automatically include any newly-detected targets that match the target criteria. This is useful if, for example, your target is an autoscaling cluster and you want to include new nodes while the experiment is running. To prevent this behavior, uncheck the Include New Targets check box.
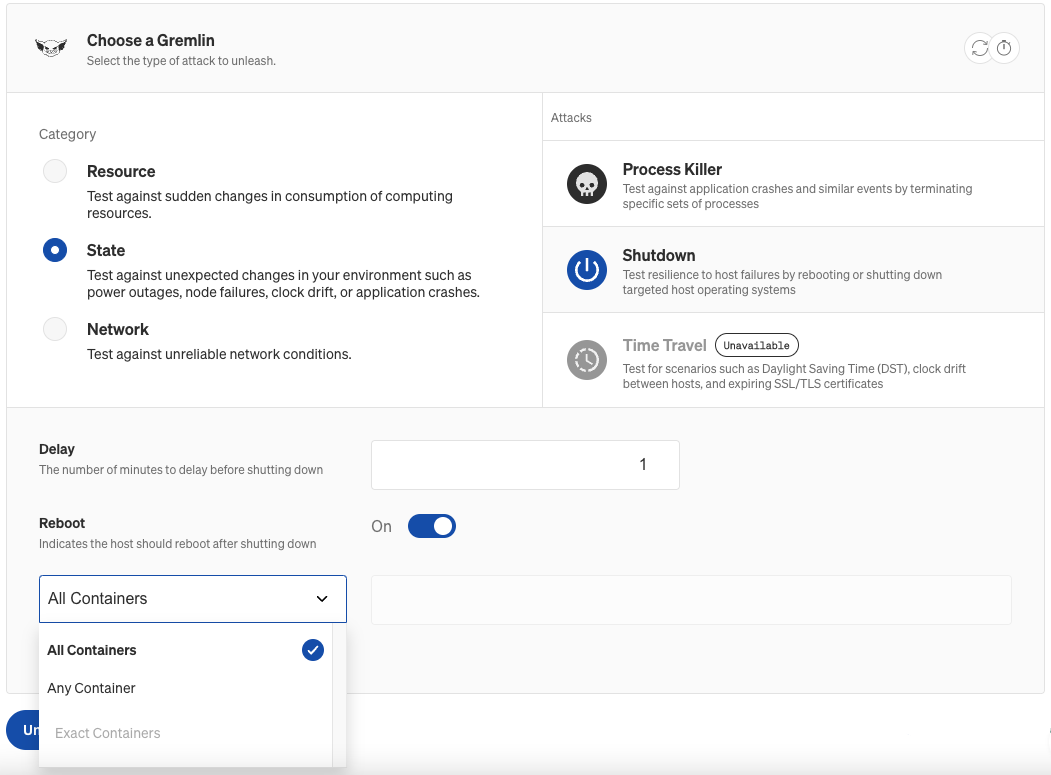
- Under Choose a Gremlin, configure the experiment that you want to run.
- Select the Category of the experiment, then click on the experiment name.
- Depending on the experiment you choose, you'll see different settings for setting up the experiment. Check each experiment’s documentation page to learn what each parameter does, and what values it allows.
- Gremlin normally requires at least one active target when starting an experiment. To run the experiment regardless of whether any active targets are available, enable the Wait for targets check box. Any targets that appear during the test will immediately join the experiment.
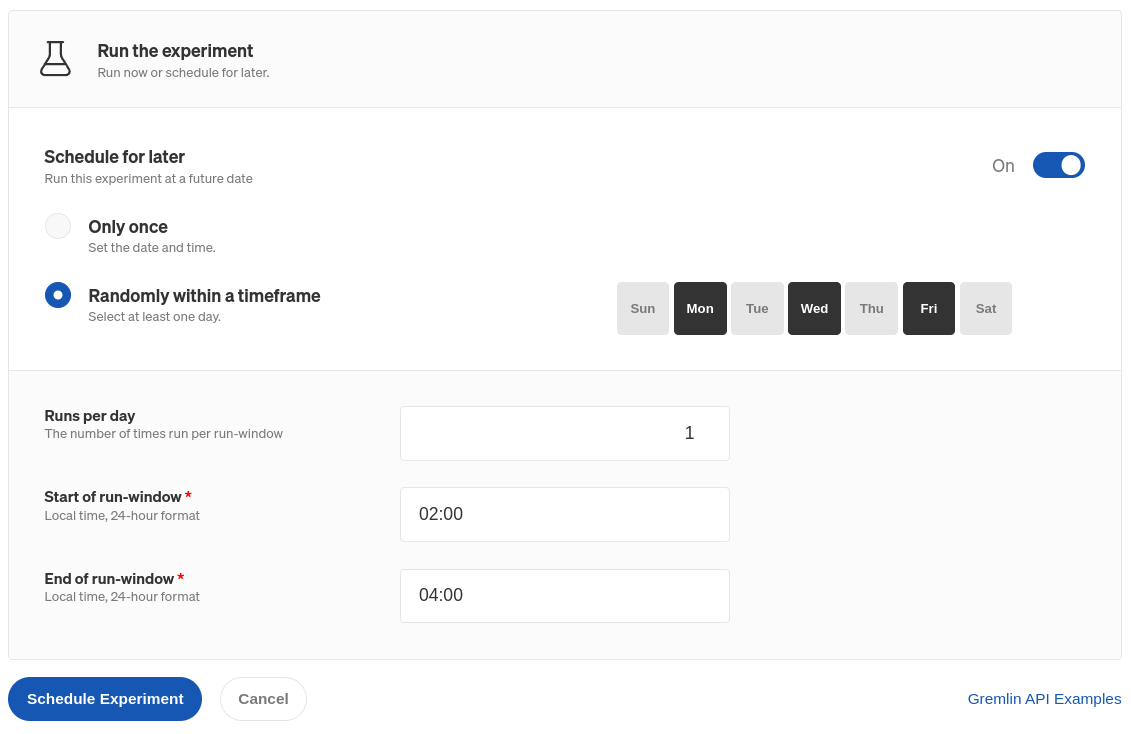
- If you want to schedule this experiment to run in the future, check the Schedule for later toggle.
- To run the experiment at one specific time, select Only once and enter a date and time.
- To run the experiment at random during a window, select Randomly within a time frame. You can choose one or more days of the week to run the experiment, how many times to run it each day, and the time window. Gremlin will select a random time during the window to run the experiment.
- Click Run Experiment to start the experiment (or Schedule Experiment to schedule it for later). After clicking Run Experiment, Gremlin brings up the experiment progress screen where you can track the progress of the experiment in real-time.
Monitoring system metrics using experiment visualizations
For certain resource experiments, Gremlin can automatically collect and display metrics from the target. This lets you quickly verify the impact of your experiment without having to open an observability tool. For CPU experiments, you can see the amount of CPU load. For memory experiments, you can see RAM usage vs. capacity. For shutdown experiments, you can see when the target went offline.

Disabling experiment visualizations
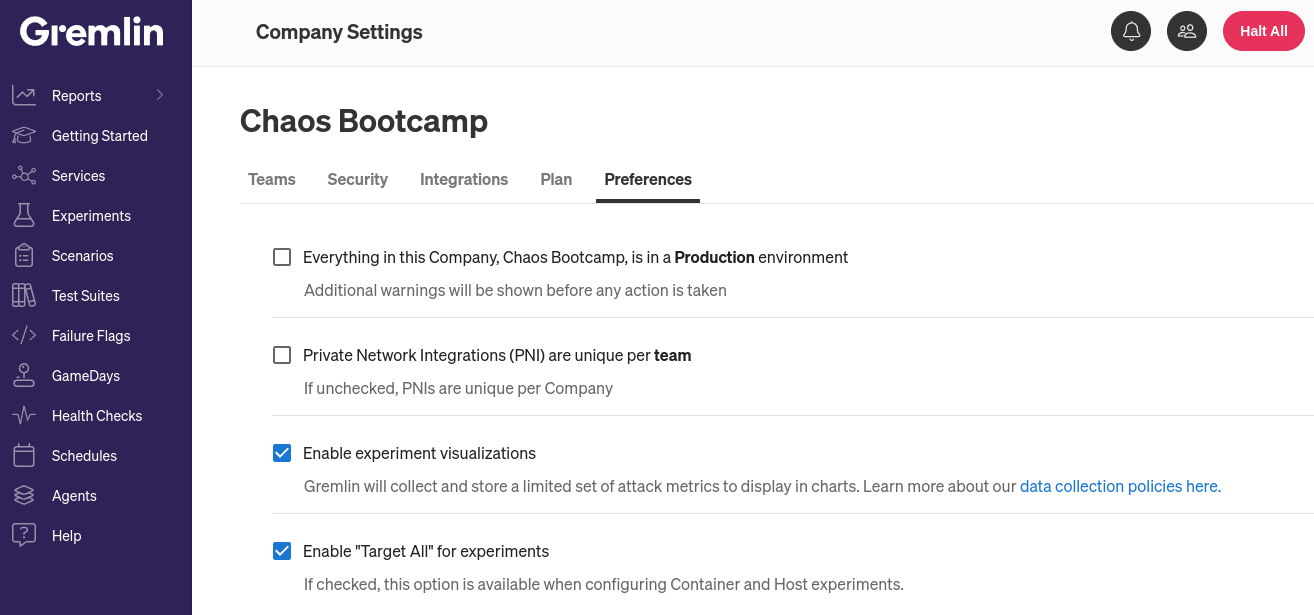
Experiment visualizations are enabled by default. Users with the Company Owner or Company Admin roles can disable them by going to the Company Settings page, clicking Preferences, and unchecking Experiment Visualizations. You can also view our data collection policy by clicking the link. Gremlin only collects metrics relevant to the experiment, and does not collect metrics when experiments are not running.
Disabling experiment visualizations for individual hosts
To prevent a host from sending metric data to Gremlin for visualization, open the configuration file for the Gremlin agent running on that host and add the line PUSH_METRICS=0. Then, restart the agent.
Scheduling experiments
Experiments can be run ad-hoc or scheduled, from the web app or programmatically. You can schedule experiments to execute on certain days and within a specified time window. You can also set the maximum number of experiments a schedule can generate.
Using agent tags
The Gremlin agent automatically detects certain metadata about the systems it’s running on. This metadata is made available in the form of tags. A tag is a simple key-value pair used to identify something about the system, like its hostname, public and private IP address, CPU architecture, and operating system. Gremlin can also find the cloud platform provider, region, availability zone, and other important information for systems running on cloud platforms like AWS.
Tags let you create groups of resources for experimentation. For example, instances in a Kubernetes cluster are automatically assigned a cluster tag with the name of the cluster as the value. Instead of having to remember which instances are part of the cluster, you can simply select the tag with the corresponding cluster name.
To learn more about tags, see Network Tags.
Creating custom tags
You can define custom tags in the agent configuration file. When configuring an experiment in the Gremlin web app, these tags will appear under the Other Tags category. For example, you can add this to your config.yaml file to create a tag with the name service and the value pet-store:
How experiments work
Every experiment in Gremlin is made up of one or more Executions. An Execution is an instance of the experiment running on a single target. An experiment can have multiple Executions if you’ve selected multiple targets to run it on.
Experiment stages
The Stage progression of an experiment is derived from the Stages of the experiment's Executions. Gremlin weighs the importance of each Execution’s Stage to determine the experiment's overall Stage.
Stages are sorted below by descending order of importance (i.e. the Running stage holds the highest importance):
As an example, an experiment with three Executions will derive its final reported stage by picking the most important stage from among its executions. So, if the three Execution Stages are <span class="code-class-custom">TargetNotFound, Running, TargetNotFound</span>, the resulting stage for the experiment will be <span class="code-class-custom">Running</span>.
Running experiments on Kubernetes
Gremlin allows targeting objects within your Kubernetes clusters. After selecting a cluster, you can filter the visible set of objects by selecting a namespace. Select any of your Deployments, ReplicaSets, StatefulSets, DaemonSets, or Pods. When one object is selected, all child objects will also be targeted. For example, when selecting a DaemonSet, all of the pods within will be selected.
Selecting containers
For State and Resource experiment types, you can target all, any, or specific containers within a selected pod. Once you select your targets, these options will be available under Choose a Gremlin on the Experiment page. Selecting Any will target a single container within each pod at runtime. If you've selected more than one target (for example, Deployment), you can select from a list of common containers across all of these targets. When you run the experiment, the underlying containers within the objects selected will be impacted.
Additional configuration options
This section lists common configuration options and how to use them. For details on experiment-specific parameters, check out the links to each experiment in the tables at the top of this page.
Running experiments without active targets
By default, Gremlin will look for active targets when starting the experiment. This requires at least one active target to be present when the experiment starts. Alternatively, enabling the Wait for targets option tells Gremlin to start the experiment regardless of whether there are any active targets. You can enable this option in the Choose a Gremlin section of experiment creation.
For example, consider a situation where you're running an application on Kubernetes, and you want to simulate an outage on its database container. Normally, you would need at least one instance of the database container available to run an experiment. With **Wait for targets** enabled, Gremlin will run the experiment even if no database instances are available. If an instance becomes available during the experiment's runtime, it will immediately join the experiment.
This option requires the "Include New Targets" option to be enabled, which you can find in the "Choose objects to target" section, under "Blast Radius."
Including new targets in ongoing experiments
When selecting targets by tag, you have the option to check the Include New Targets checkbox. When this is checked, any newly-detected targets that meet the experiment's selection criteria will join the experiment. By default, new targets won't run the experiment, even if they match the criteria.
For example, imagine you want to run a CPU experiment on all EC2 hosts in the AWS us-east-1 region. When you run the experiment, AWS detects the increased CPU usage, automatically provisions a new EC2 instance, and installs the Gremlin agent. If Include New Targets is checked, Gremlin will add this new instance to the ongoing CPU experiment.
Specifying multiple network addresses and ports
You can specify multiple network addresses and ports using a comma-separated list. For ports, you can specify ranges by adding a dash between the lowest number and the highest number in the range (e.g. 3000-4000). This also applies to experiments run via the REST API and CLI.
If you specify network addresses and ports, Gremlin applies each port number to each address. For example, if you add api.gremlin.com and app.gremlin.com to the hostnames field, and 80 and 443 to the ports field(s), Gremlin will impact traffic to api.gremlin.com:80, api.gremlin.com:443, app.gremlin.com:80, and app.gremlin.com:443.
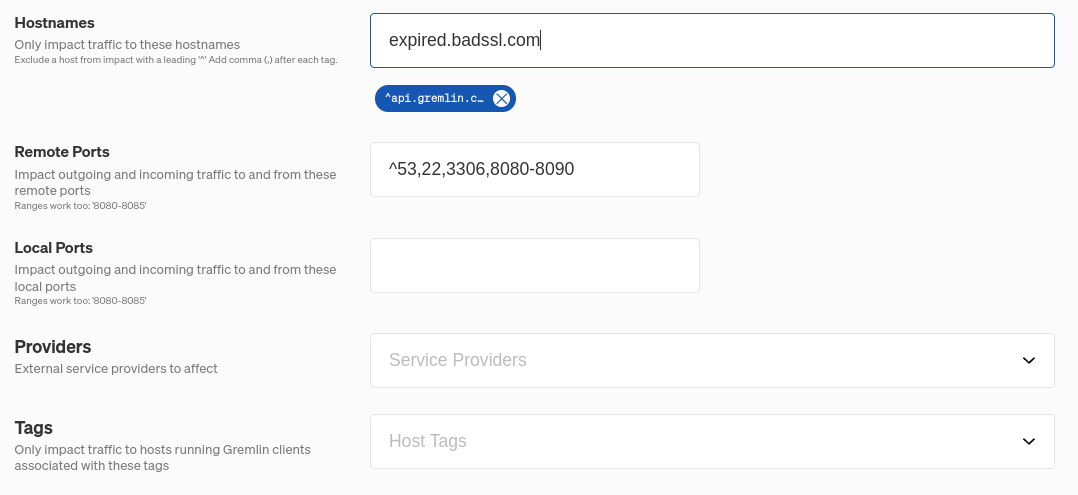
Excluding network addresses and ports
To exclude a hostname, IP address, or port from an experiment, add a caret ^ directly in front of it. For example, in the above screenshot, ^53 prevents DNS traffic from being impacted. This also works for ranges and CIDR values.
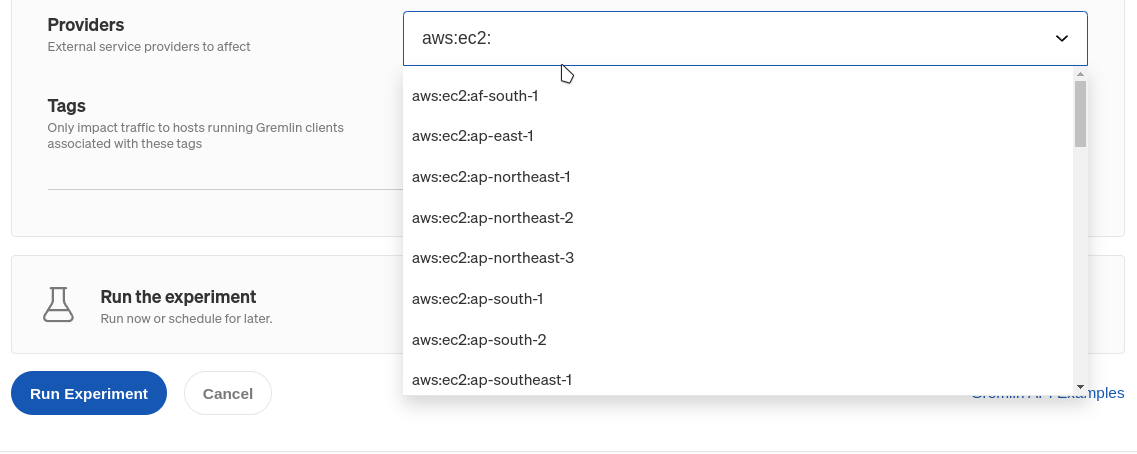
Targeting traffic to network provider services
For network experiments, Gremlin includes an easy way to target network traffic going to and from third-party service providers. When configuring a network experiment, click on the Providers drop-down and look for the service you want to impact. You can also search for services by typing in the box.
Specifying which network device to use during network experiments
All network experiments accept a --device argument that refers to the network interfaces to target. Starting with Linux agent version 2.30.0 / Windows agent version 1.9.0, you can specify one or more network interfaces using either a comma-separated list or with multiple --device arguments.
When unspecified, Gremlin targets all physical network interfaces as reported by the operating system. For virtual / cloud machines that typically includes the expected network interfaces like eth0 and eth1 for Linux and Ethernet for Windows.
Device discovery on older agents
Agents before Linux version 2.30.0 / Windows version 1.9.0 use a different strategy described here. All network experiments accept a --device argument that refers to the network interface to target. Gremlin network experiments target only one network interface at a time. When unspecified, Gremlin chooses an interface according to the following order of operations:
- Gremlin omits all loopback devices (determined by RFC1122).
- Gremlin selects the device with the lowest interface index that starts with
eth,en, or for Windows,Ethernet. - If nothing is found, Gremlin selects the device with the lowest interface index that is non-private (according to RFC1918).
- If nothing is found, Gremlin selects the first device with the lowest interface index.
Examining experiment executions
You can view the full timeline of a Gremlin experiment for detailed analysis and troubleshooting. To learn more, see Viewing experiment execution details.
Agent failsafe behavior
The Gremlin agent has several failsafe mechanisms that will automatically trigger if something goes wrong. This section explains how the agent failsafe works while an experiment is running.
How the agent heartbeat works
The agent always maintains a connection to the Gremlin Control Plane (api.gremlin.com) by sending a heartbeat every 10 seconds over TLS (port 443).
Active agents
The agent is considered Active as long as the following criteria are met:
- The agent successfully checks in every 10 seconds. This decreases to every 5 seconds during an experiment.
- Gremlin responds to the check-in with an HTTP 200 status code within the connection timeout (15 seconds for the agent to connect, and 15 seconds for Gremlin to respond).
The agent automatically retries connecting once on transient errors, such as connection resets, timeouts, or temporary server errors (HTTP 502, 503, and 504 errors). Any other outcome counts as a failed check-in.
Inactive agents
The agent is considered Inactive if 5 minutes have passed since the last successful check-in (30 minutes for private network agents). Inactive agents cannot run tests or experiments and will be automatically removed from the agent list after 24 hours of inactivity.
How the agent handles lost connections
If the agent loses connection to the Gremlin Control Plane, it will automatically fall back to a safe, idle state. The connection is considered lost if three (3) or more of the last five (5) check-ins failed. This allows for grace periods so that agents don’t immediately roll back experiments after a single missed check. If this happens, the agent will automatically:
- Halt all running experiments and undo their impact.
- Change each experiment’s state to
LostConnection. - Cache each experiment’s state, logs, and other details to send to the Control Plane once connection is reestablished.
How the agent handles shutdowns and unexpected terminations
Experiments are designed to fail safe, but an unexpected agent shutdown can have different outcomes:
- If the agent receives a shutdown signal (e.g.
SIGTERM), it will gracefully shutdown by halting any running experiments and reverting their impact before exiting. These experiments will show in the Gremlin web app in theClientAbortedstate. - If the agent is forcefully terminated (e.g.
SIGKILL), experiments will continue running independently for their set duration and will revert when the duration expires. If the agent restarts before the experiment finishes, it will reconcile those experiments with Gremlin and clean them up if necessary.
Exceptions
The Shutdown and Process Killer experiments cannot be rolled back, as they make irreversible state changes.