Running Chaos Experiments on Confluent Platform and Apache Kafka

.svg)
.svg)

 This is an older tutorial
Introduction
Apache Kafka is a data streaming pipeline popular for its low-latency, high-throughput, distributed architecture. With systems becoming more decentralized and applications handling ever-increasing amounts of data, Kafka has become a crucial backbone for many organizations. And while Kafka is designed to withstand common production failures like node outages, we can’t be absolutely confident in its resilience unless we have a way to test it.
With Chaos Engineering, we can test the reliability of our Kafka clusters by seeing how well they stand up to failures. We can see exactly how the cluster routes around broker failures, how network latency affects message throughput, and even how the cluster responds to a ZooKeeper outage. By testing these conditions now, we can implement fixes that will make our Kafka cluster and applications more resilient in production.
In this tutorial, we’ll show you how to proactively test your Kafka cluster using Chaos Engineering. We’ll demonstrate this using Gremlin and Confluent Platform 5.5.0, which adds several enterprise features to Kafka. By following this tutorial, you’ll learn how to:
- Install Gremlin onto your Confluent Platform nodes.
- Learn how to create and run attacks in Gremlin.
- Design and execute chaos experiments on the Confluent Platform.
- Observe the impact of your experiments for the purposes of fixing problems.
Take a deeper dive into Chaos Engineering for Kafka
Learn about 4 common Kafka failure modes and how to design chaos experiments to test against them.
Prerequisites
For this tutorial, you’ll need:
- A self-managed Confluent Platform cluster.
- ~Note: self-managed is necessary for installing the Gremlin agent, which requires server-level access. If you’re using a managed environment, like Confluent Cloud, you might not have this access. If you want to set up a test environment, we recommend using the Ansible Playbooks provided by Confluent, or Jordan Moore’s cp-ansible-vagrant project to create a virtualized cluster. Confluent also provides Helm charts for Kubernetes, which you can easily deploy along with the Gremlin Helm chart.
- An application to generate data. We used the Kafka Music demo application.
- ~Note: this application requires Docker and Docker Compose.
- A Gremlin account (request a free trial).
Our example cluster consists of:
- 2 Apache ZooKeeper nodes.
- 3 Apache Kafka broker nodes.
- 1 Confluent Schema Registry node.
- 1 Kafka Connect node.
- 1 Confluent Control Center and Confluent REST Proxy node.
Step 1 - Retrieve Your Team ID and Certificates
First, we need to install Gremlin onto our cluster. We need our Gremlin Team ID and secret. If you already know what these are, you can skip to step 2. Otherwise, log into the Gremlin web app and continue following these instructions.
Open the drop-down menu on the top right of the page, then select “Team Settings”. On the Teams screen, click on “Configuration”:

Make a note of your Team ID.
If you don’t know your Secret Key, you will need to reset it by clicking the Reset button. You’ll get a popup reminding you that any running clients using the current Secret Key will need to be configured with the new key. Hit Continue.
Next you’ll see a popup screen that will show you the new Secret Key. Make a note of it.
Step 2 - Install Gremlin onto your Confluent Platform cluster
Next, we need to install Gremlin onto our nodes. If you are using Ansible, you can use the Gremlin Ansible role to easily deploy Gremlin across your cluster. Otherwise, follow the instructions in our installation documentation.
Once you’ve installed Gremlin, log into your Gremlin account and open the Clients page to verify that your nodes are reporting to the Gremlin Control Plane. Note that your client names will vary depending on whether you set the identifier variable during installation.

Optional Step: Install the Gremlin Docker Container
The demo application that we’re using for this tutorial runs on Docker. If we want to run attacks directly on the application and not just the cluster, we can do so by installing the Gremlin Docker agent. This is an optional step, but we recommend trying it so that you can see first-hand how to run attacks on containers.
To install the Gremlin Docker agent, run the following command on your Docker host. Make sure to replace [your Gremlin team ID] and [your Gremlin secret] with their respective values:
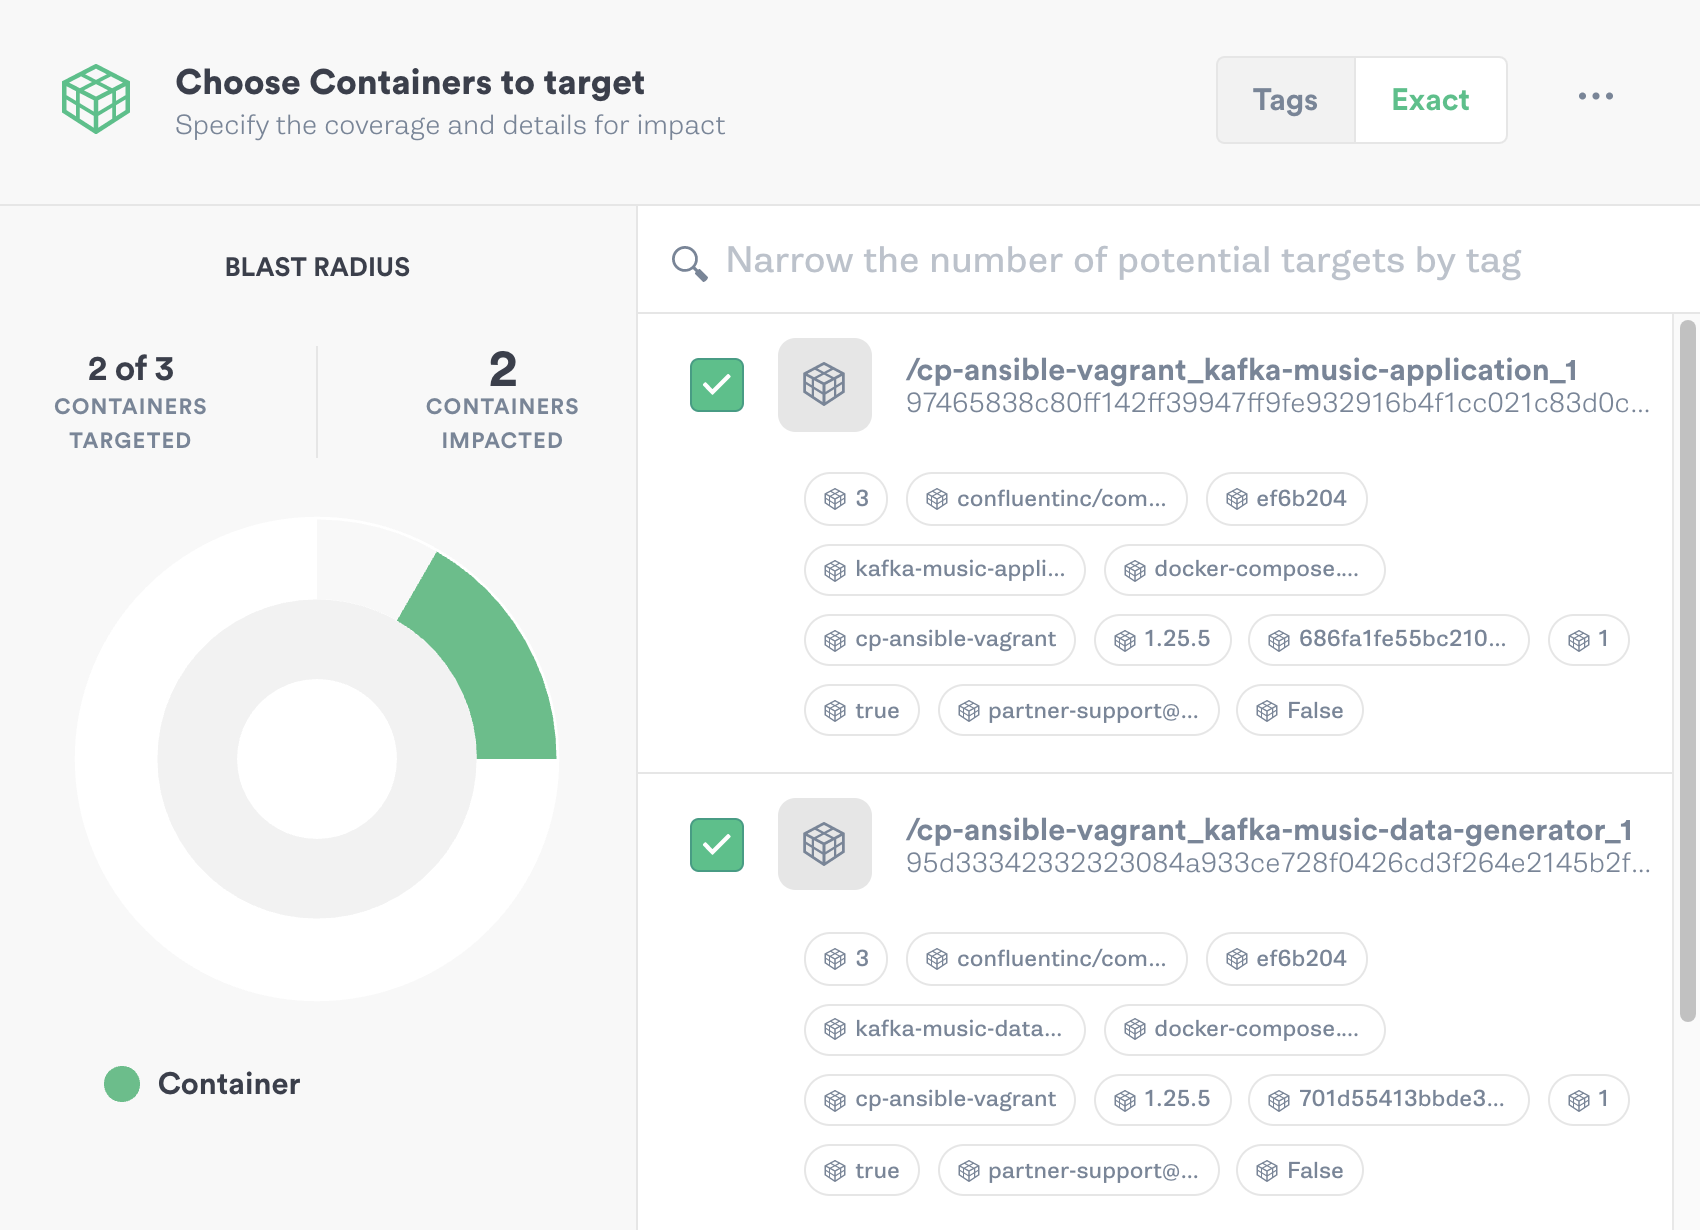
Gremlin will automatically detect other containers running on the host and register them with the Gremlin Control Plane. We’ll then be able to target them for attacks:
Step 3: Run a Blackhole Attack using Gremlin
Now that we’ve finished setting up, let’s run an attack! But first, we should frame our attack around a chaos experiment.
One of the most common concerns with running Kafka is recovering from a broker failure. Brokers are responsible for receiving messages from producers and storing them until they can be fetched by a consumer. Messages are organized into topics, which can be replicated across multiple brokers. This serves two functions: it provides redundancy, and it lets us scale out horizontally so that multiple consumers can read from a single topic. For our experiment, we want to observe the impact that a broker failure has on message throughput, topic availability, and data integrity.
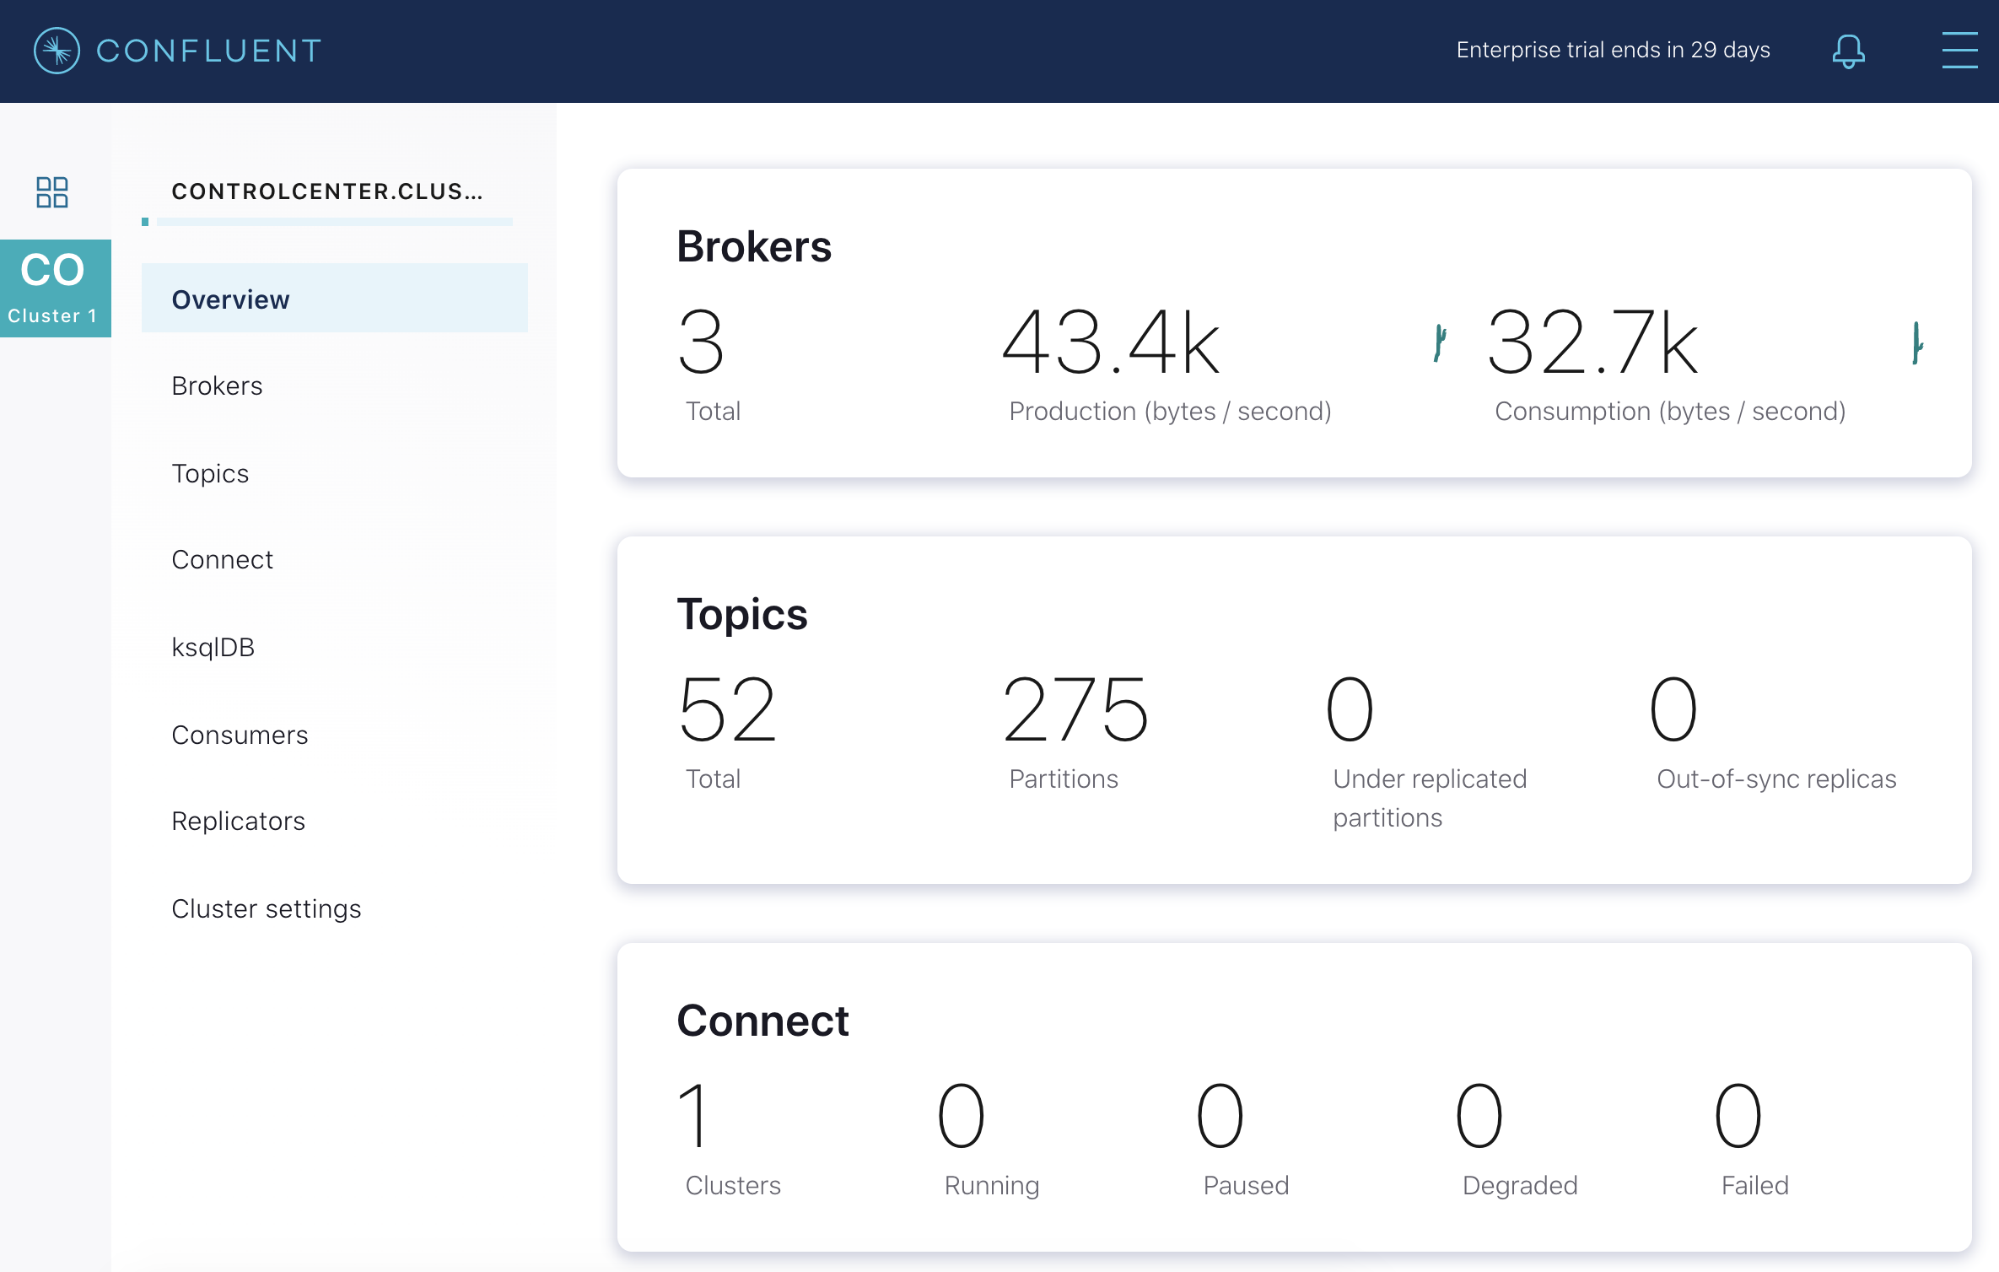
In our example cluster, we have three broker nodes managing two topics. Both topics have a replication factor of three, meaning they are replicated across all three nodes. If we take a look at our Confluent Control Center, we see that everything is in a healthy state. We’re averaging 43.4 kB of data produced per second, and our consumers are ingesting 32.7 kB. All of our topic partitions are online and replicated, and our latency is reasonably low.
Losing one or even two brokers shouldn’t pose a problem for us as long as our topic partitions are fully replicated. To verify this, we’ll use a Blackhole Attack to drop all Kafka-related traffic to our primary broker. While the attack is happening, we’ll keep an eye on Confluent Control Center to visually measure the impact on our cluster. We want to see how quickly Kafka identifies the failure, how it works around it, and how this impacts our throughput.
First, log into the Gremlin web app and select “Create Attack”. Select “Hosts”, then find and select your primary broker. Next, scroll down to “Choose a Gremlin”, select “Network”, then select “Blackhole”. To give Kafka enough time to detect the unhealthy broker, increase the attack time from 60 seconds to 600 seconds (10 minutes). This also gives us more time to directly observe the impact on pipeline integrity and throughput.
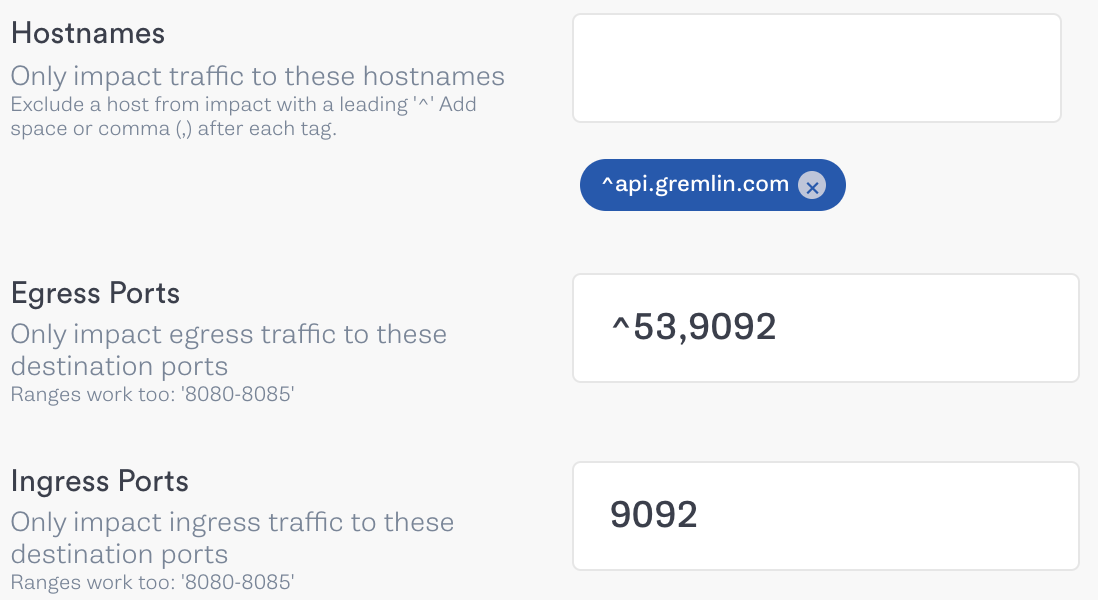
Our primary broker communicates over port 9092, so we’ll add this to both the “Egress Ports” and “Ingress Ports” fields.
Next, click “Unleash Gremlin” and wait for the attack to start. Once the attack is in the Running stage, we’ll take a quick look at our demo application’s output. Right away there’s a problem. Our consumers are trying to write to the broker, and since it’s no longer available, our terminal gets bombarded with error messages:
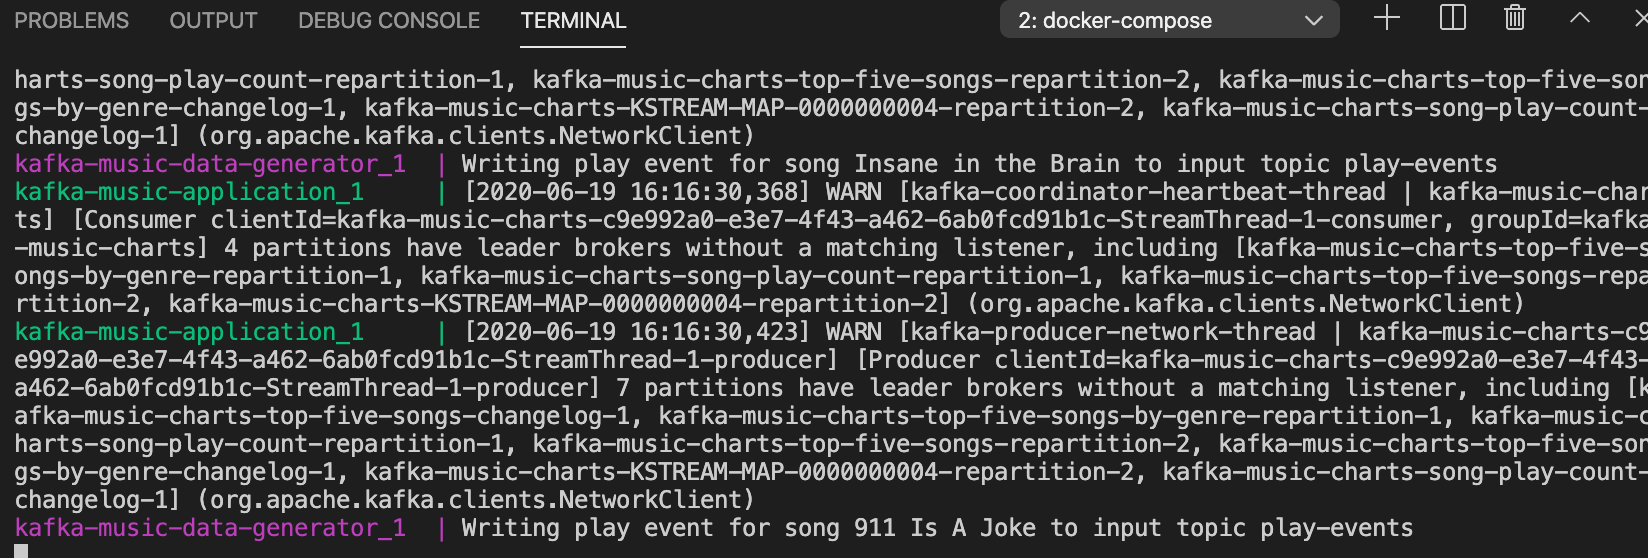
However, after a few moments our producers should recognize that the broker is unavailable and redirect messages to another broker, returning the output to normal:

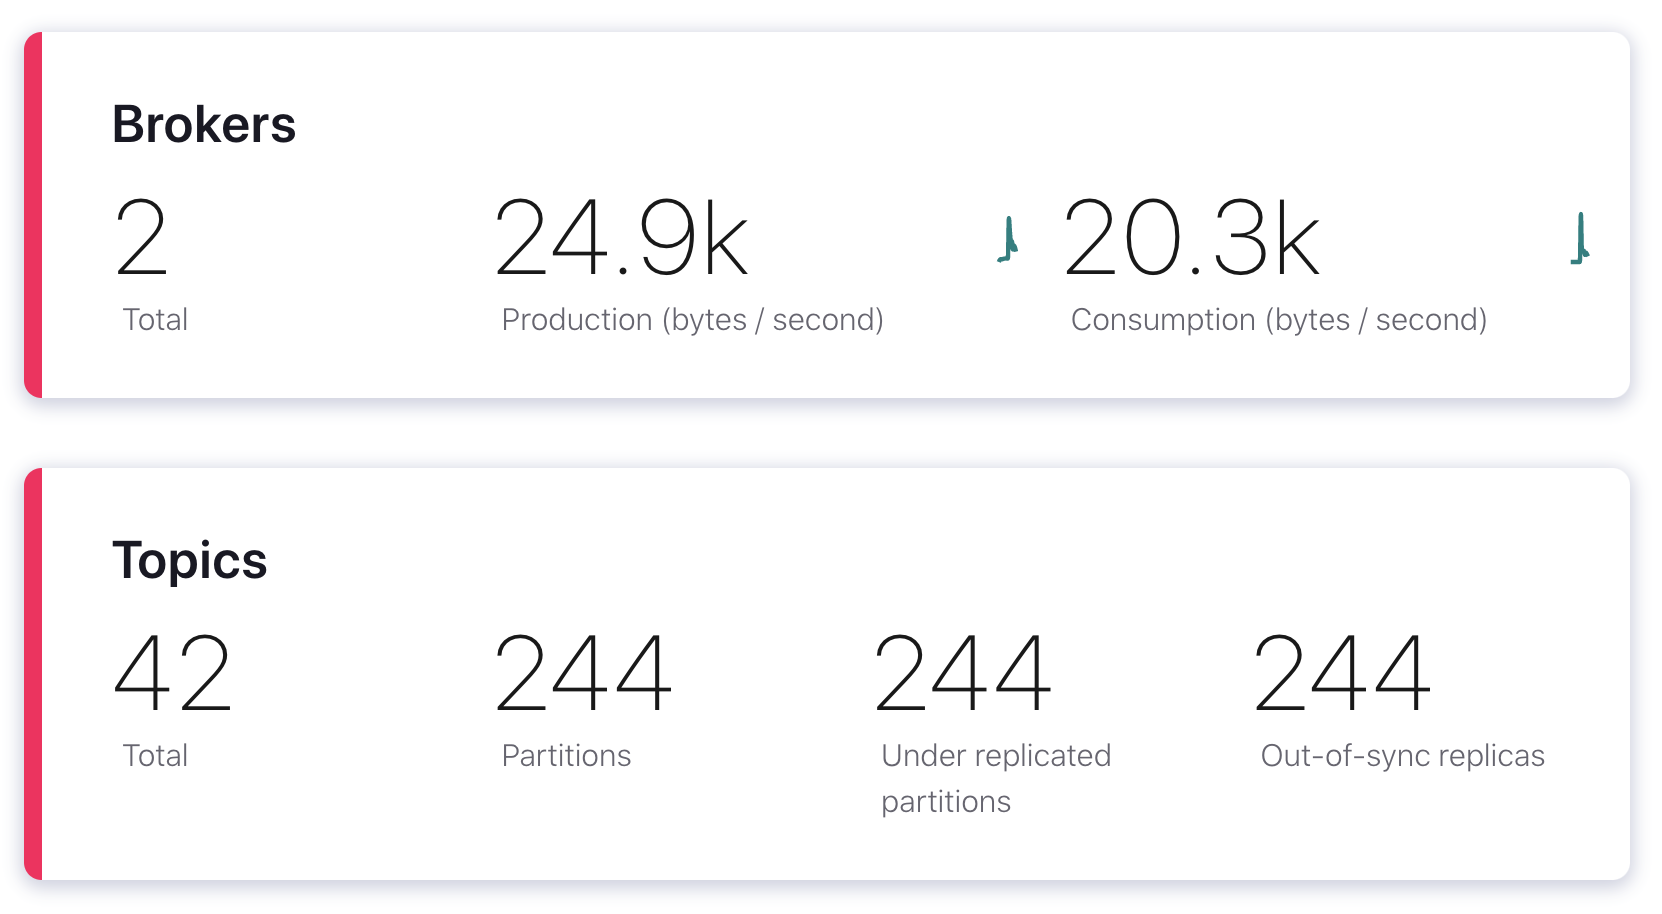
Now let’s go back to the Confluent Control Center and open the Overview page. Looking at the broker count, we now see a red line and two brokers instead of three. We have 244 under-replicated partitions, and our throughput dropped by nearly half, from 45 kB in and 34.1 kB out to 24.9 kB/s in and 20.3 kB/s out.
We also observed an event that isn’t shown in this screenshot: a controller re-election. A controller is a broker that’s responsible for handling different broker-related events, including broker failures. Each cluster has only one controller, and since the broker we just blackholed was our controller, Kafka had to elect a new controller. Fortunately, this happened so quickly that Control Center is already reporting the new controller as active, but it’s something we should still be aware of.
Once the attack ends (either by waiting for the attack to end automatically or by clicking the “Halt” button in the Gremlin web app), the broker will have its normal traffic resume over port 9092, it will rejoin the cluster, and the cluster state should return to normal.
Results
What does this experiment tell us? Well, we confirmed that both our cluster and application will continue working even during a broker failure. We know that our producers and consumers will automatically fall back to a healthy broker and continue processing data, albeit at a slower rate. We verified that if a controller fails, Kafka will quickly and reliably elect a new controller.
From here, we should consider how to prevent or mitigate this problem in production. For example, we could increase our replication factor to allow for more broker failures before we lose access to our data. We could add additional brokers to reduce the impact of any one failing. Lastly, we should set up a monitoring and alerting system to notify us as soon as a broker failure is detected. Then, to make sure our changes are having a positive effect, we can repeat our experiment and increase the blast radius to multiple brokers instead of just one.
Conclusion
Congratulations on running your first chaos experiment on Kafka! By following this tutorial, you’ve successfully:
- Installed the Gremlin agent onto your Kafka nodes.
- Designed and executed a chaos experiment.
- Observed the impact of your experiment on your Confluent Platform cluster and applications.
From here, think about how you’d like to test your Kafka cluster further. Think about the different ways your cluster can fail in a real-world environment, and start building attacks that simulate those conditions. Here are some ideas to help you get started:
- Use a Blackhole Gremlin on one of your ZooKeeper nodes and verify that the cluster remains operational.
- Use a Blackhole Gremlin on a majority of your brokers or ZooKeeper nodes to test for session timeout, data loss, or split brain clusters.
- Use a Latency Gremlin to add network latency between your producers, consumers, and brokers, and measure the impact on performance and data integrity.
- Use a Resource Gremlin to stress your broker nodes and measure the performance impact
- Use a Time Travel Gremlin to change the system time on a broker and see how that affects replication. This is useful for testing the windowstore.changelog.additional.retention.ms setting, which is supposed to account for clock drift.
Ready to run more experiments on Kafka? Download our guide of step-by-step tutorials, The first 4 chaos experiments to run on Apache Kafka.
Avoid downtime. Use Gremlin to turn failure into resilience.
Gremlin empowers you to proactively root out failure before it causes downtime. See how you can harness chaos to build resilient systems by requesting a demo of Gremlin.

.svg)