How to safely run experiments with Gremlin’s Status Checks and Datadog Monitoring


.svg)
.svg)

 This is an older tutorial
Chaos Engineering experiments are controlled, precise attacks designed to reveal weaknesses in our systems. Once your hypothesis is proven or a bug is found, there is no need to continue the attack. If you’re checking your monitoring and alerting, or scheduling scenarios or running them as a part of your pipeline, adding Status Checks is a great way to automatically halt and rollback any impact of an experiment without human intervention. Using Scenarios, we can string together a series of attacks that get close to a set monitor, then halt the attack when the monitor is triggered. This will help us ensure that we’ve set the right monitor for our use case.
Prerequisites
- A Gremlin account (request a free trial)
- A host with both a Gremlin agent and Datadog agent installed
Step 1: Get your Datadog API Key and Application Key
We need API and Application keys to programmatically access our Datadog monitor endpoint. Head over to https://app.datadoghq.com/account/settings#api and create an API Key, Create an Application Key. You’ll need Standard or Admin permissions. Save those for Step 3.
Step 2: Create a Datadog Monitor
We need to create a monitor to watch for high CPU utilization. In Datadog, in the left navigation bar go to Monitors -> New Monitor. Select “Metrics” as the type of monitor. Set the metric to <span class="code-class-custom">system.cpu.idle </span>and select your host. Set the monitor to trigger when the metric is <span class="code-class-custom">below</span> the threshold <span class="code-class-custom">at least once</span> during the last <span class="code-class-custom">1 minute</span>, and set the threshold to <span class="code-class-custom">60</span>%. This will trigger an alert if the idle CPU drops below 60%, or, in other words, if usage increases above 40%. This is a very sensitive alert, so tune this according to your internal response needs to avoid noisy alerts. Most of the time, using an average over the past 1, 5, 10 minutes will be sufficient to not have too noisy of alerts and still alert in time to catch an issue.
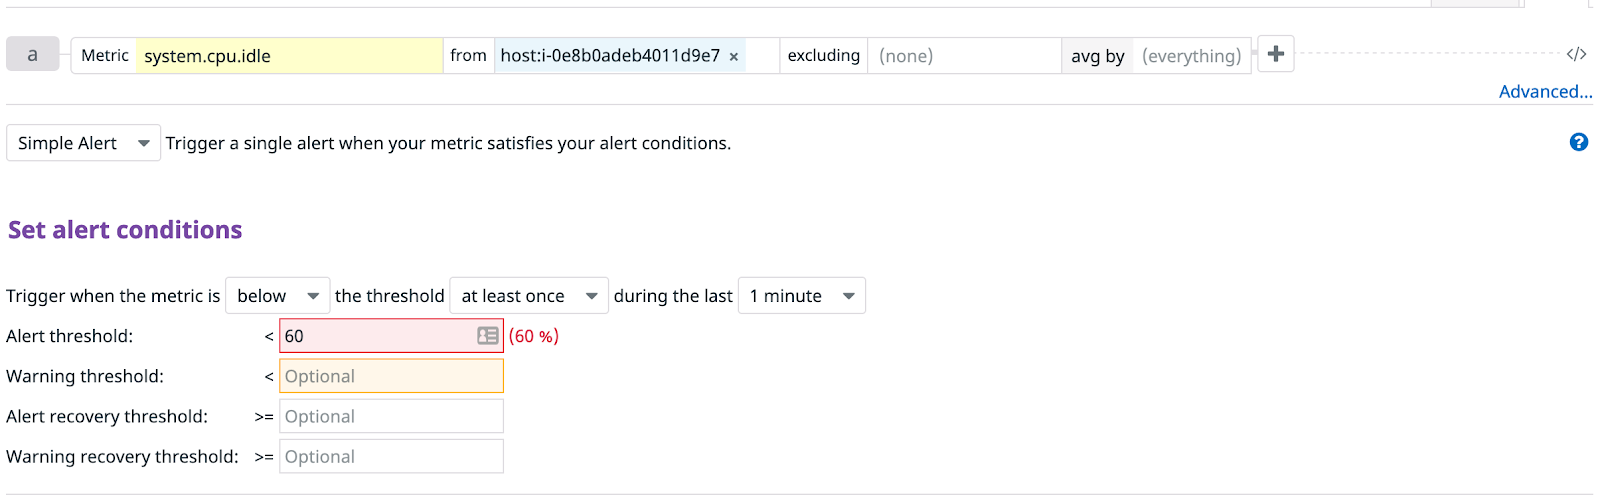
Take note of your idle CPU level for Step 3. For example, Datadog is showing an idle usage level of 10.85%.
Click “Save” and then click “Export Monitor” and select the monitor id. For example, this monitor id was <span class="code-class-custom">22683435</span>.
Step 3: Create a Gremlin Status Check
For the next few steps, you can instead customize this recommended scenario with your own monitor_id, API Key, and Application Key. Then fill in the JSON tag with the information below.
In Gremlin, we’ll add a Status Check to our Status Check library so we can reuse it for future Scenarios or as a template for new Status Checks. We’re going to create a status check to test our Datadog monitor. This will automatically halt any attack if the monitor is in “alert” status.
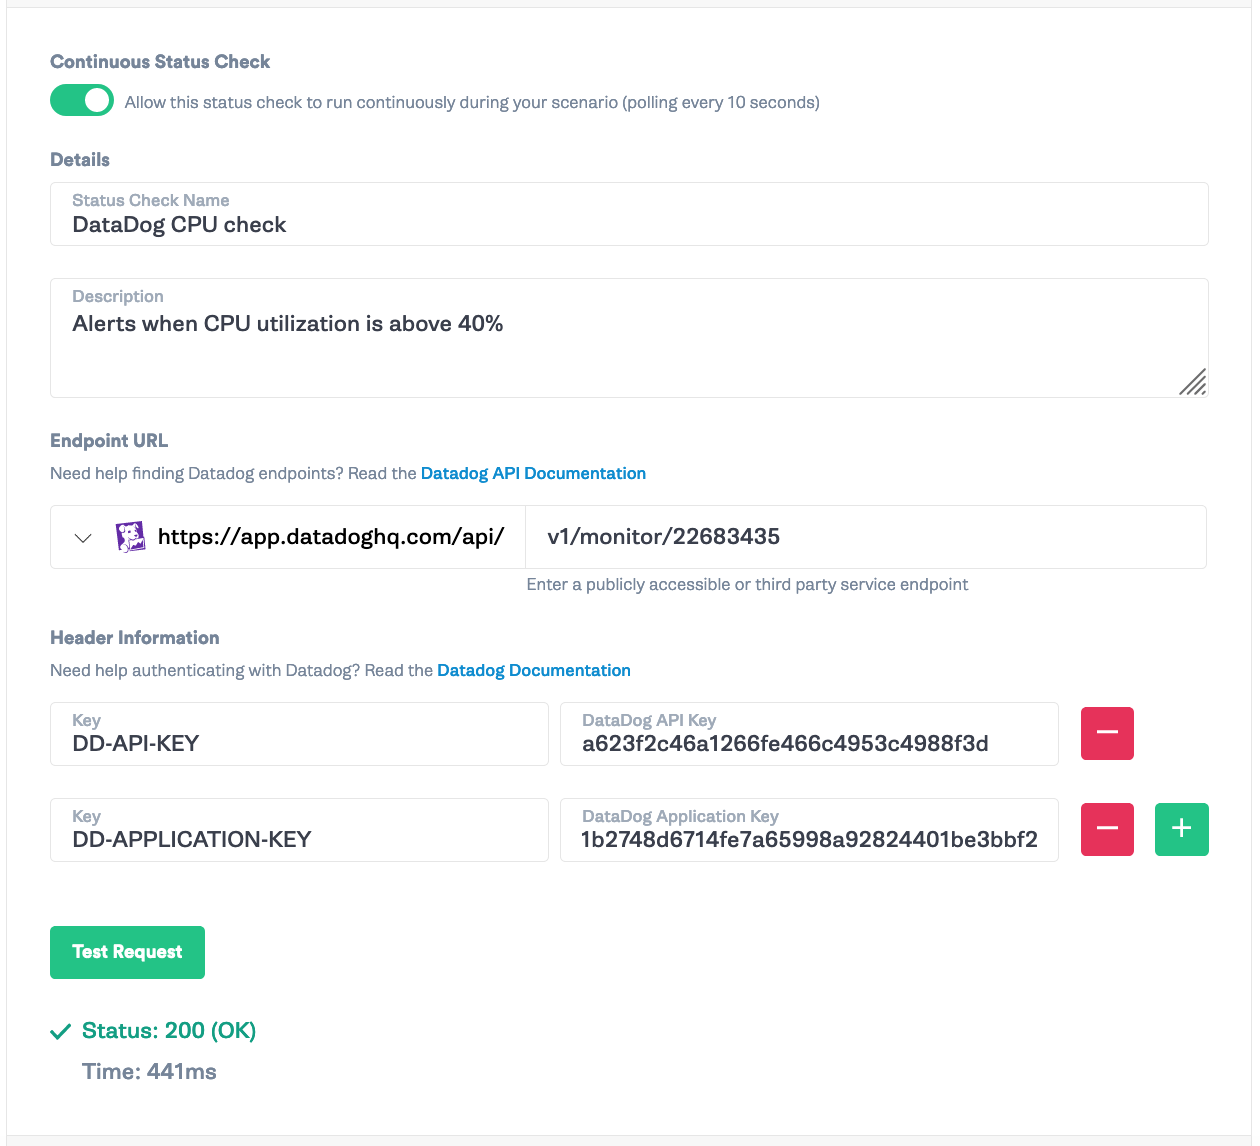
Go to https://app.gremlin.com/health-checks/list and click “New Status Check”. Turn on Continuous Status Check that will check with the Datadog every 10 seconds for a change in status. Give the Status Check a name and description. Add <span class="code-class-custom">v1/monitor/{monitor_id}</span> and your API and Application keys. Then, click “Test Request” and make sure you get a 200 response.
Next, leave the healthy status code at <span class="code-class-custom">200</span>, but change the request timeout to <span class="code-class-custom">1500</span>. This gives Datadog a little more time to respond. Set the healthy response body criteria to <span class="code-class-custom">overall_state</span> String = OK. Gremlin will check the response JSON for that body key value pair. If the key value pair is different, for example, if the value is “Alert”, the Status Check will halt the attack.
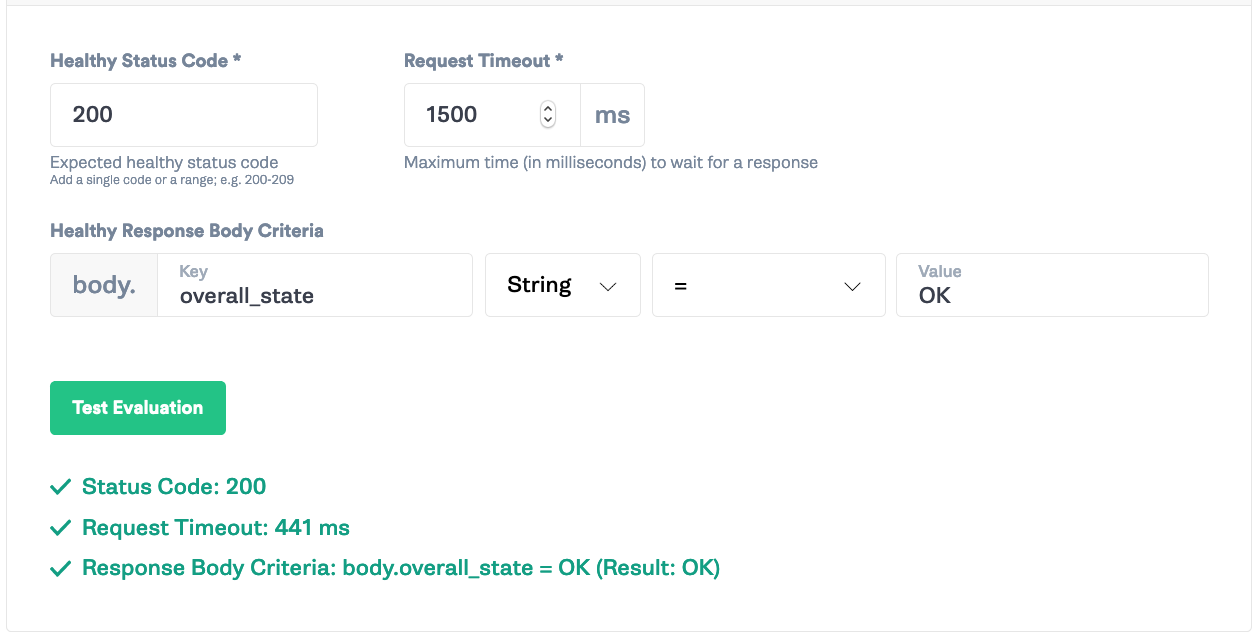
Click “Test Evaluation” and “Save”.
Step 4: Create a Gremlin Scenario
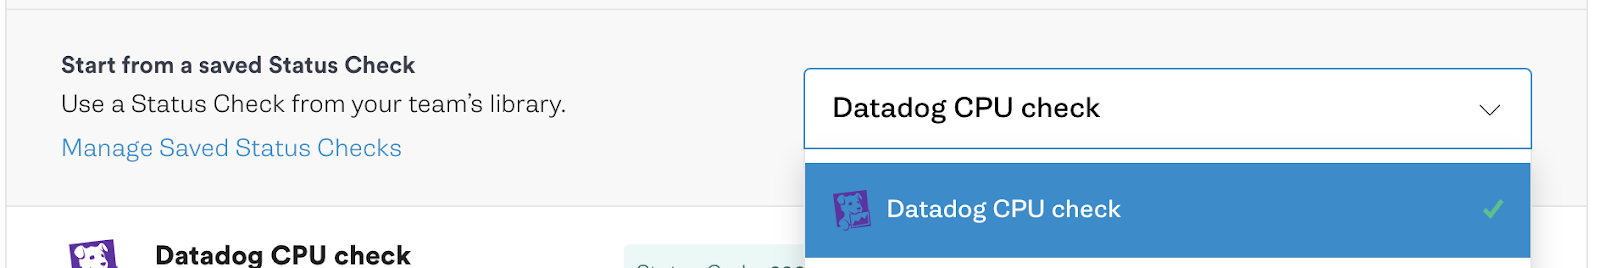
Next, we’re going to add that Status Check to a Scenario with a progression of CPU attacks below and above the threshold. Go to “Scenarios” or https://app.gremlin.com/scenarios/my-scenarios. Click “New Scenario”. Give the Scenario a name and description. Click “Add a Status Check”, choose the Status Check you made in Step 3 and click “Add to Scenario”.
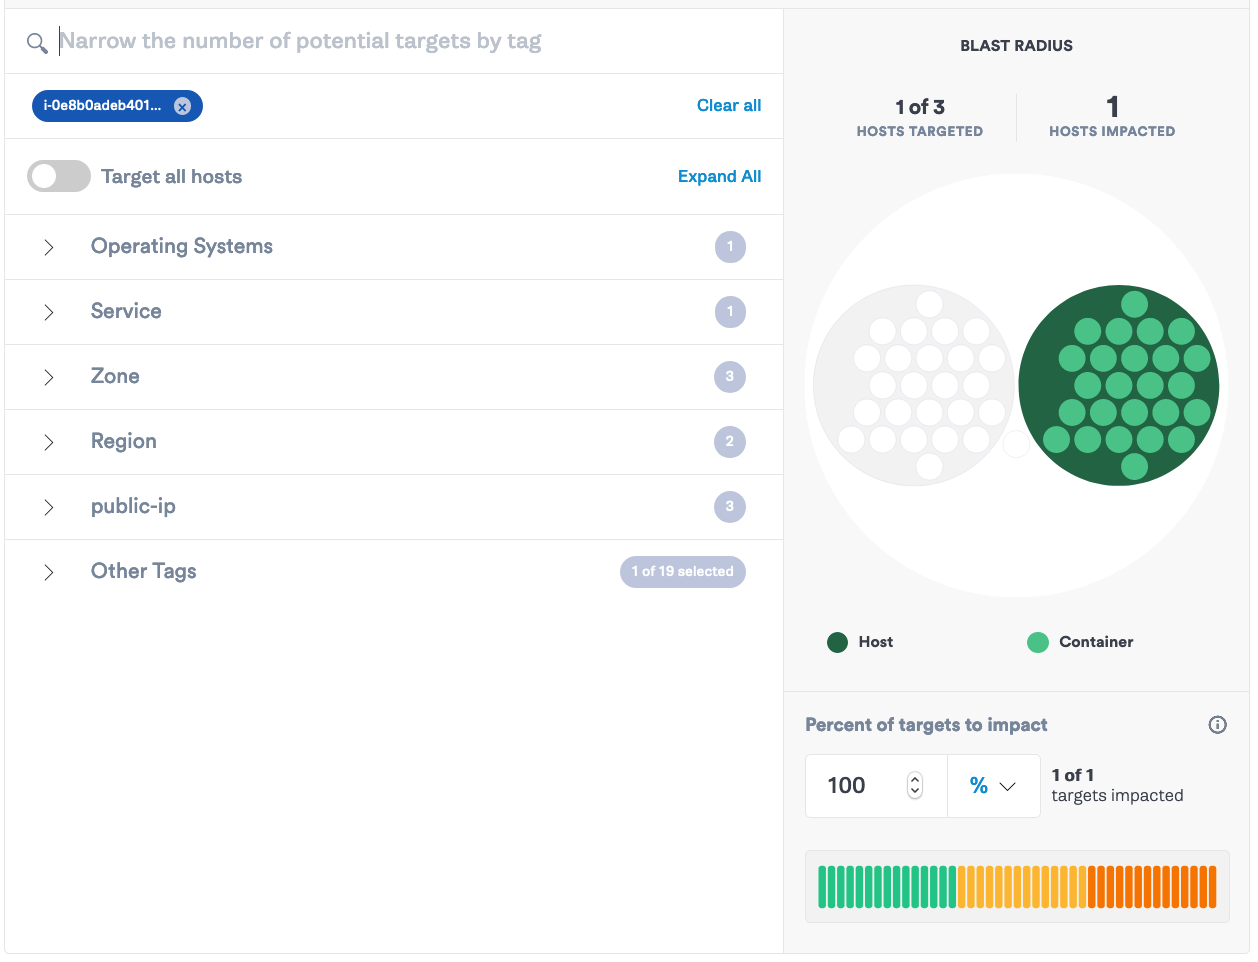
Select “Add a new attack” and select the host that Datadog is monitoring.
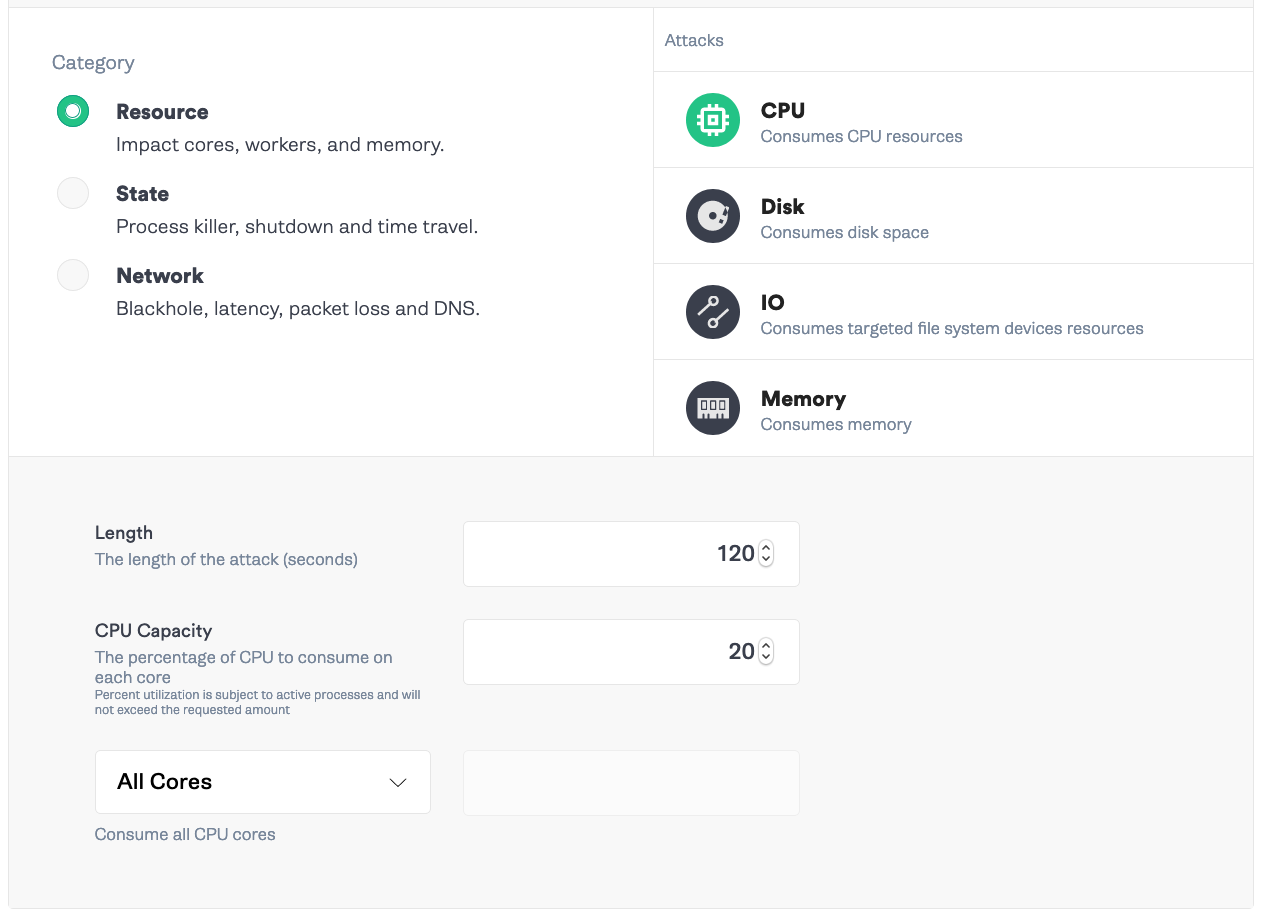
Next, select “Choose a gremlin” and select Resource -> CPU. Set the length to <span class="code-class-custom">120</span> seconds and the capacity to <span class="code-class-custom">20</span>% (30% - 10% pre-attack usage from Step 2) and select <span class="code-class-custom">All Cores</span> and “Add to scenario”.
Next, click “Add a new attack”. The same target and configurations of the previous step will be populated. Adjust the CPU Capacity to <span class="code-class-custom">40</span>% and click “Add to Scenario”.

Finally, add one more attack with <span class="code-class-custom">60</span>% CPU Capacity and click “Add to Scenario”. Click “Save Scenario”.

Step 5: Run the Scenario and watch the results
Next, we’ll run the scenario and see if our alerting fires. Click “Run Scenario”. After about 3 minutes, Gremlin will run through the first attack, then the Status Check will halt the second attack when utilization is above that 40% threshold.

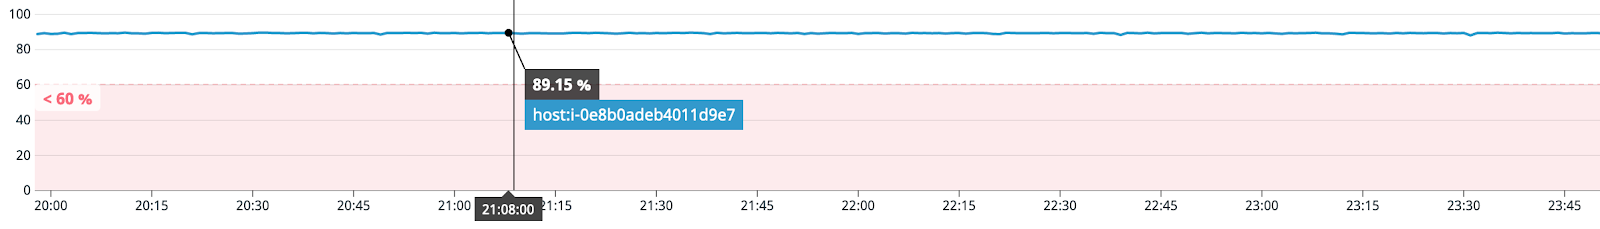
We can see that Gremlin halts the attack before it reaches the 60% attack. Looking at Datadog, we can see the charting where the first attack did not breach the threshold, but the second attack did.

Conclusion
You’ve now added a scenario with a Status Check! Try out a few different Status Checks with different monitoring alerts from Datadog, such as error rates or latency thresholds. This is a great mechanism to test your alerting and also a great safety mechanism to ensure that attacks stop when an impact is noticed. This allows you to comfortably schedule and automate attacks in the future, and when the Status Check halts an attack, you can set up notifcations so you know your schedule attack passed or failed.
Avoid downtime. Use Gremlin to turn failure into resilience.
Gremlin empowers you to proactively root out failure before it causes downtime. See how you can harness chaos to build resilient systems by requesting a demo of Gremlin.

.svg)