Correlate Chaos Engineering and system impact using Gremlin webhooks and New Relic

.svg)
.svg)

 This is an older tutorial
When performing chaos experiments, it’s important to correlate the attack with the impact on your system. Webhooks send information about your attack to your monitoring tool of choice. In this way, you can observe from a single pane of glass the timeline of the attack and the reaction of your system. Exporting reports of the results also provides valuable information that can be shared when assessing the reliability of your applications.
In this tutorial, we’ll demonstrate two methods to send Gremlin events to New Relic. The first sets up a Gremlin webhook to send custom events to New Relic to demonstrate how you can highlight the effect of a Gremlin Attack on a system. The second uses New Relic Deployments to mark Gremlin attacks in New Relic’s APM dashboard.
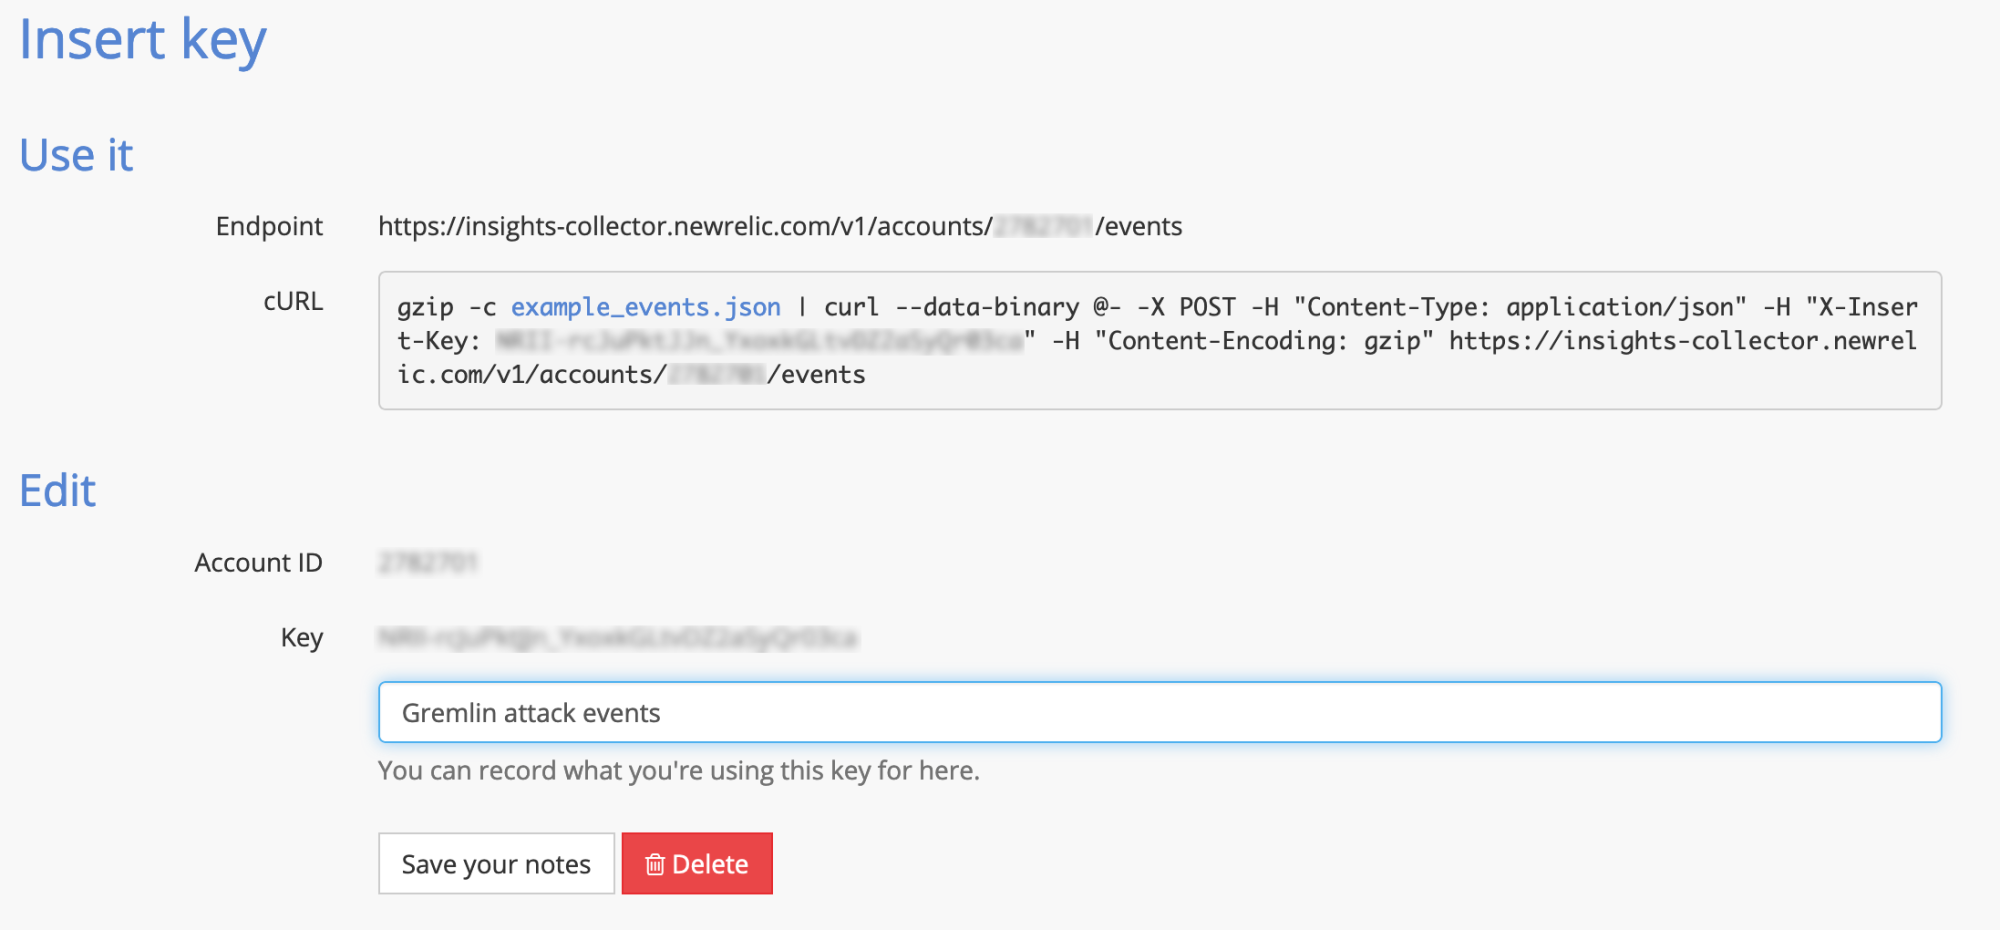
Method 1, Step 1: Register a New Relic API key
Register a new API key for the Gremlin webhook inside of New Relic’s Insights tool. Go to “Manage data” > “API Keys.” Click the “+” symbol next to “Insert Keys.” Enter the description, such as “Gremlin Attack events” and click “Save your notes.” Note the endpoint URL at the end of the example cURL command https://insights-collector.newrelic.com/v1/accounts/{{account_id}}/events and the API Key.
Method 1, Step 2: Log into your Gremlin account
Log in to your Gremlin account. If you don’t have an account, request a demo.
Method 1, Step 3: Add a new Gremlin webhook
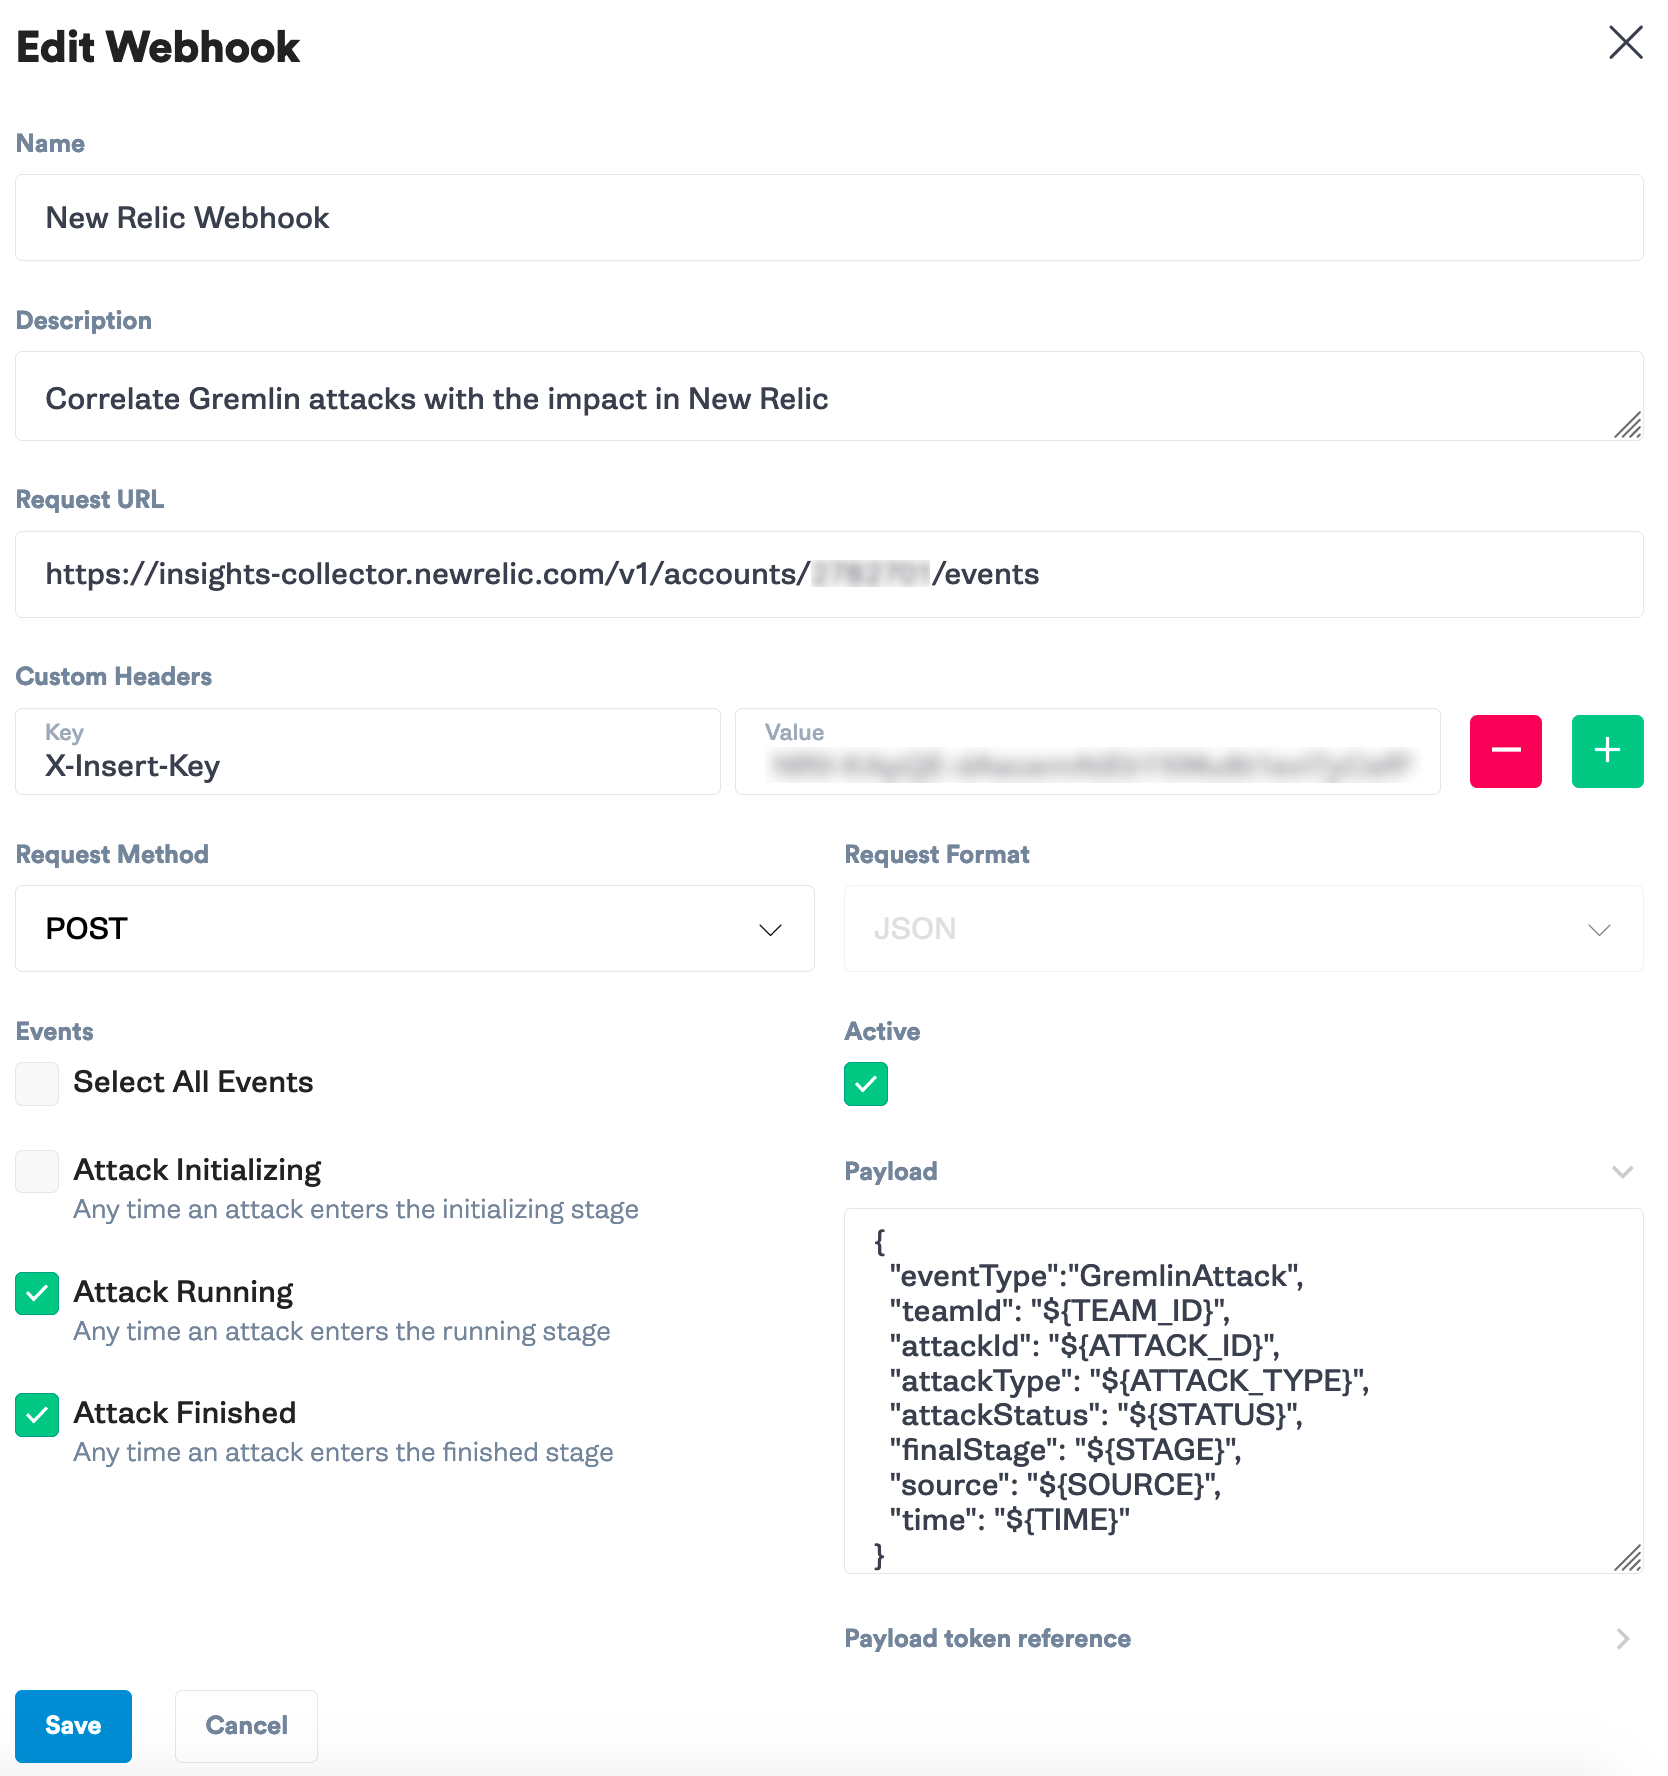
Click the Settings button to the left of the red “Halt All Attacks” button. Select “Team Settings” then “Webhooks”. Select “New Webhook”. Fill in the New Relic endpoint URL and API key header from Step 1:
New Relic has one required body tag for custom events called “eventType” that we need to include. Add this in the body of the Gremlin webhook:
This example uses <span class="code-class-custom">“eventType”:”GremlinAttack”</span> as the primary event to filter on inside of New Relic. Make any other customizations you would like to make to the key value pairs. New Relic is able to pick up the other fields as tags for filtering in NRQL queries and charts.
At this stage, all new attacks will send information in the form of custom events to New Relic. From here you can add custom charts and alerting to show when attacks occurred and the corresponding impact on your system, generate reports on how your infrastructure fared against attacks, or warn engineering leaders of the start of a FireDrill. Next, we’ll walk through a custom chart example.
Method 1, Step 4: Create a chart that shows impact
Using NRQL, you can design a variety of charts. For this example, we’ll use charts to highlight the effect of an attack upstream. To add a Gremlin chart, go to your dashboard and click “Query your data”. Enter the below in the query field, then click “Run”.

Method 1, Step 5: Run an attack
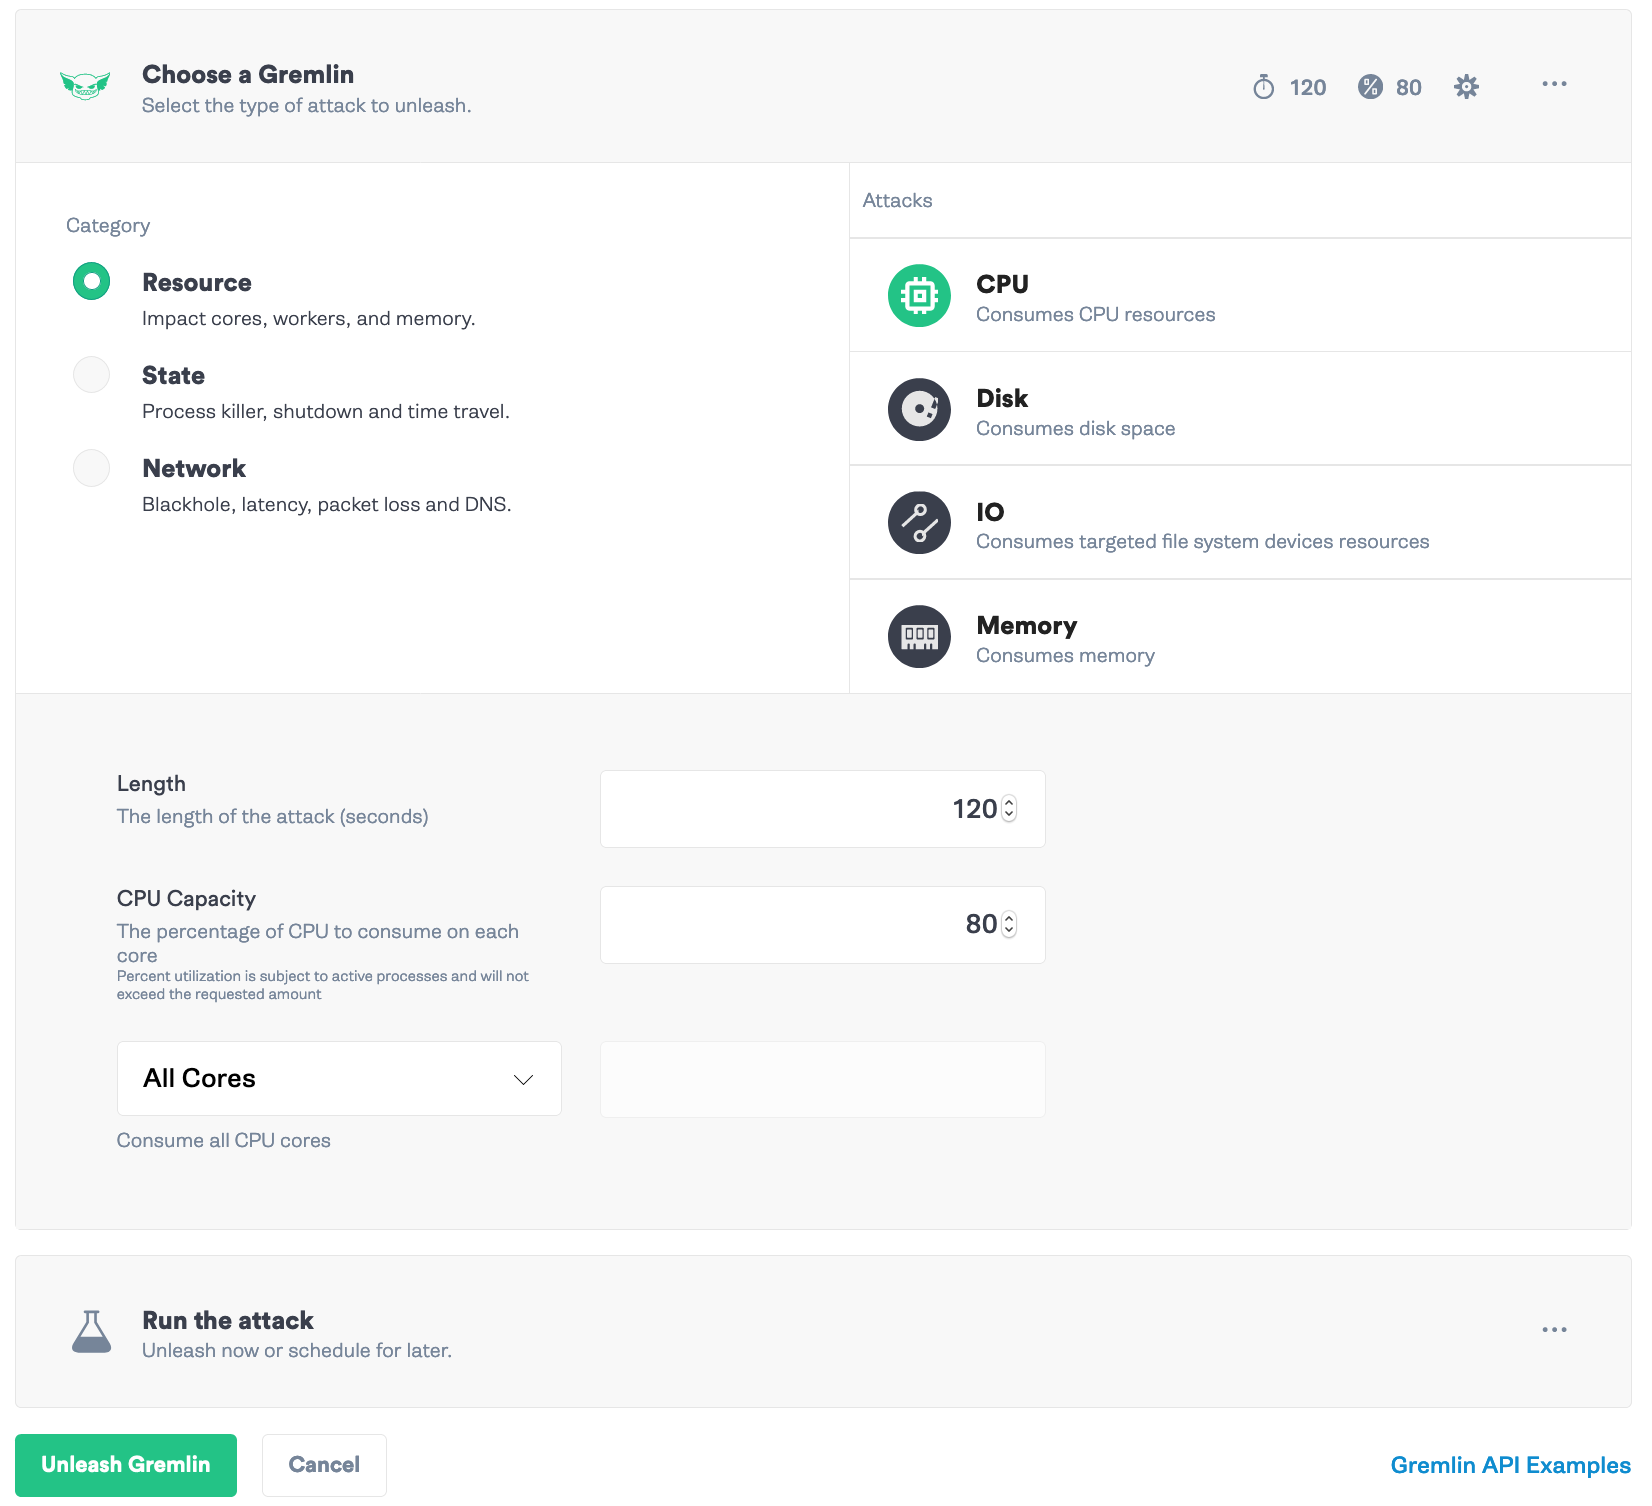
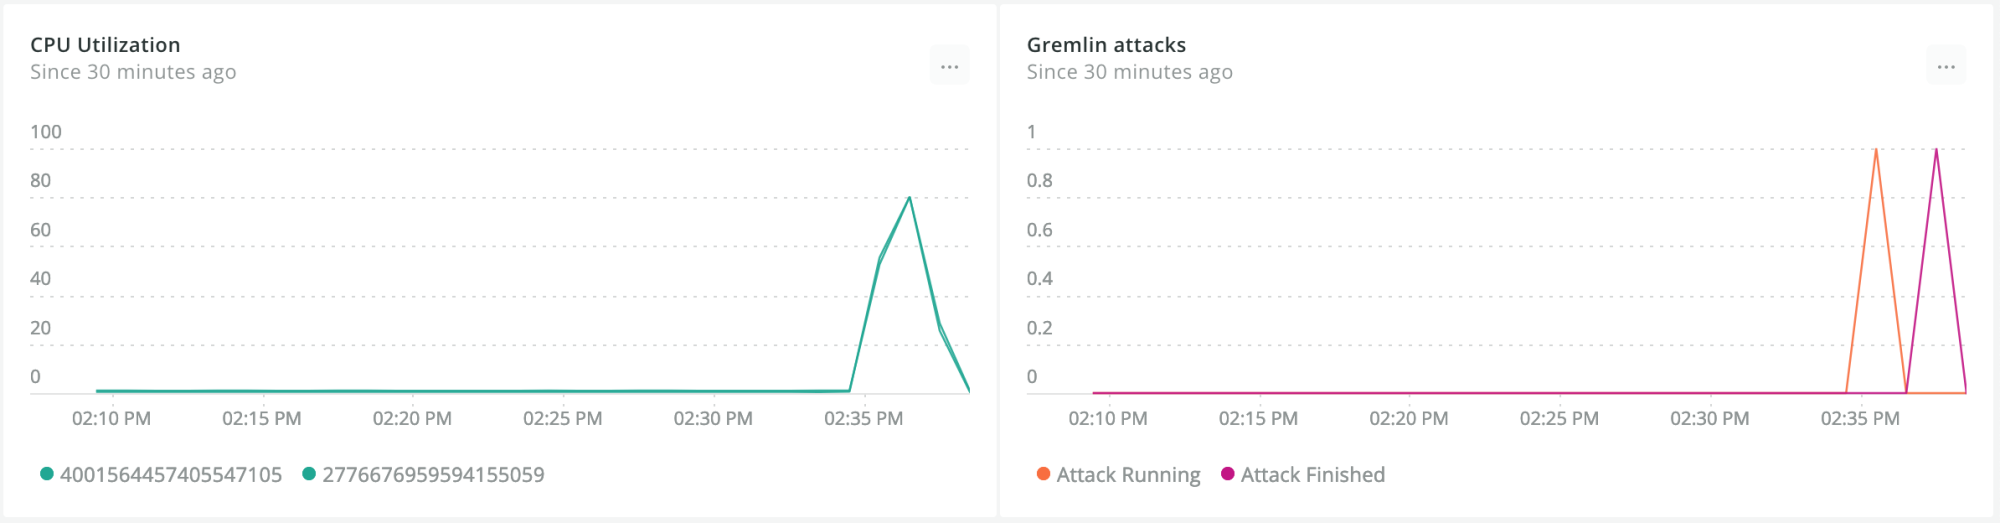
The last step is to run an attack and share your results. The CPU Attack is a great first step and is useful to verify tools such as monitoring, alerting, and autoscaling. We’ll run a CPU Attack and make sure that New Relic reports and informs us of the increased load.
In the Gremlin app, select “Create Attack” and select your hosts. Next, click “Choose a Gremlin”. Select “Resource” for the category and “CPU” for the attack. For this example, we’ll set the “Length” to <span class="code-class-custom">120</span> seconds, the “CPU Capacity” to <span class="code-class-custom">80</span>%, and the impact to <span class="code-class-custom">All Cores</span>. Then click “Unleash Gremlin.”
You can see the start and end of the attack in the chart we created and the increased CPU load in the CPU Utilization chart. Our webhooks and New Relic monitoring tool are working.
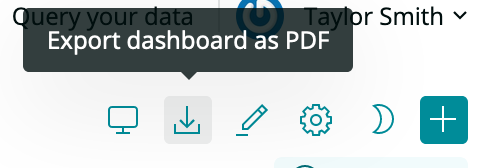
At the end of the experiment, you can export the result from New Relic as a PDF to share your findings and to provide metrics for the reliability of your system.
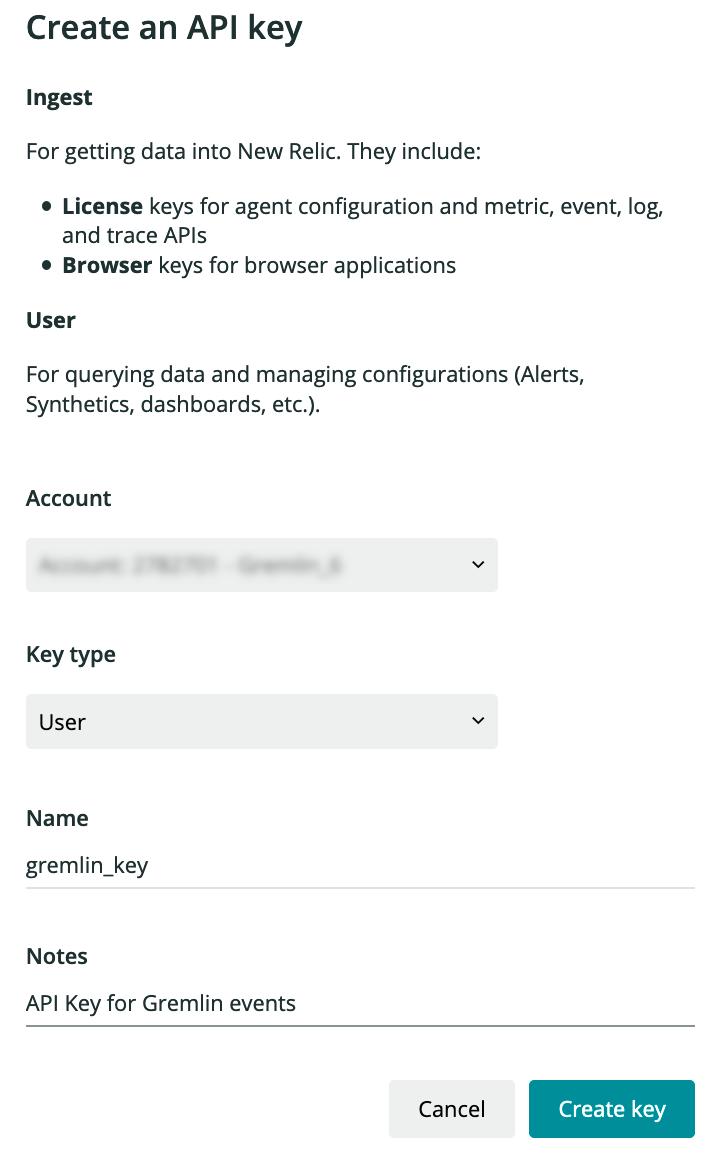
Method 2, Step 1: Retrieve a New Relic API key
Register a new API key for the Gremlin webhook inside of New Relic. Go to “Account Settings” > “API Keys”. Select the New Relic “Account”. Select “User” as Key Type. Give it a name like `gremlin_key` and click “Create key”. Copy the API Key for Step 3.
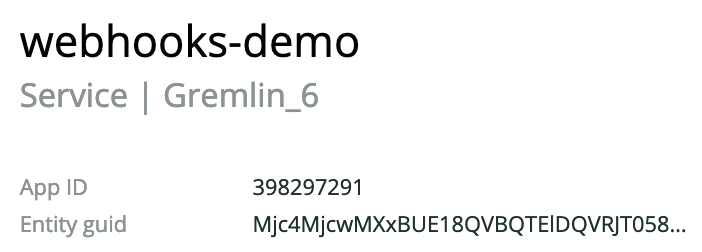
Method 2, Step 2: Grab your New Relic App ID
Next, we need to grab your Application ID. Navigate to the New Relic APM Overview dashboard. Find your application name by choosing the additional settings on the right for your application and select the “View Settings” or “See Metedata & Tags” (if in the new view for New Relic One). Copy the App ID from the Settings/Metadata Panel.
Method 2, Step 3: Create a new Gremlin webhook
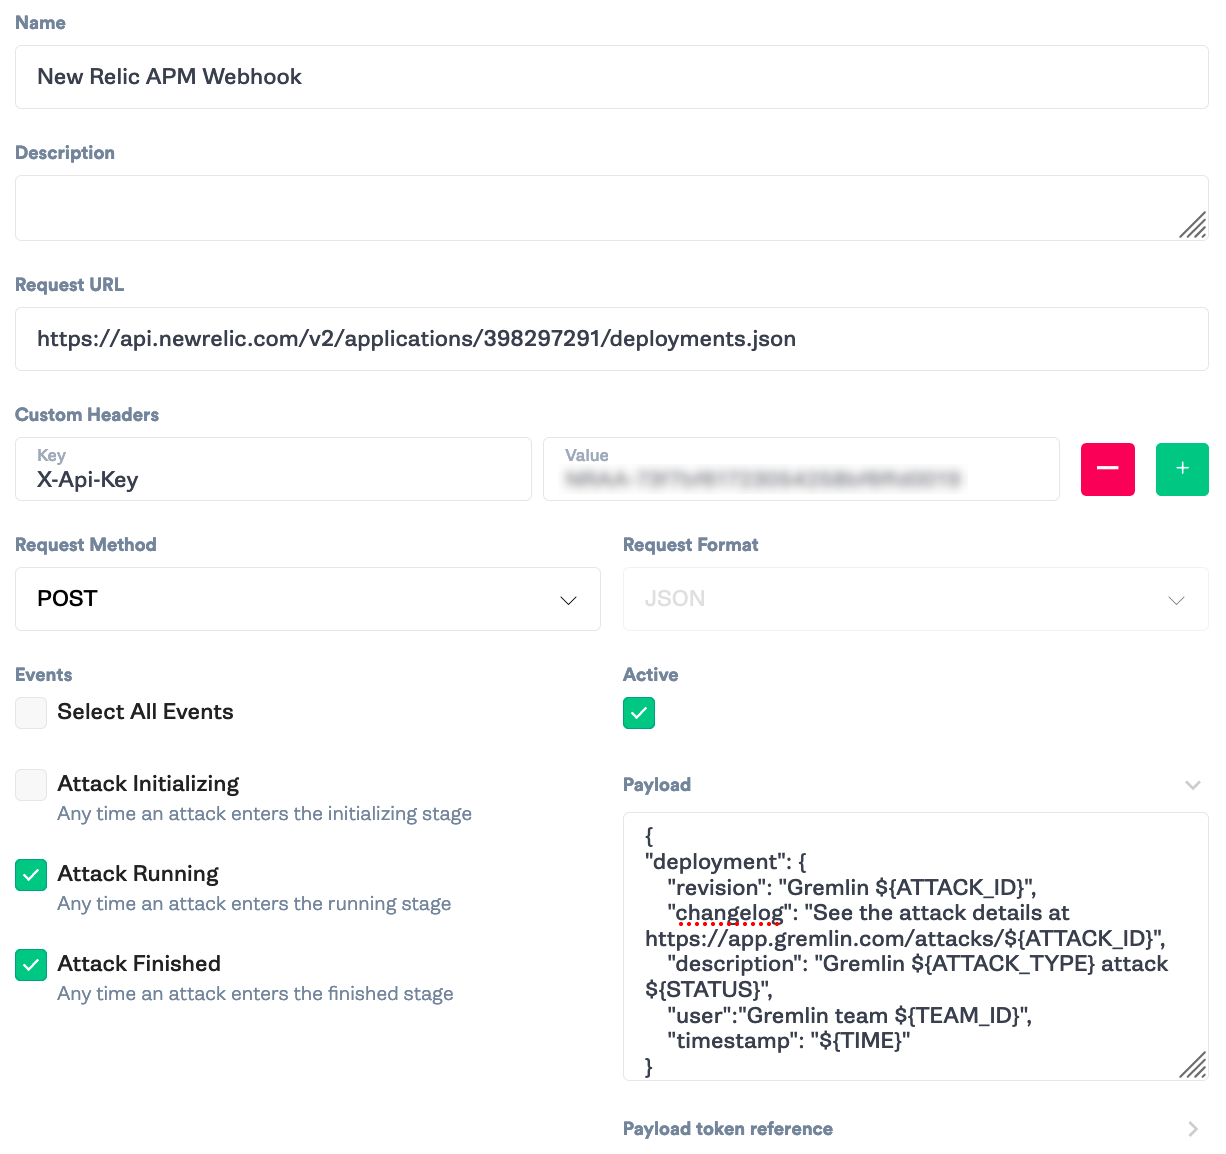
In this step, we’ll create the webhook to trigger a deployment event. In Gremlin, navigate to “Team Settings” > “Webhooks”. Click on “New Webhook”. Fill in the name <span class="code-class-custom">New Relic APM Webhook</span> and the Request URL<span class="code-class-custom"> https://api.newrelic.com/v2/applications/{App ID}/deployments.json</span>. Add the custom header <span class="code-class-custom">X-Api-Key</span> : <span class="code-class-custom">{New Relic API Key}</span>. Check “Attack Running” and “Attack Finished”. Finally, add the following payload and click “Save”.
Method 2, Step 4: Run an attack
The last step is to run an attack and share your results. We’ll run a CPU Attack and monitor how transactions are impacted during increased load.
In the Gremlin app, select “Create Attack” and select your hosts. Next, click “Choose a Gremlin”. Select “Resource” for the category and “CPU” for the attack. For this example, we’ll set the “Length” to 120 seconds, the “CPU Capacity” to 80%, and the impact to All Cores. Then click “Unleash Gremlin.”
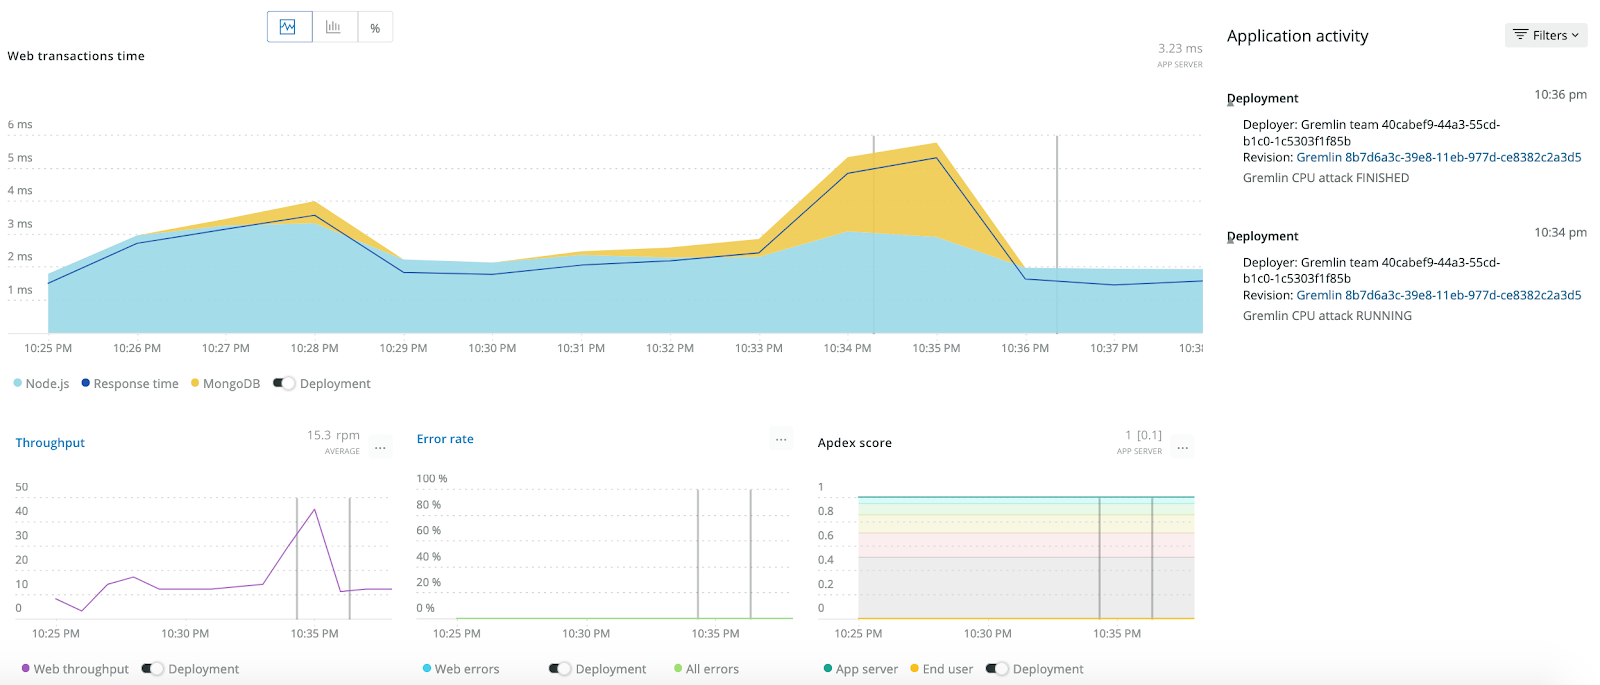
Head back to New Relic and open up the application with the webhook you created. You can see the start and end of the attack with the markers in the various charts. Our webhooks and New Relic APM are working.
Create your own integrations
Webhooks open up a plethora of ways to gain insight into the behavior of your systems. You can integrate with any system that takes JSON POST requests and customize the results to be most relevant for your organization. Recreate past incidents with Gremlin and hunt down the problem using your monitoring tool or integrate with your monitoring tool to ensure you're gathering the right metrics, have visibility into the health of your services, and are meeting your Service Level Objectives (SLOs).
You can learn more about Gremlin webhooks in the Docs. We’re excited to see what you build with this feature!
Avoid downtime. Use Gremlin to turn failure into resilience.
Gremlin empowers you to proactively root out failure before it causes downtime. See how you can harness chaos to build resilient systems by requesting a demo of Gremlin.

.svg)