
2025 was a stark reminder of why reliability is so critical in the tech sector. The year wrapped up with multiple high-profile outages across several major cloud providers, costing companies around the world billions of dollars. Building resilient systems has never been more of a priority, especially as we move into the era of agentic AI.
That said, the Gremlin team has been hard at work helping teams across the industry prevent outages with proactive reliability testing. We’ve added new experiments and Detected Risks, expanded our supported platforms, streamlined the onboarding process for new services, refined the Gremlin web UI, and much more! All with the goal of making reliability testing easier, giving you clearer visibility into how reliable your systems are, and preventing future outages.
Read on for a look at (almost) everything we’ve released in 2025, starting with our top six releases.
1. Gremlin gets smarter with Reliability Intelligence
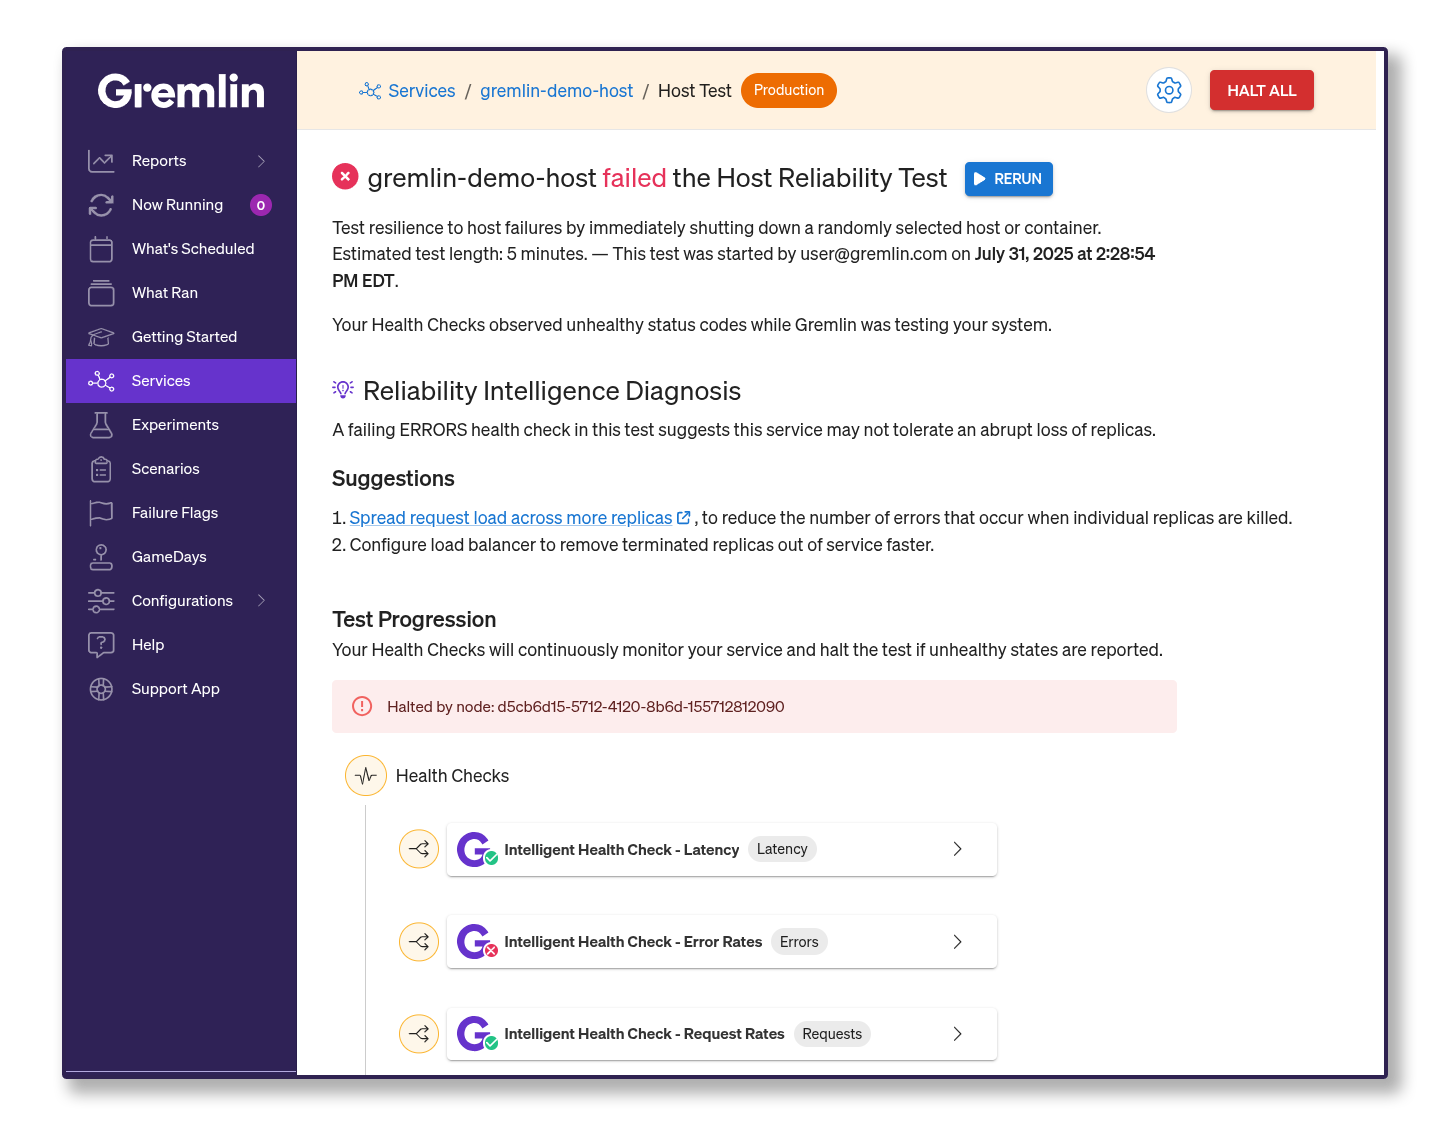
AI is becoming more commonplace, and now, it can help make your systems more resilient. We released Reliability Intelligence, a first-of-its-kind solution that analyzes the causes of failures, recommends remediations, and provides reliability insights tailored to your environment. We launched Reliability Intelligence with three major features:
- Experiment Analysis analyzes failed reliability tests and uses contextual information about your systems to determine the cause.
- Recommended Remediation gives actionable recommendations based on the results of Experiment Analysis.
- The Gremlin MCP server lets you connect your preferred LLM to your Gremlin environment, letting you query and explore your Gremlin environment using plain language.
Together, Experiment Analysis, Recommended Remediation, and the Gremlin MCP Server make for a smarter, more intuitive Gremlin experience. It’s like having your own personal reliability expert!
In high-velocity environments, reliability can't be an afterthought. Reliability Intelligence equips SRE and performance teams with deep, real-time insights from telemetry and trace data—enabling early detection of reliability regressions, faster root cause isolation, and proactive remediation without disrupting release velocity.
Arul Martin, Director of Performance Engineering, Sephora
Check out the announcement blog to learn more.
2. No-code and scheduled application-level testing with Failure Flags
We’ve added several new features to Failure Flags, our application-level fault injection solution. You can now create Failure Flags services, just like how you can create services from hosts, containers, and Kubernetes resources. This also means that you can create Scenarios that target Failure Flags and include them in Test Suites, letting you easily test your applications alongside the rest of your infrastructure.
Don’t have any Failure Flags configured yet? Not to worry—with Failure Flags by proxy, you can run application-level experiments without making any changes to your application code. This works by routing networking traffic from your application through a sidecar container before forwarding it to its destination. Enabling and disabling experiments is as simple as setting an environment variable or configuration value; no new code needed.
Lastly, Failure Flags now supports .NET applications. The SDK is readily available on NuGet and can be added to your projects with just one command:
You can learn more about Failure Flags in our docs.
3. Manage dependencies more easily across your company
Dependency Discovery is one of our most popular features, and for good reason. Dependencies are a common source of failures, and even just knowing what your dependencies are can go a long way towards building resilience.
Gremlin uses DNS traffic to identify dependencies that your services communicate with. Before, Gremlin created a new dependency for each DNS name, even if they pointed to the same dependency. Now, you can group multiple dependencies into a single dependency. You can also add wildcard characters to a dependency’s name to automatically consolidate any later dependencies that match its pattern. This helps clean up lengthy dependency lists and significantly reduces the time needed to run Test Suites.
Speaking of cleaning up dependency lists, we added a button to do just that. Next time you open your dependency list, you’ll notice a “Flush” button next to it. Clicking this button removes your service’s automatically-discovered dependencies so Gremlin can rediscover them for you. This is useful if your dependencies have changed significantly since you set up the service, or if you want to use the new wildcard feature without having to delete existing dependencies one-by-one. As a bonus, we now discover dependencies in Istio and LinkerD environments, so you can fully test your service mesh services!
Learn all about wildcard dependencies and flushing dependencies in our docs.
4. Get clearer insights with better reliability reporting
Reporting is crucial for understanding your reliability posture, showing improvements, and demonstrating compliance. We made several changes to our reports to make these easier.
First, the Company Summary report is now the Reliability Report. It offers all of the same information as before—your Company’s average reliability score, total Detected Risks, and service-by-service scores—while also showing week-by-week and month-by-month statistics. You can see how many experiments your company ran and how each service’s reliability score changed compared to the previous week.
Second, we added the Team Reliability report to the Gremlin home screen. This report appears as soon as you log in, letting you see your team’s reliability score and which services you need to focus on at a glance.
See the reporting section of our docs to learn more about the different reports available in Gremlin.

5. A stronger partnership with Dynatrace
We partnered with Dynatrace to make Kubernetes reliability testing and monitoring even easier. Gremlin can now automatically create Dynatrace Health Checks from Kubernetes resources in your Dynatrace instance, negating the need to copy URLs from Dynatrace into Gremlin (although this method is still available).
Additionally, whenever you run an experiment, Scenario, or reliability test in Gremlin, these events can now appear in your Dynatrace dashboard. This lets you pinpoint the exact time a Grelmin experiment began, so you can better see how it impacted your systems and metrics.
"Kubernetes is the foundation of modern cloud-native infrastructure, supporting a wide spectrum of organizations, from nimble startups to global enterprises. As AI-driven innovation accelerates, the reliability of Kubernetes becomes mission-critical. Our partnership with Gremlin simplifies chaos engineering, helping teams ensure resilience and performance across complex, distributed systems."
Wayne Segar, Global Field CTO at Dynatrace
You can read the announcement here, or learn more about our Dynatrace Health Check and integration in our docs.
6. Take Gremlin on-prem with Private Edition
We also released Private Edition, a version of Gremlin that you can deploy within your private network. Private Edition has the same features as our flagship SaaS platform, but shares no data with our servers. You’re in full control of your environment and have our expert support team to help you get the most out of your deployment.
To learn more about Private Edition, check out our announcement blog.
Much, much more!
These are just the highlights of what we released this year. There are a ton of features we didn’t cover, including:
- New Detected Risks for Kubernetes Horizontal Pod Autoscalers (HPAs).
- A new RBAC privilege for halting experiments.
- Host-based tags for service creation.
- The ability to alias SAML claims.
- Adding cross-region connectivity for AWS PrivateLink customers.
- Streamlining the creation of Prometheus and Grafana Health Checks.
- Support for targeting Kubernetes SidecarContainers.
- Configurable intervals for how often Health Checks run.
- An optional five-minute moratorium on scheduled experiments after using the Halt All button.
- Session time limits on API keys.
- Making Health Check timeouts optional.
- Adding the option to invert the “pass” criteria on Health Checks, which causes them to fail when the metric they’re observing returns successful.
- Preventing the Kubernetes OOMKiller from terminating Gremlin instead of the target container.
- Allowing experiments to continue running even when there are no targets available, such as on Kubernetes Pods.
- Increasing the maximum length of Failure Flags experiments to seven days.
You can read the full details on our releases—and subscribe to hear about future releases—in the release notes section of our documentation. We publish updates to our web app and agents along with RSS links.
Looking forward to 2026
We have a slate of great features planned for the year ahead! If you want to be the first to hear about them, follow us on LinkedIn and X (formerly Twitter), or subscribe to our RSS feeds. Have a great holiday season!
Gremlin's automated reliability platform empowers you to find and fix availability risks before they impact your users. Start finding hidden risks in your systems with a free 30 day trial.
sTART YOUR TRIALReliability Intelligence: your reliability expert
Gremlin’s Reliability Intelligence combines Experiment Analysis, Recommended Remediation, and an MCP Server to help teams increase reliability faster than ever.


Gremlin’s Reliability Intelligence combines Experiment Analysis, Recommended Remediation, and an MCP Server to help teams increase reliability faster than ever.
Read moreAnnouncing Gremlin Private Edition
Gremlin Private Edition is a private, secure, self-hosted Gremlin instance that runs entirely within your network. Learn more in our announcement blog.


Gremlin Private Edition is a private, secure, self-hosted Gremlin instance that runs entirely within your network. Learn more in our announcement blog.
Read moreImprove Kubernetes reliability faster with Gremlin and Dynatrace
It’s easier than ever to start testing Kubernetes with Dynatrace and Gremlin. The new strategic integration automatically discovers objects to make testing set up simple and fast.
It’s easier than ever to start testing Kubernetes with Dynatrace and Gremlin. The new strategic integration automatically discovers objects to make testing set up simple and fast.
Read more