Validating horizontal pod autoscaling on EKS with Gremlin


.svg)
.svg)

 This is an older tutorial
Introduction
Scaling is one of the most important functions of a microservices platform. Modern applications must be able to handle changes in demand, and the way to accomplish this is with automatic scaling. Kubernetes provides built-in scalability through its Horizontal Pod Autoscaler (HPA), but in order to make the most of HPA, we need to validate that it’s configured optimally for our workloads.
In this tutorial, we’ll show you how to set up HPA on an Amazon EKS cluster and test it using Gremlin.
Prerequisites
Before starting this tutorial, you’ll need:
- A Gremlin account (if you don't have an account, request a free trial).
- An Amazon EKS cluster (learn how to create a cluster here).
Overview
This tutorial will show you how to:
- Step 1: Deploy Gremlin to an EKS cluster.
- Step 2: Deploy the Kubernetes metrics server.
- Step 3: Deploy the Online Boutique demo application to Kubernetes.
- Step 4: Configure the Kubernetes HPA.
- Step 5: Use Gremlin to test HPA rules and validate that an application can scale horizontally.
Step 1: Install Gremlin
First, we need to deploy the Gremlin daemonset to our cluster. The easiest way to do this is with the Gremlin Helm Chart.
Start by adding the Gremlin Helm Chart repository:
Next, create a Kubernetes namespace for Gremlin:
Before we deploy the daemonset, we need to retrieve our Gremlin team ID and certificate in order to authenticate the daemonset. Log into the Gremlin web app, click on the circular avatar in the top-right corner, select “Team Settings,” then select the “Configuration” tab.

Make sure to copy your team ID and your secret key. If you're unsure of what your secret key is, you can either reset it, or use certificate-based authentication instead. See the Helm chart documentation for more information.
Assuming secret authentication, use the following command to deploy Gremlin to your cluster. Replace <span class="code-class-custom">$GREMLIN_TEAM_ID</span> with your team ID, <span class="code-class-custom">$GREMLIN_TEAM_SECRET</span> with your secret, and <span class="code-class-custom">$GREMLIN_CLUSTER_ID</span> with the name you want to use for this cluster in the Gremlin web app.
Note that this tutorial requires version 2.14.7 or later of the Gremlin daemonset. If you have an earlier version installed, you can upgrade to the latest version by using the following Helm command:
You can confirm that the upgrade worked by running:
The output will be similar to the following:
Step 2: Deploy the metrics server
The HPA requires metrics collected by the Metrics Server, which aggregates resource data in your cluster. EKS doesn’t deploy the metrics server by default, but you can deploy it by using the following command:
Next, we’ll verify that the metrics server was deployed:
This will show output similar to the following:
Step 3: Deploy the Online Boutique demo application
To test HPA, we’ll deploy a demo application to our cluster. The application we’ll use is Online Boutique, an e-commerce website made up of eleven containerized services. Each service runs a different part of the website like the frontend, shopping cart, and ads.
To run it, create a new namespace called <span class="code-class-custom">onlineboutique</span> and deploy the manifest file there:
Once the deployment finishes, retrieve the IP address of the frontend service and open it in your web browser:

Step 4: Configure HPA on the deployment
Next, let’s configure the HPA for our frontend deployment. The frontend deployment handles all user traffic for the Online Boutique. We’ll create an HPA rule that deploys a new pod if CPU usage exceeds a certain threshold across all frontend pods. We can also set minimum and maximum pod counts to prevent over-provisioning. This command sets our CPU threshold at 50% and limits scaling to a maximum of ten pods:
The output will look similar to this:
We can verify that our HPA rule is active by running this command:
This will show us this output:
The HPA is now active on the frontend deployment. Now when CPU usage increases past 50%, the HPA will add a new Pod (up to ten). When CPU usage falls below 50%, the HPA will remove Pods until we have one left. Next, we should test this rule to validate that our frontend can scale quickly and reliably during periods of elevated demand.
Step 5: Run a CPU attack using Gremlin
Now that we have our HPA configured, let’s test that it’s configured properly. We want to make sure our frontend automatically scales up (and down) without problems. Using Gremlin, we’ll create an experiment to consume CPU resources in the deployment. Our hypothesis is that this will trigger our HPA rule. During the experiment, we’ll monitor the number of pods in the deployment and our website to ensure we scale successfully.
It’s important to note that the frontend deployment has both CPU and memory limits already defined:
This is important for determining the magnitude (the intensity) we should use for our experiment. A Gremlin CPU attack ran on a Kubernetes pod consumes resources based on the pod’s requests, not its limits. For example, if we ran an attack consuming 5% on a single core, this would use 50m CPU, which equates to half of our requested capacity. If we consumed 10% on a single core, or 5% on two cores, this would use 100m CPU. When running a CPU attack on all cores, it’s important to know how many cores the host has, as this affects the overall CPU percentage used. For our experiment, we’ll consume 5% across two cores, since we’re running our cluster on dual-core machines.
Log into the Gremlin web app, then select Attacks > New Attack. Select Kubernetes, then select the frontend Deployment.
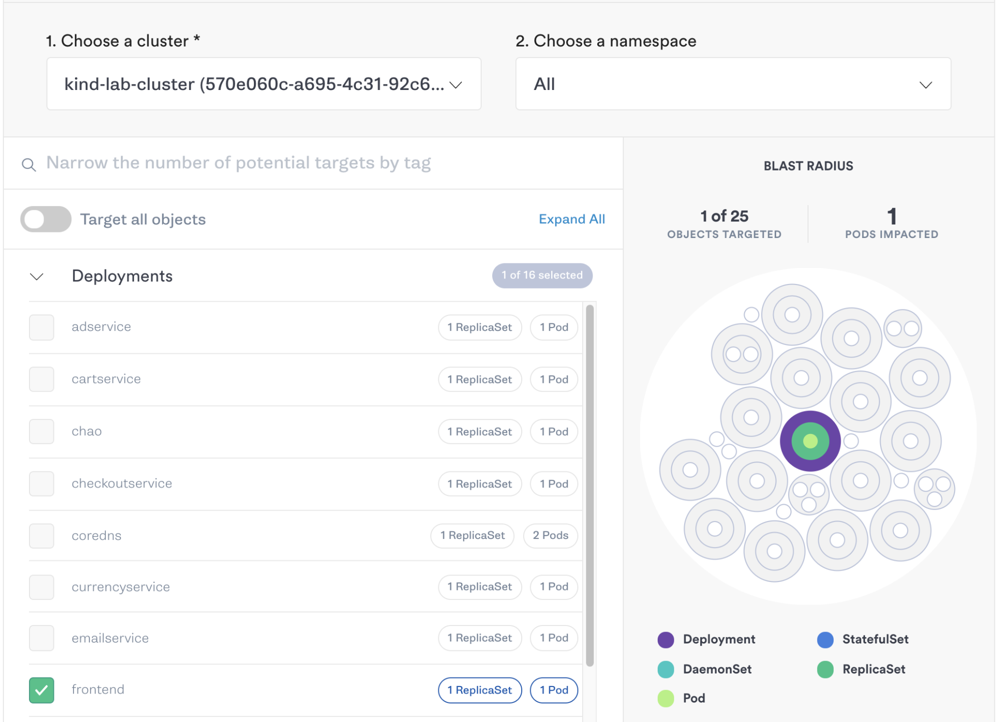
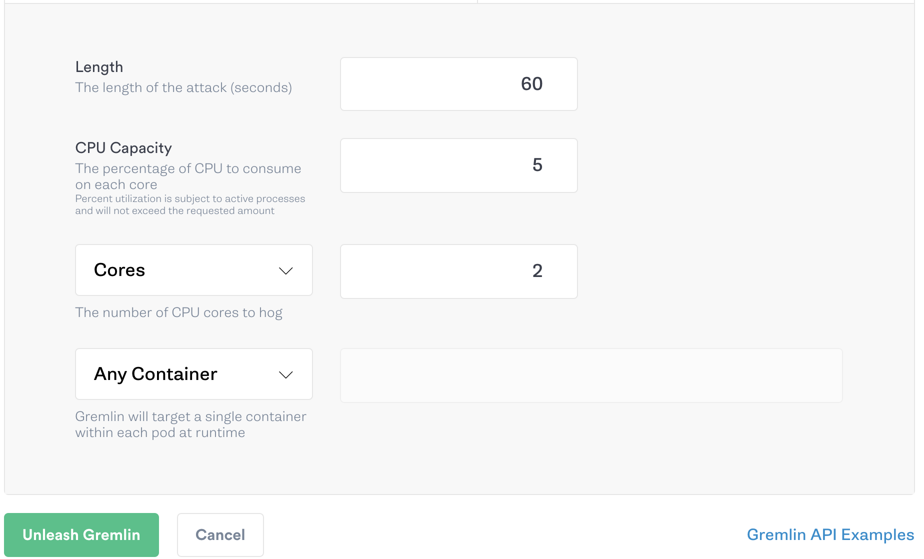
Under Choose a Gremlin, select Resource > CPU. Enter 5 for CPU capacity and set the number of cores to 2. Keep Any Container selected, then click Unleash Gremlin to run the attack.
Step 6: Monitor HPA using kubectl
While the attack is running, let’s monitor our HPA by using the watch command. watch will refresh the output of a console command based on a customizable interval. Here, we’ll use it to refresh the output of kubectl every five seconds:
The output will look similar to the following:
Shortly, the number of replicas will increase from 1 to 2, indicating that the new pod was deployed. Once this pod is in a running state, we can verify that the frontend is still fully functional by refreshing our application in a web browser, or by monitoring the load balancing service included in the application. If all goes as expected, our website will be just as performant as it was before, and we’ll now have a second frontend pod to handle the additional load. Once our experiment stops, we should continue monitoring our HPA to make sure that after CPU usage returns to normal, our deployment scales back down and the now-unused pod gets removed.
Conclusion
Now that you’ve validated your HPA rules using Gremlin, consider expanding the scope of your experiments by:
- Testing your Kubernetes workloads against common failures by using Recommended Scenarios.
- Identifying your most critical services and testing your application’s resilience to outages.
- Implementing these cost-saving strategies on your Amazon EC2-backed EKS clusters.
Avoid downtime. Use Gremlin to turn failure into resilience.
Gremlin empowers you to proactively root out failure before it causes downtime. See how you can harness chaos to build resilient systems by requesting a demo of Gremlin.

.svg)