Replicate and monitor CoreDNS issues with Gremlin and Datadog

.svg)
.svg)

 This is an older tutorial
DNS is at the core of many of the technologies we use today, including Kubernetes service discovery. Without DNS, pods aren’t able to find one another, and their communication breaks down. Luckily, DNS is never a problem. Unfortunately, while the maintainers of CoreDNS, the default DNS provider in Kubernetes, have done an excellent job squashing bugs and solving big problems, DNS is prone to issues. Our systems and teams should be prepared for DNS outages before they arise.
That’s where Gremlin and Datadog come in. Gremlin can inject failure into our systems running DNS to see how our applications, infrastructure, people and monitoring respond to a DNS incident. In this way, we can be prepared for the real thing in production and minimize the impact on customers. Datadog’s DNS Monitoring gives a powerful and concise view of how our DNS requests are handled to spotlight issues like high error rates and latency.
For this tutorial, we’ll highlight how you can use Gremlin to simulate three common DNS failure modes and how to detect and debug them in Datadog.
Prerequisites
- An application deployed in Kubernetes (for example, Ana’s EKS tutorial)
- Gremlin installed in the cluster
- Datadog 7.22+ agent installed in the cluster (installation instructions)
- Turn on Datadog’s Network Performance Monitoring and DNS Monitoring
Step 1: Gather your Datadog Keys
Head over to https://app.datadoghq.com/account/settings#api and grab your API Key and Application Key. If you don’t have one yet, create a new API Key and Application Key.
Step 2: Shutdown CoreDNS
For this first attack, we’ll shut down one CoreDNS pod. AWS’ Elastic Kubernetes Service runs two pods for redundancy. Despite redundancy and graceful termination, sometimes losing one DNS pod can still lead to failures if requests are still sent to the pod that is shut down. We can test how our system handles a single pod outage by running a Gremlin Shutdown attack.
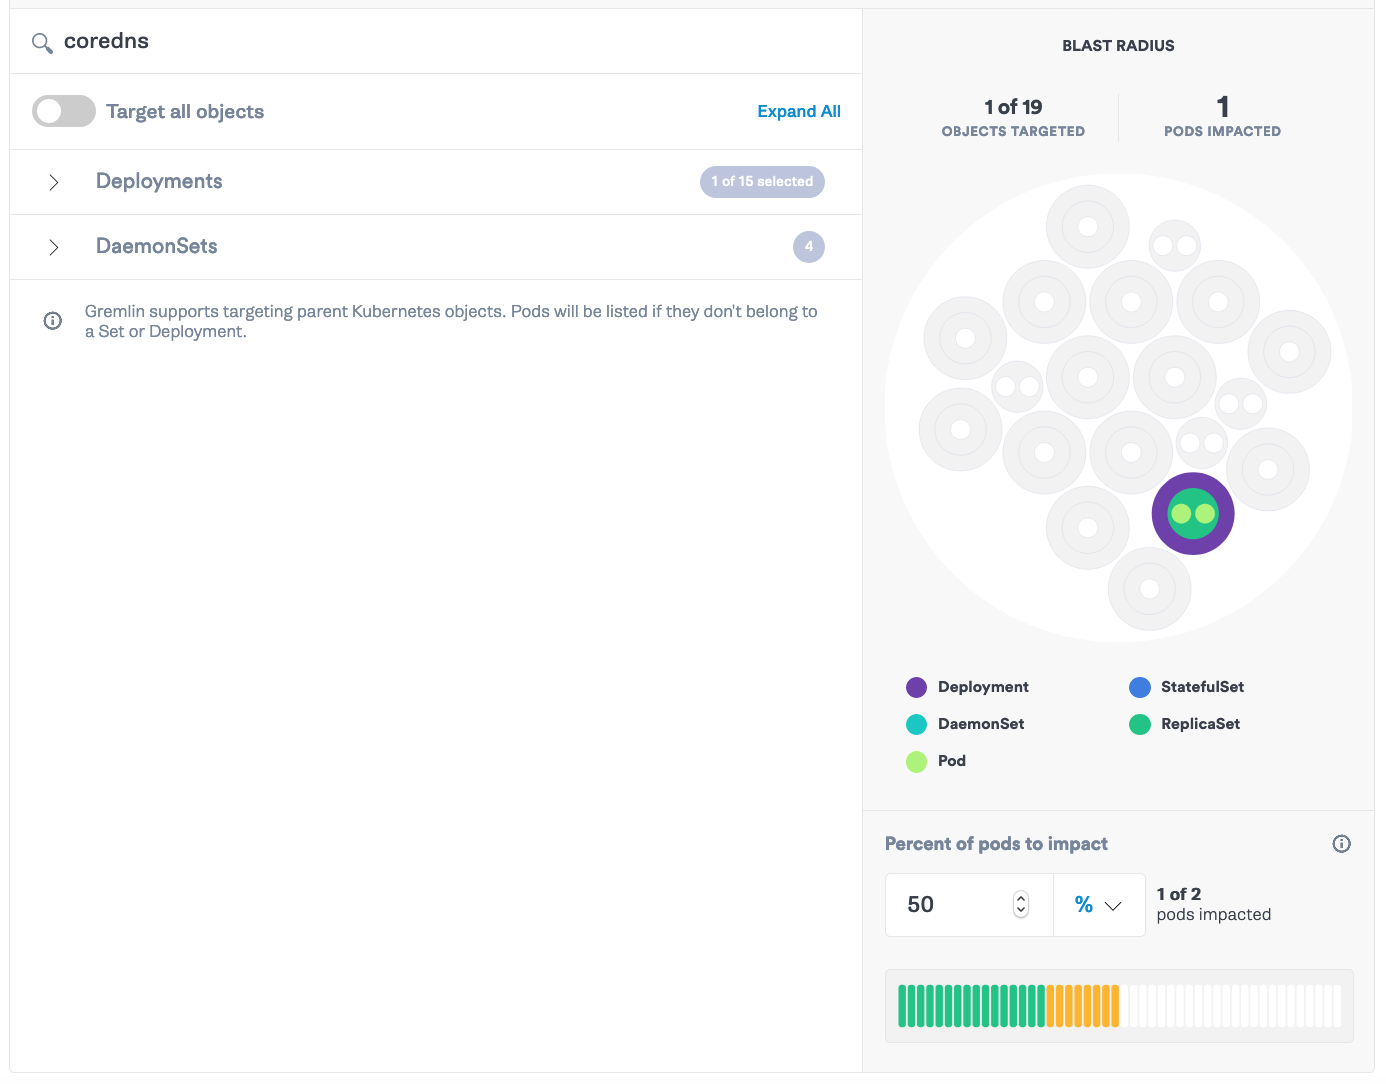
Go to app.gremlin.com and select “Create Attack”. Select “Kubernetes” and search for <span class="code-class-custom">CoreDNS</span>. If you’re running in EKS, you should see a ReplicaSet with two pods. Then set the “Percent of pods to impact” to <span class="code-class-custom">50%</span>.
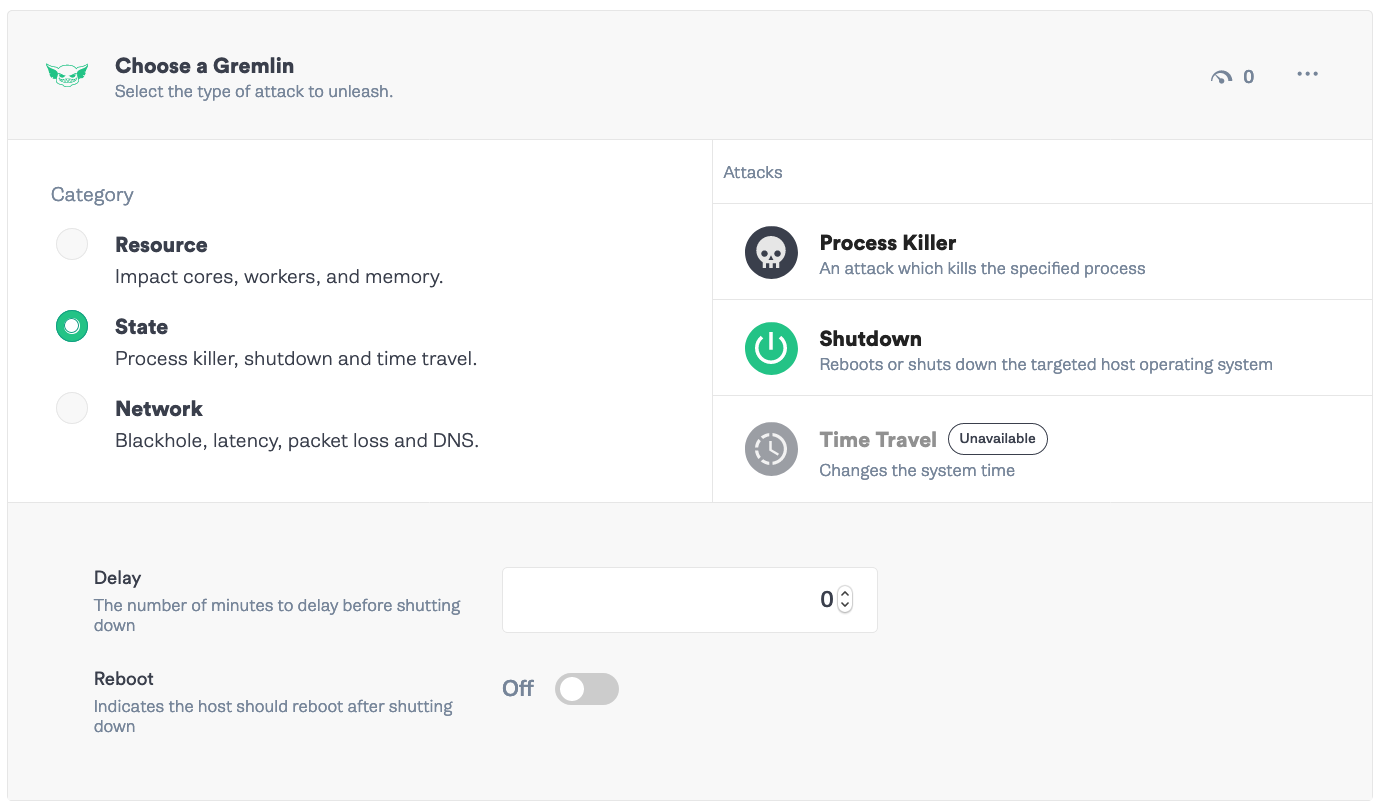
Click “Choose a Gremlin” and select State -> Shutdown. We’ll set the delay to 0 and Reboot to Off. Click “Unleash Gremlin”.
If you head over to your console, run the following command.
Your running pods will look like this.
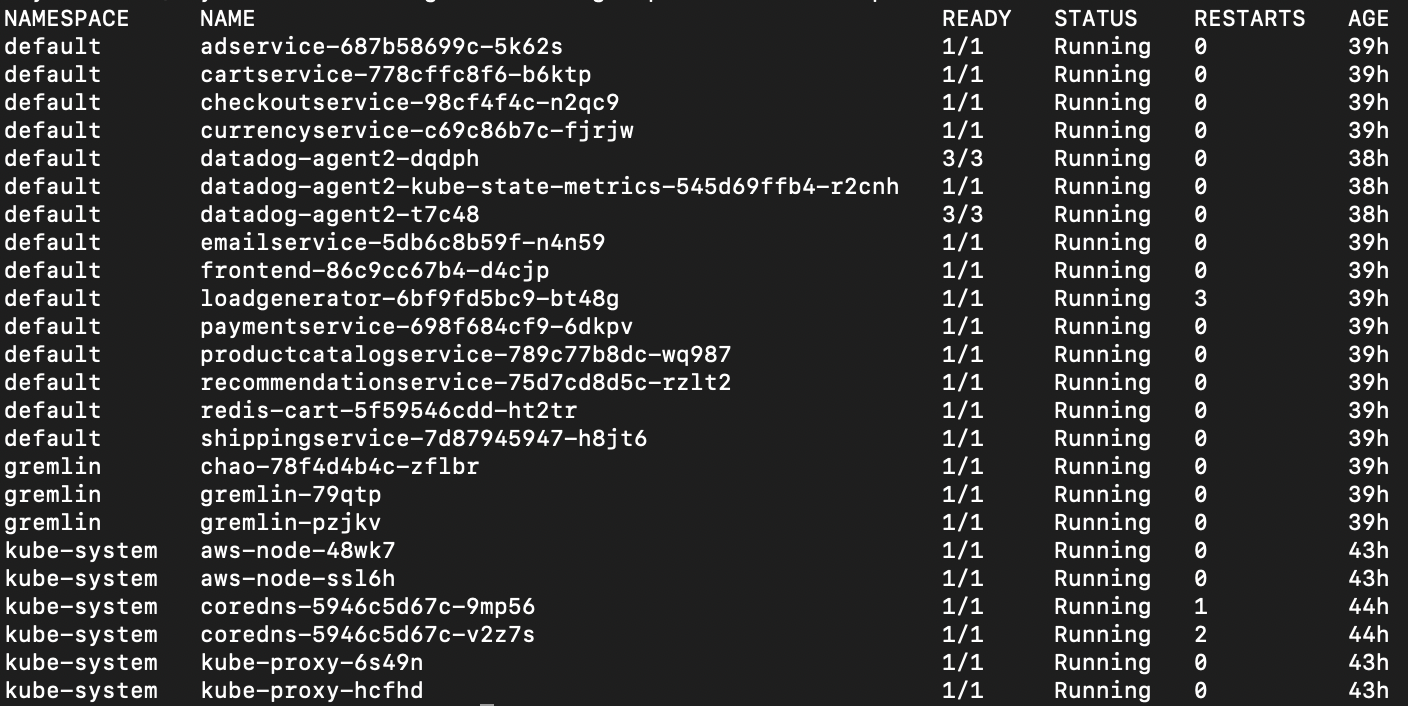
Notice that one of the CoreDNS pods, c<span class="code-class-custom">oredns-5946c5d67c-v2z7s</span>, has one more restart than the other pod. Head over to Datadog and look at the resulting charts.
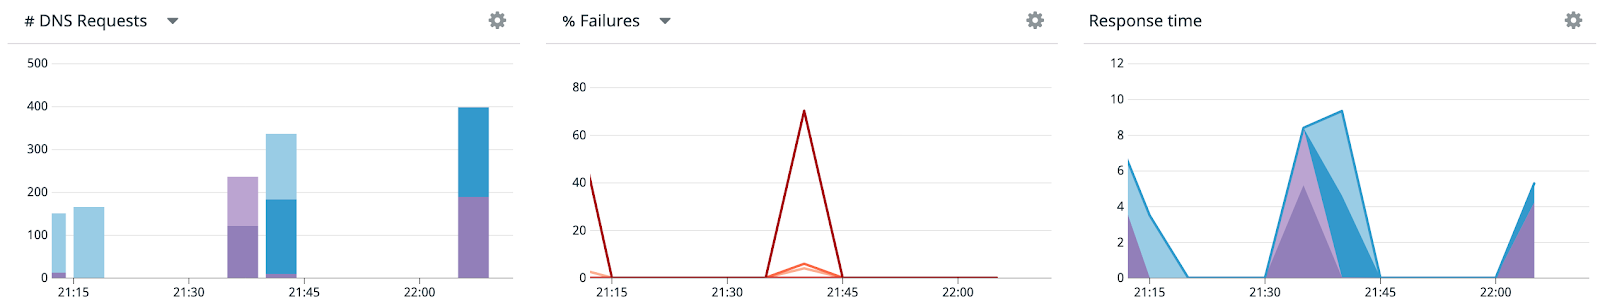
We’re seeing one DNS pod erroring at a high rate, then dropping as Kubernetes replaces the shutdown pod. The other pod is unimpacted. Use the other graphs to determine whether the pod’s high error rate corresponds with additional latency in its responses as well. If you are, you can adjust the check to see if the pod is dead so that traffic is routed away from it faster. Also, you can graph this error metric in dashboards for validating long-term health.
Step 3: Create a Status Check
For the next two attacks, we’re going to add a safety mechanism to make sure attacks halt when the impact hits our services.
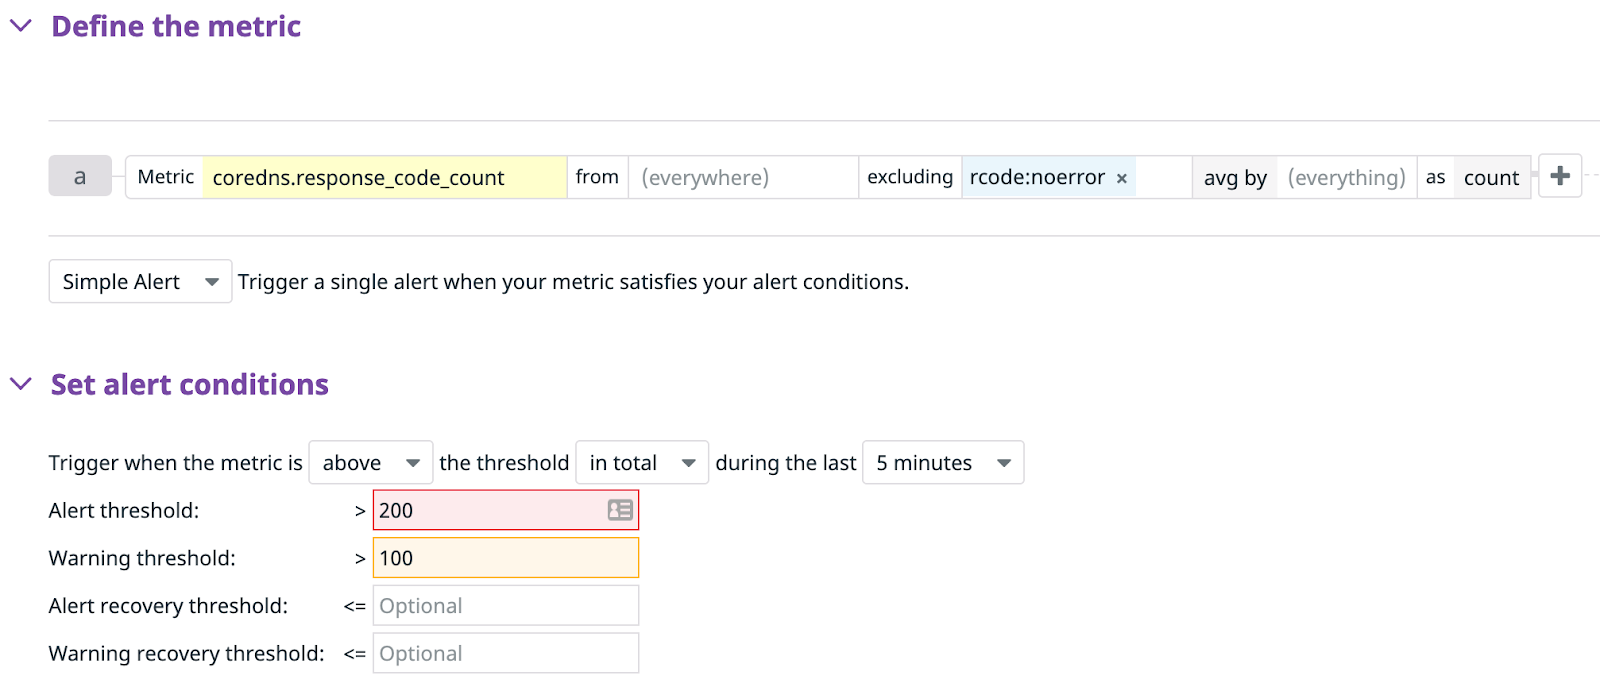
First, we’ll create a Datadog monitor. Go to Datadog and in the left navigation menu, select “Monitors” -> “New Monitors”. Then, select “Metric” as the type of Monitor. Fill in <span class="code-class-custom">coredns.response_code_count </span>excluding <span class="code-class-custom">rcode:noerror</span> as the Metric. This will report all CoreDNS response codes that are errors. Look at the baseline for the past few hours and set a threshold above that. For my setup, I set the alerting above <span class="code-class-custom">>200</span>.
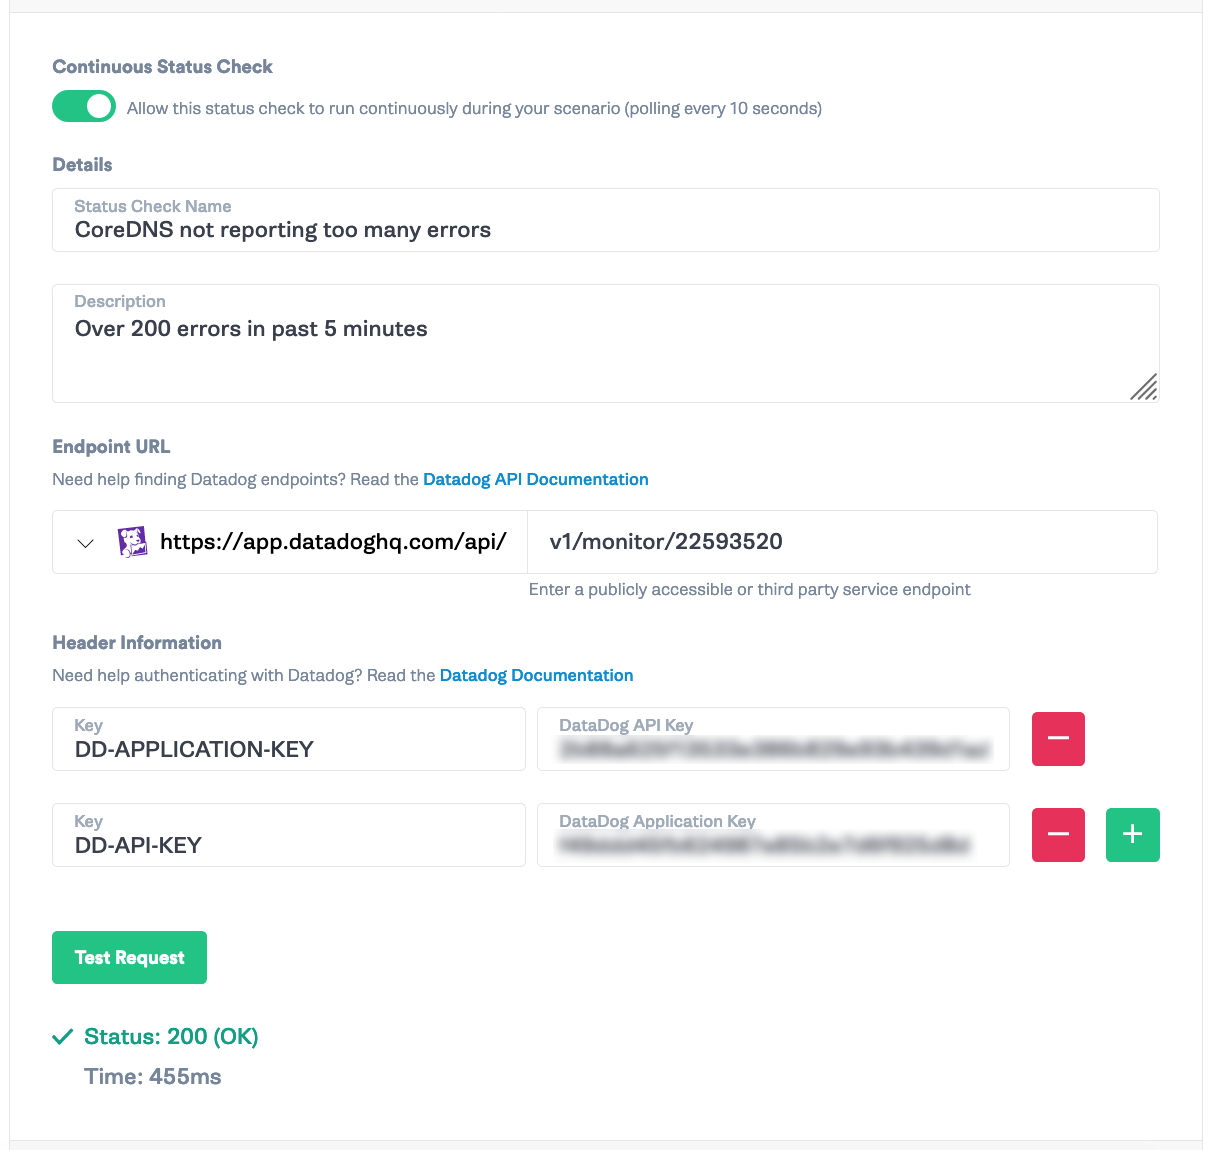
Add a title and a description, then click “Save”. Click “Export Monitor” and grab the id value. Mine was <span class="code-class-custom">22593520</span>.
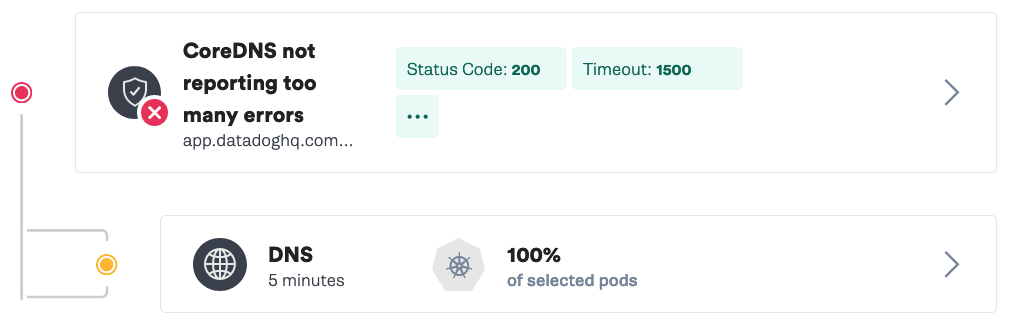
Go back to Gremlin and click “Scenarios” from the left bar. Then select “Status Checks” in the top navigation menu and “New Status Check”. Turn on “Continuous Status Check” and add a name and description. Add <span class="code-class-custom">v1/monitor/{monitor_id}</span> and your Datadog API Key and Application Key from Step 1 and click “Test Request”. You should get a 200 response.
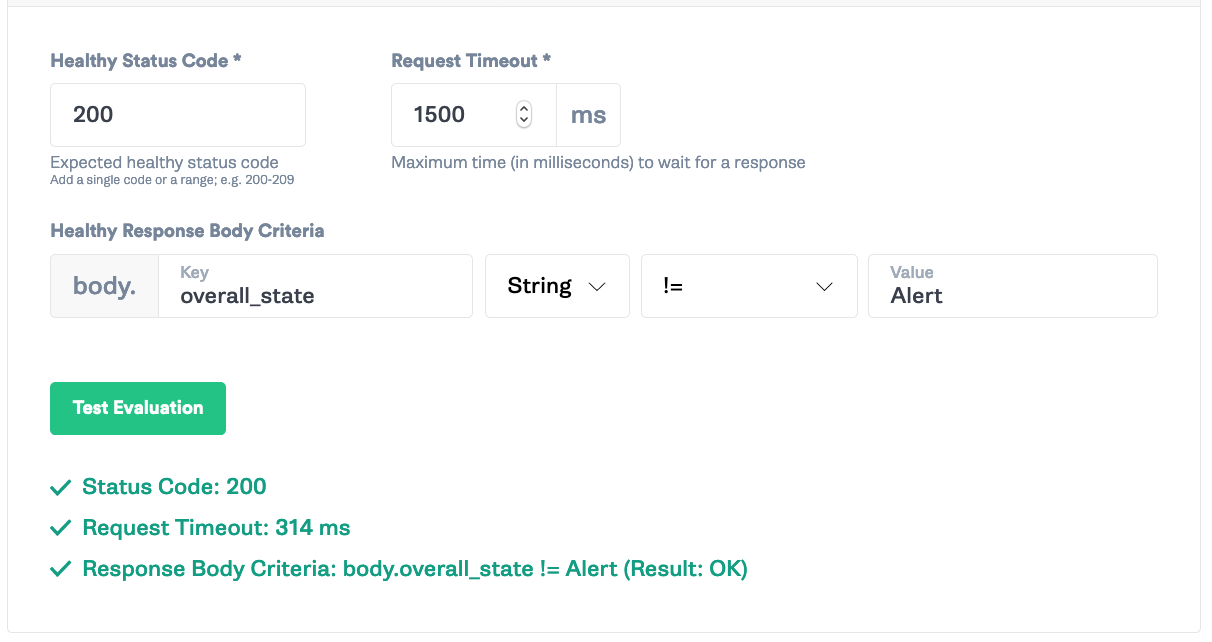
Set the “Success Evaluation” to HTTP status code <span class="code-class-custom">200 </span>with a timeout of <span class="code-class-custom">1500</span> ms. We’ll grab the JSON body response <span class="code-class-custom">overall_state String != Alert</span>. This will make it so Gremlin will check Datadog every 10 seconds for the monitor and make sure that it’s not in an alert state before continuing the attack.
Step 4: Generate DNS latency
Next, we’ll test for system behavior with DNS latency. DNS latency can be an issue in Kubernetes, for example, if there are too many calls to the DNS service. There have been reports of up to 5 seconds or more of latency between a pod and CoreDNS. It’s important to check that your system can handle latency issues without impacting end users, and consequently, your bottom line.
Head over to Gremlin and select “Create Scenario”. Add the saved Status Check from Step 3. Then, select “Add a New Attack”. Go to the Kubernetes tab and select every deployment except<span class="code-class-custom"> chao</span>, <span class="code-class-custom">coredns</span>, and <span class="code-class-custom">datadog-agent</span>.
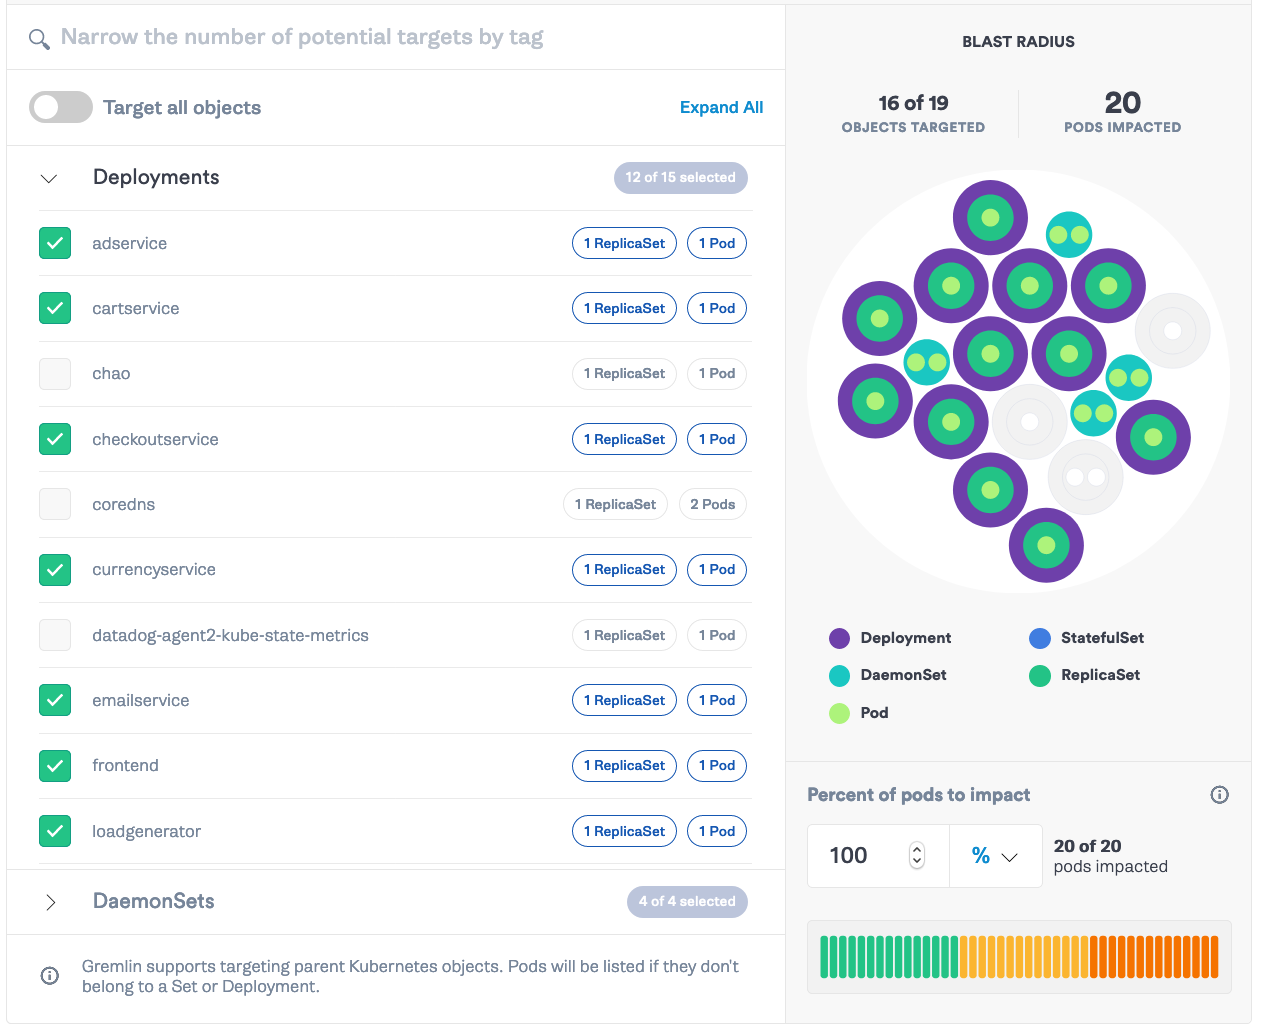
Click “Choose a Gremlin” and select Network → Latency. Set the length to <span class="code-class-custom">300 </span>seconds, MS to <span class="code-class-custom">500</span>, and set both the remote ports and local ports fields to <span class="code-class-custom">53</span>.
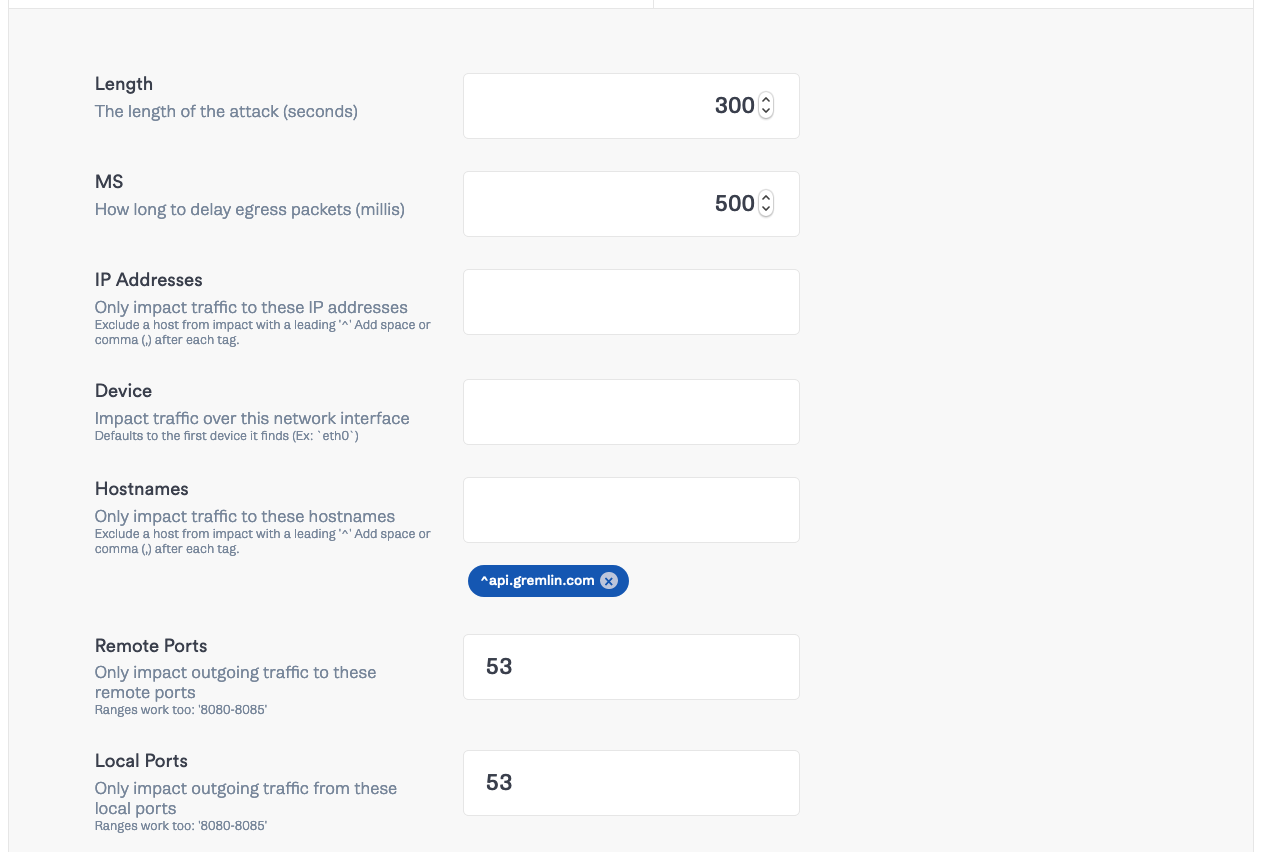
This will slow all DNS traffic from every service by 500 ms until the error rate increases above the average rate. Click “Add to Scenario”. Then click “Save Scenario” and click “Run Scenario”.

Head back over to Datadog and watch the DNS response time chart.
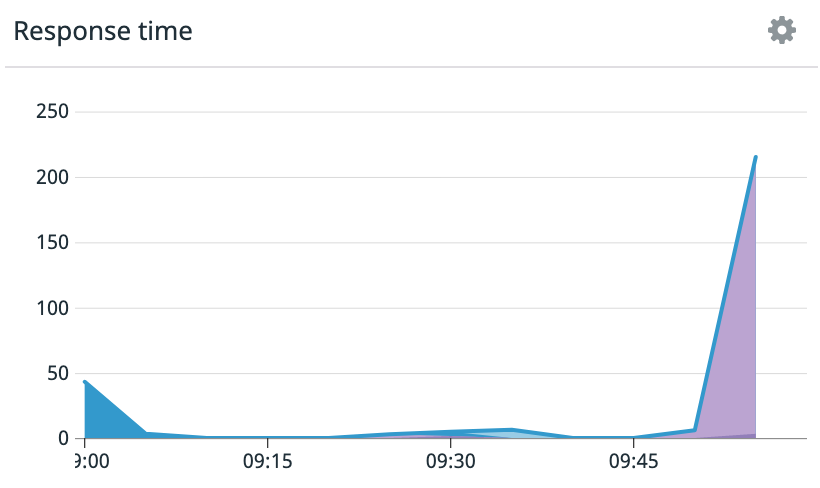
Look around at your other charts in Datadog. Were there other areas where services were slow to respond? Then dive into the Network Overview page to scope the effect on the client services, which may no longer be able to communicate, or communicate effectively, with other endpoints they are reliant on.
Step 5: Simulate a DNS outage for all services
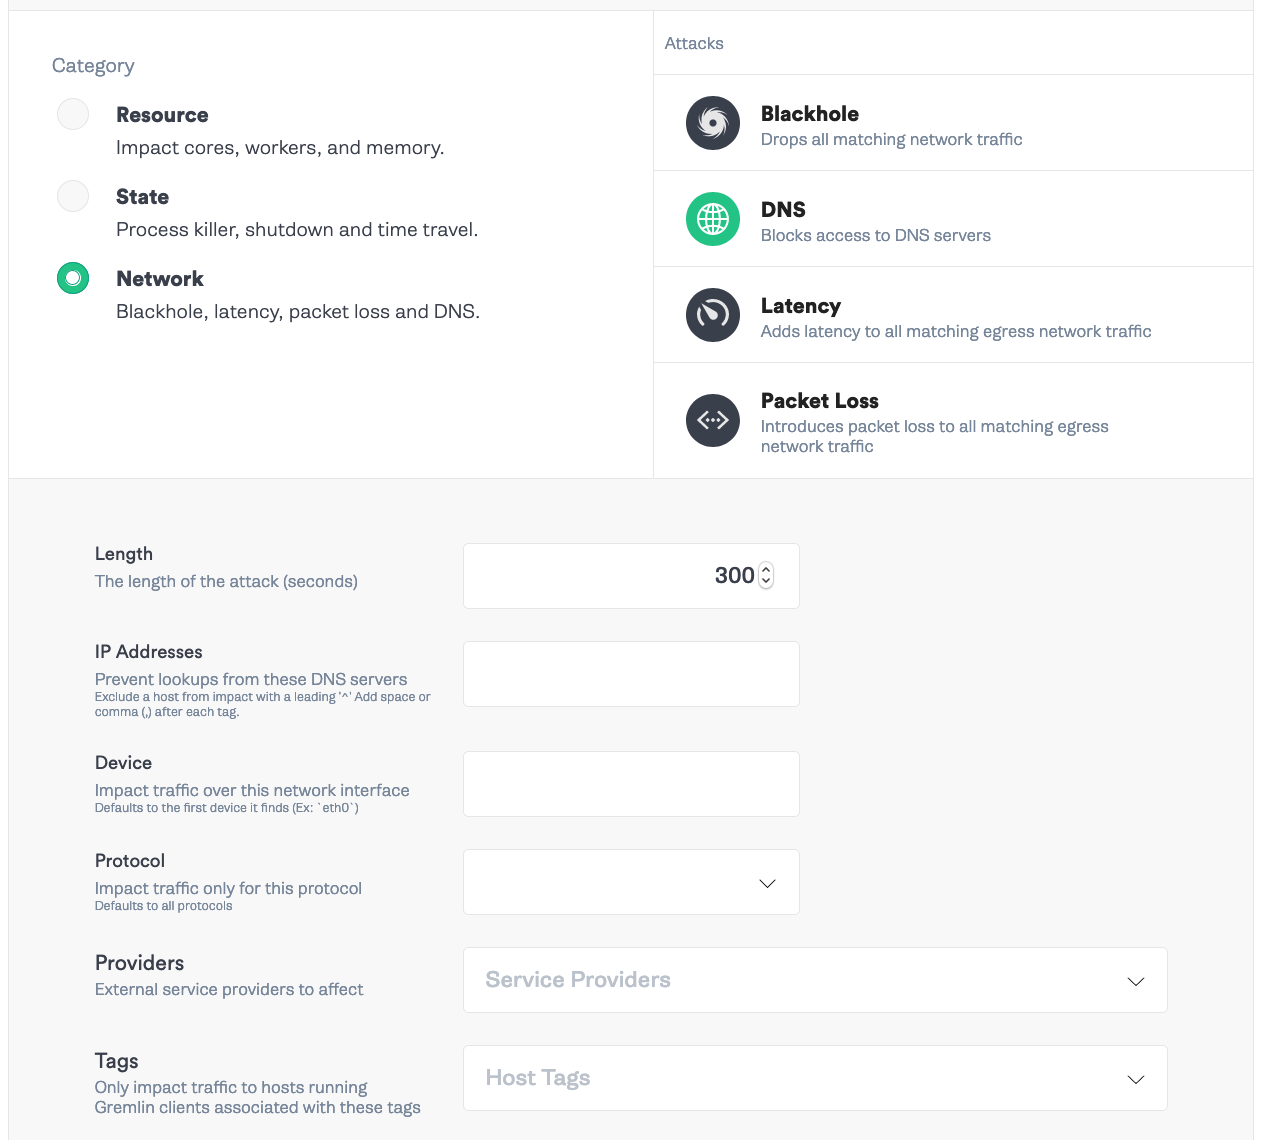
For the final attack, we’ll see how our services handle losing connection to CoreDNS. In Gremlin, select “Create Scenario” and add a name and description for your scenario. Add the Status Check from Step 3. Then, “Add a new attack”. Like the previous step, we’ll select every pod except <span class="code-class-custom">chao</span>, <span class="code-class-custom">coredns</span>, and <span class="code-class-custom">datadog-agent</span>. Then select “Choose a Gremlin” and select Network -> DNS. Set the length to <span class="code-class-custom">300</span> seconds.
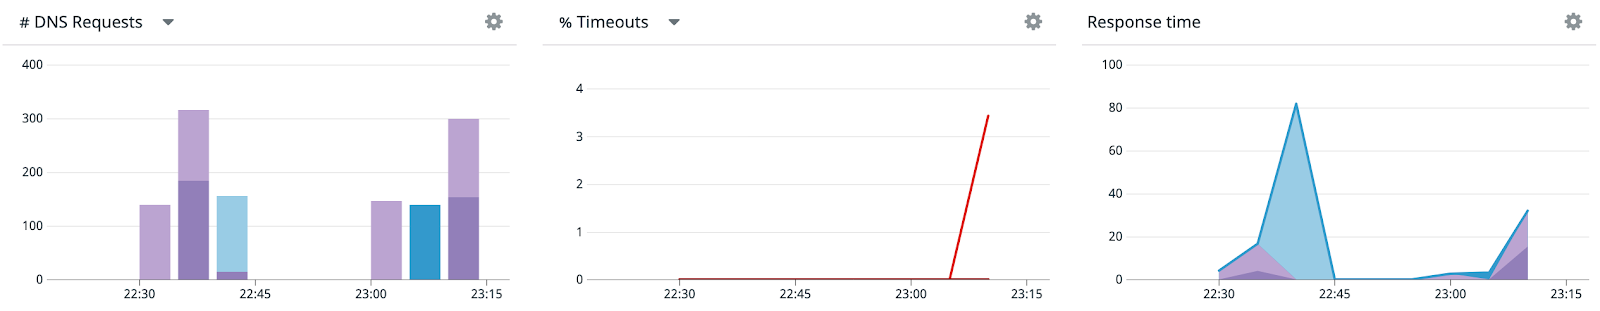
Click “Add to Scenario” -> “Save Scenario” -> “Run Scenario”.
Now check out Datadog’s DNS Monitoring. You’ll see a rise in timeouts and a spike in response time. In the Overview tab, you’ll see a spike in retransmits as well. The timeouts mean a request is not going through, which can lead to increased error rates for your frontend services and ultimately affect user experience. Additionally, if there aren’t circuit breakers with exponential backoffs in place, these retries could flood the system when it comes back online in a self denial of service attack.
Conclusion
These are just three examples of attacks we can run to test our CoreDNS pods for failure. Datadog’s DNS Monitoring makes it easy to spot these issues with request count, error rate, response time, metrics for each client-to-server dependency so your teams can quickly find and fix the problems that arise. Making sure you have adequate replicas, tuned timeouts and service caching are some of the ways we can mitigate many of these issues, and using failure injection, we can test that they are in place and working properly. From here, we can replicate other DNS incidents and harden our systems against these failure modes.
Avoid downtime. Use Gremlin to turn failure into resilience.
Gremlin empowers you to proactively root out failure before it causes downtime. See how you can harness chaos to build resilient systems by requesting a demo of Gremlin.

.svg)