How to use Continuous Status Checks to experiment safely

.svg)
.svg)

Introduction
Chaos Engineering is an essential practice for improving system reliability, but it can sometimes have unexpected results. Having safeguards in place to automatically stop and revert experiments is essential, especially when running experiments with a large blast radius or on production systems.
That’s why Gremlin includes Status Checks, automated monitoring checks that send requests to custom endpoints or third-party monitoring tool during an experiment. Using Status Checks, we can keep watch on our systems and automatically end an experiment if something goes wrong. This ensures that our experiments never get out of control, and that our systems can quickly fall back to their normal state.
In this tutorial, we’ll show you how to use Continuous Status Checks to safely halt a Scenario. You can follow along with this tutorial using any application that has a publicly accessible URL, or is being monitored by a third-party monitoring service with a publicly accessible API.
Overview
This tutorial will show you how to:
- Step 1: Create a Continuous Status Check.
- Step 2: Create a Scenario and add the Status Check.
- Step 3: Add targets and run the Scenario.
Prerequisites
Before starting this tutorial, you’ll need:
- A Gremlin account (request a free trial).
- A web application with a publicly accessible URL.
- The Gremlin agent running on your web application’s host.
To install Gremlin, follow our quick-start guide or read our documentation on installing Gremlin. Once your host(s) appear in the Gremlin web app, continue on to the first step.
Step 1: Create a Continuous Status Check
Log into the Gremlin web app and select Scenarios in the left-hand navigation. Then, click Status Checks. You’ll see the following screen (if you already have Status Checks saved, you’ll see them listed below):

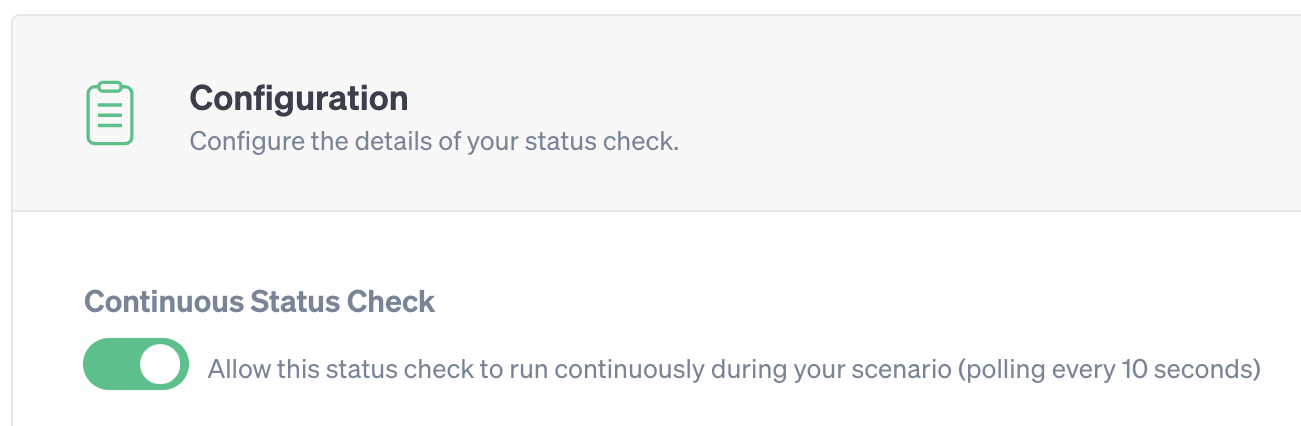
Click New Status Check to open the New Status Check pane. When the pane opens, toggle the Continuous Status Check switch:
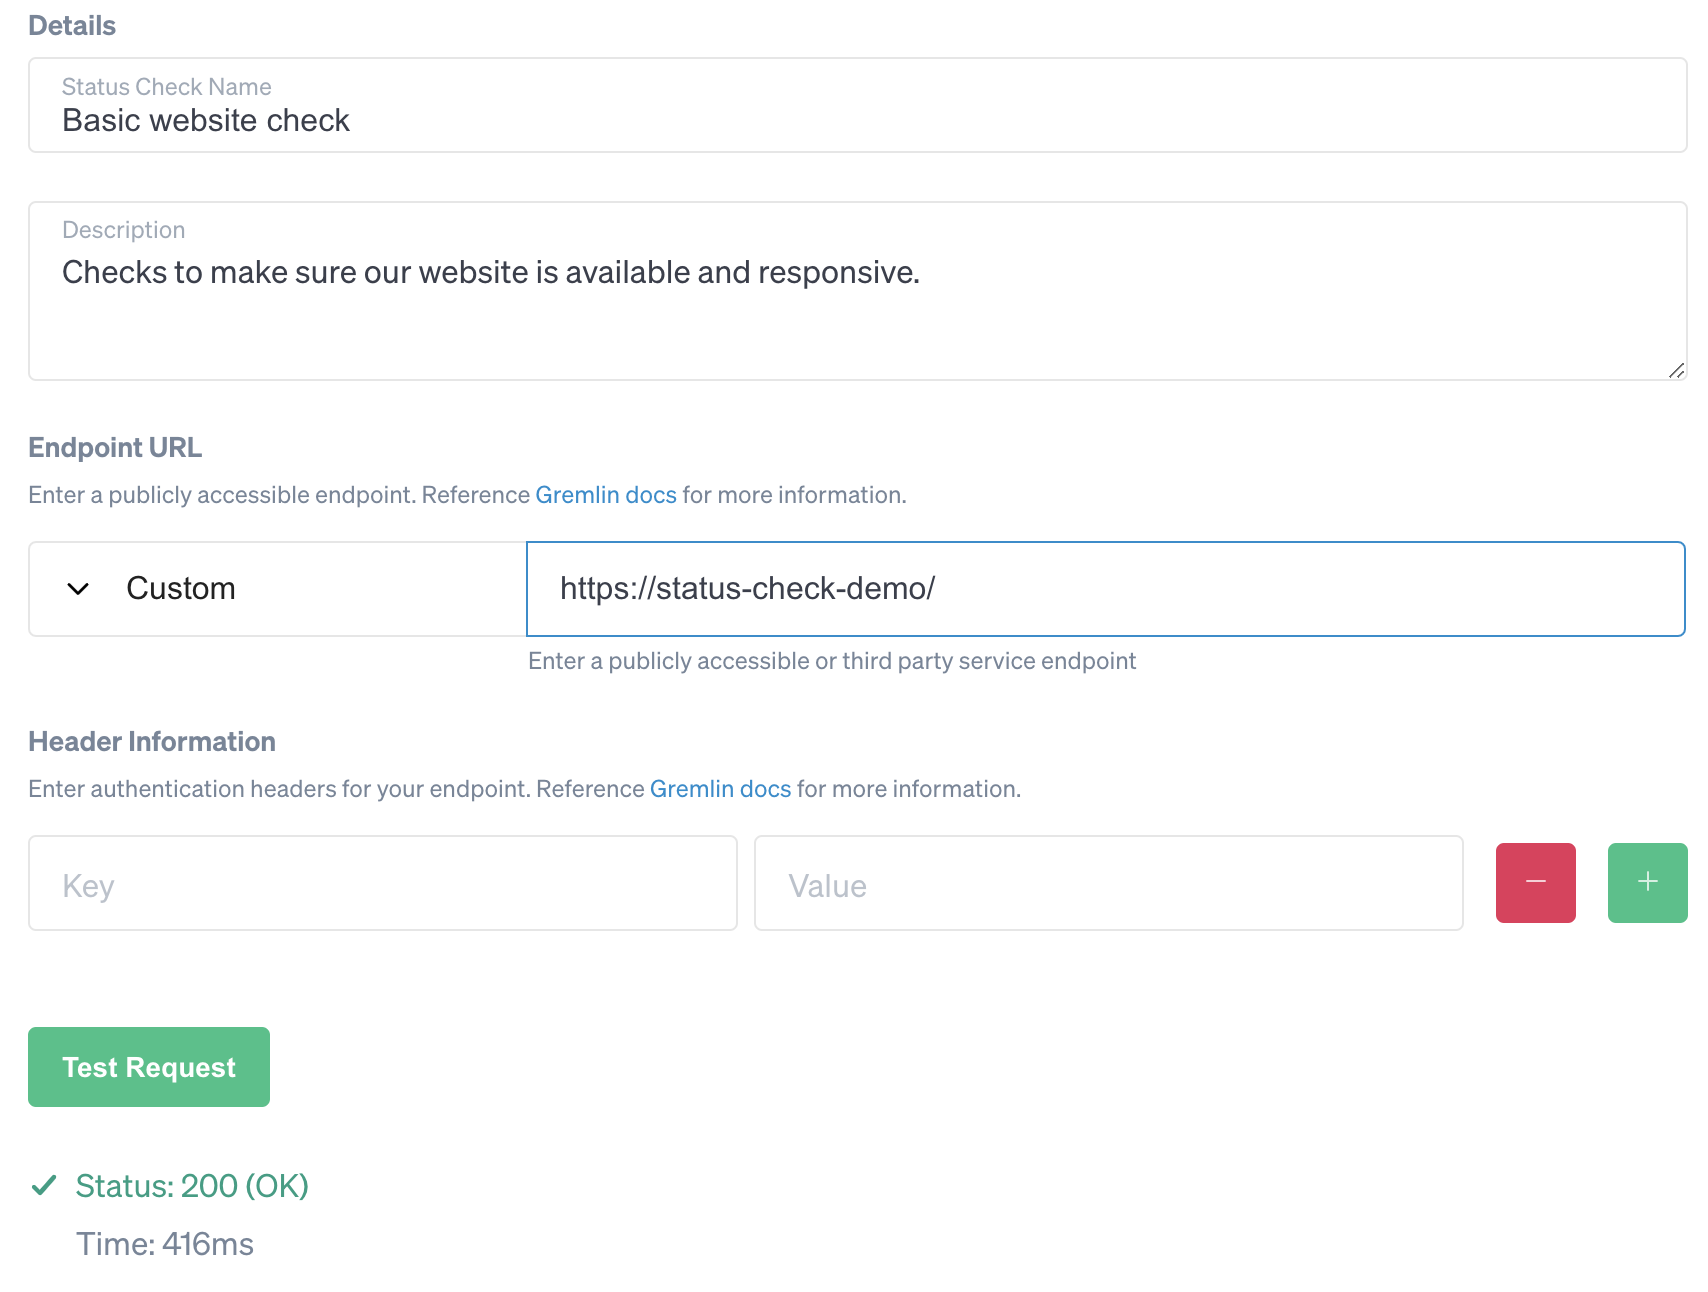
Next, enter a name and a description. We’ll name ours “Basic website check.” The Endpoint URL is the location of our website (or monitoring endpoint if using a monitoring service). We’ll select “Custom” from the drop-down list and enter our website’s URL as the endpoint. Add any optional headers if needed (e.g. Authorization headers), then click Test Request to try reaching the site. Once Gremlin receives a response, we'll see the HTTP status code and response time:
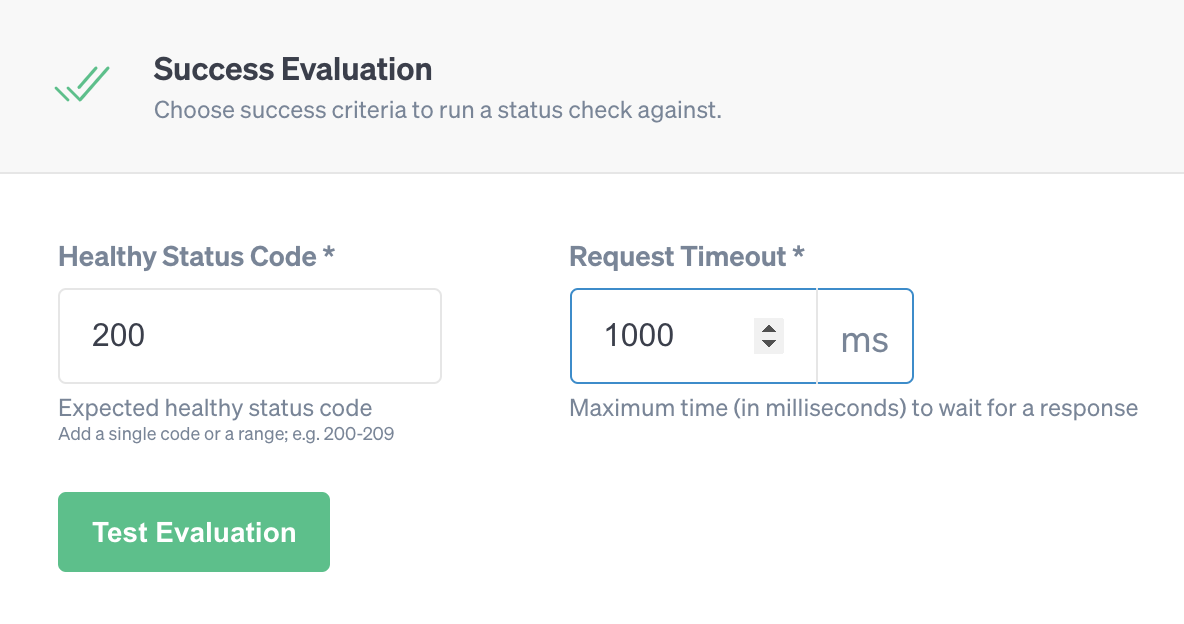
Next, scroll down to the Success Evaluation section. This is where we will set the success criteria for the Status Check. Keep the Healthy Status Code set to <span class="code-class-custom">200</span>. This means that any response with an HTTP Status Code other than 200 will fail the check. For the Request Timeout, we’ll increase it to <span class="code-class-custom">1000</span> ms (one second). You can tweak this to meet your own response time requirements. Once you've entered your criteria, click Test Validation to test them. If the test is unsuccessful, try increasing your timeout. Keep in mind that response times may vary between requests. Once the evaluation is successful, click Save.
Step 2: Create a Scenario and add the Status Check
With our new Status Check saved, let’s create a Scenario. A Scenario is a set of attacks (injections of failure) running in sequence. Scenarios are useful for running different attacks as part of a single chaos experiment, and for gradually increasing the magnitude (the intensity) and blast radius (the scale) of an experiment over time. Scenarios can run a Status Check at any point during their execution, but since the Status Check we created is continuous, we’ll add it once to the start of our Scenario and it will execute every 10 seconds until either the Scenario ends or our website's response fails to meet our success criteria.
Instead of creating a new Scenario from scratch, we’ll use one of the Recommended Scenarios provided by Gremlin. Specifically, we’ll use the Validate Health Checks - Latency Scenario, which gradually adds increasing amounts of latency to network traffic. To open this Scenario, click Scenarios in the left-hand navigation, then click the Recommended tab. Search for “Latency,” then select “Validate Health Checks - Latency” to open the Scenario details page. Scroll to the bottom of the page, then click Customize.
In the customization screen, we can see each of the four attacks that this Scenario will run. Scroll past the final step and click Add a Status Check. Select your saved Status Check from the drop-down list, then click Add to Scenario. The Status Check will appear at the start of the Scenario:
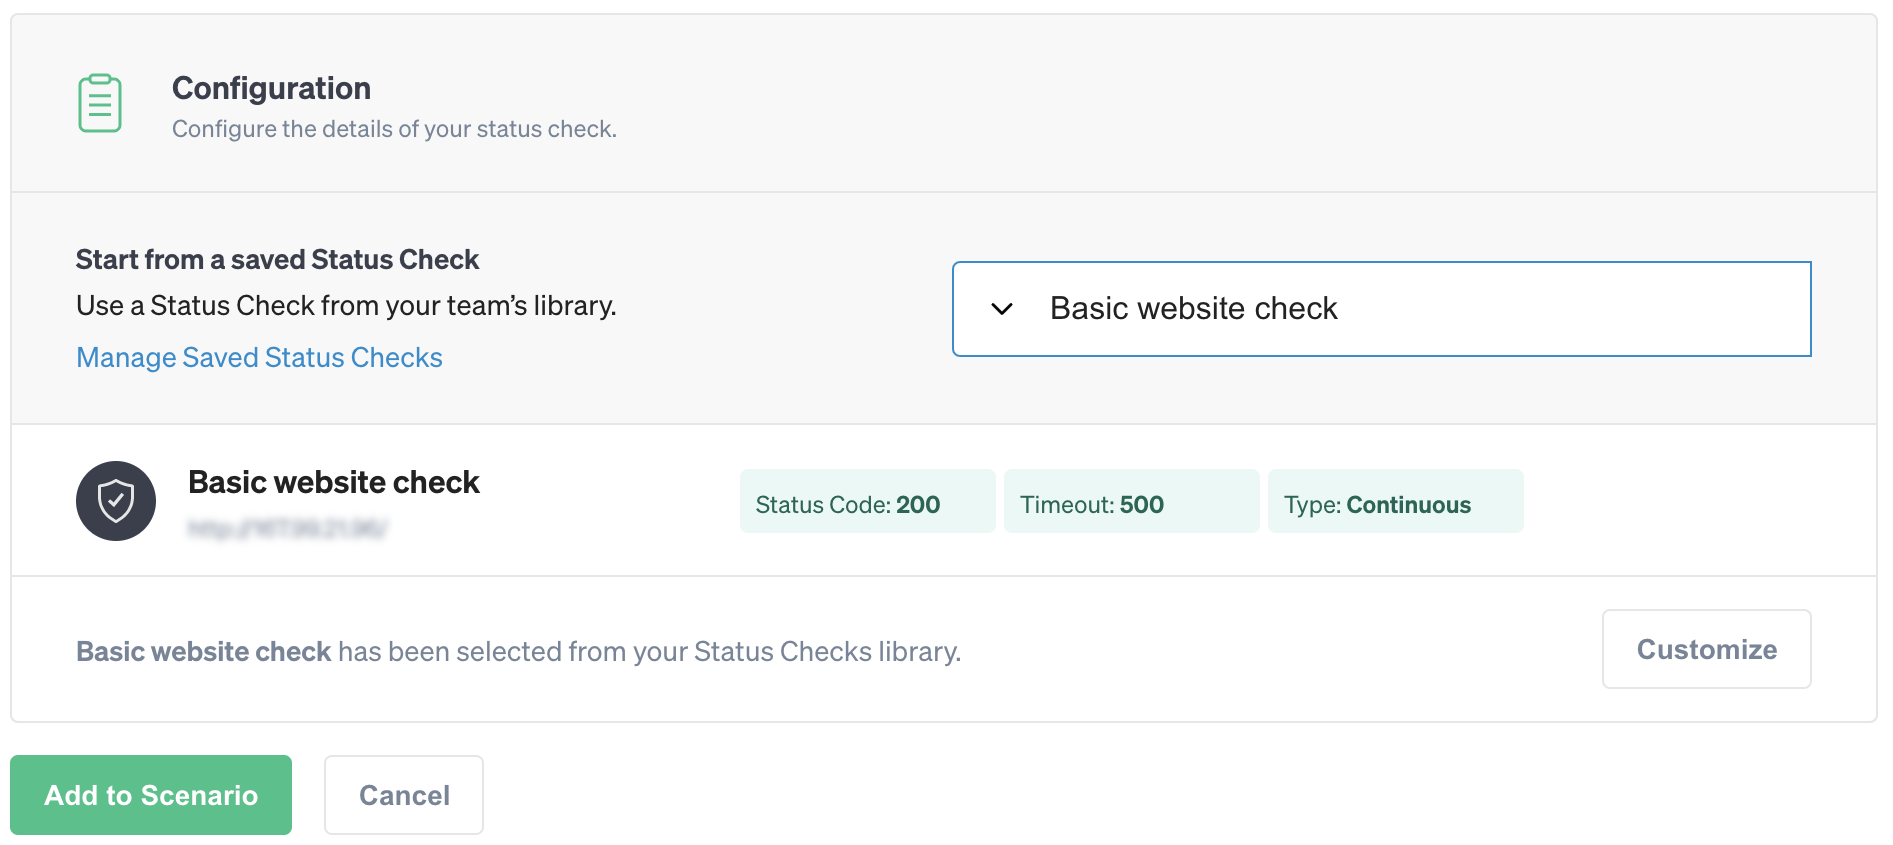
Click Save Scenario to save a copy of the Recommended Scenario.
Step 3: Add targets and run the Scenario
Now that we’ve added our Status Check, we need to define our blast radius by selecting the resources that we want to attack. Start by selecting the first attack in the Scenario to open the target selection screen. Here we can select from hosts, containers, or Kubernetes resources. Our demo application is distributed across a two-node cluster, which we’ve identified using the custom agent tag <span class="code-class-custom">cluster=status-checks-demo</span>:

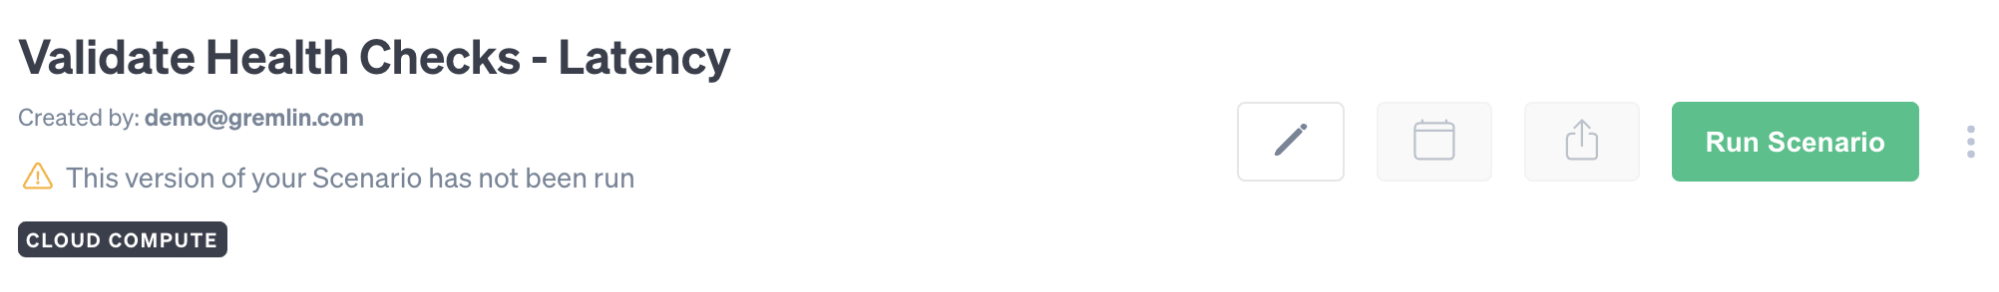
After setting the blast radius, click Update Scenario to save. Repeat this step for the three other attacks, then click Save Scenario. Now we’re ready to start the Scenario. Scroll to the top of the page, click Run Scenario, and confirm.
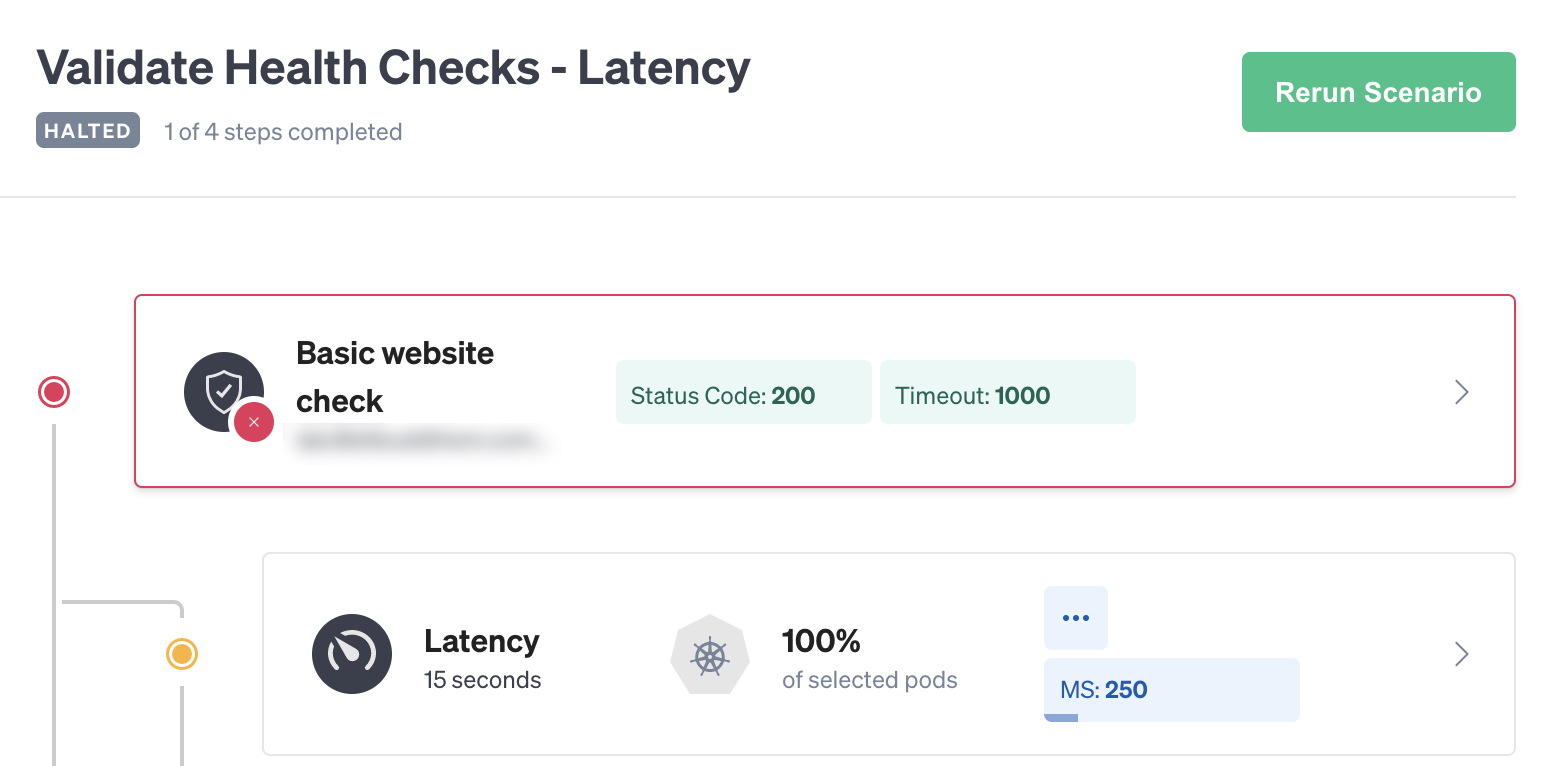
Now we can watch as the Scenario starts. The Status Check immediately starts verifying our website’s responsiveness and will continue to do so every 10 seconds. As soon as the first attack starts, the Status Check indicates a problem and immediately halts the Scenario. Despite us adding only 250 ms of latency, this was enough to cause our website’s response time to exceed 1000 ms. This tells us that our website is far less resilient than we expected, and we should start looking into and addressing causes of latency to avoid impacting our customers.
Clicking on the Status Check opens the Status Check pane, which shows the last response. Here we can see exactly what the issue is. Our website took 2844 ms to respond, which is well over the 1000 ms threshold and over 7x as long as a typical request. If just 250 ms caused a jump this significant, imagine what 300 ms would do, or 500!
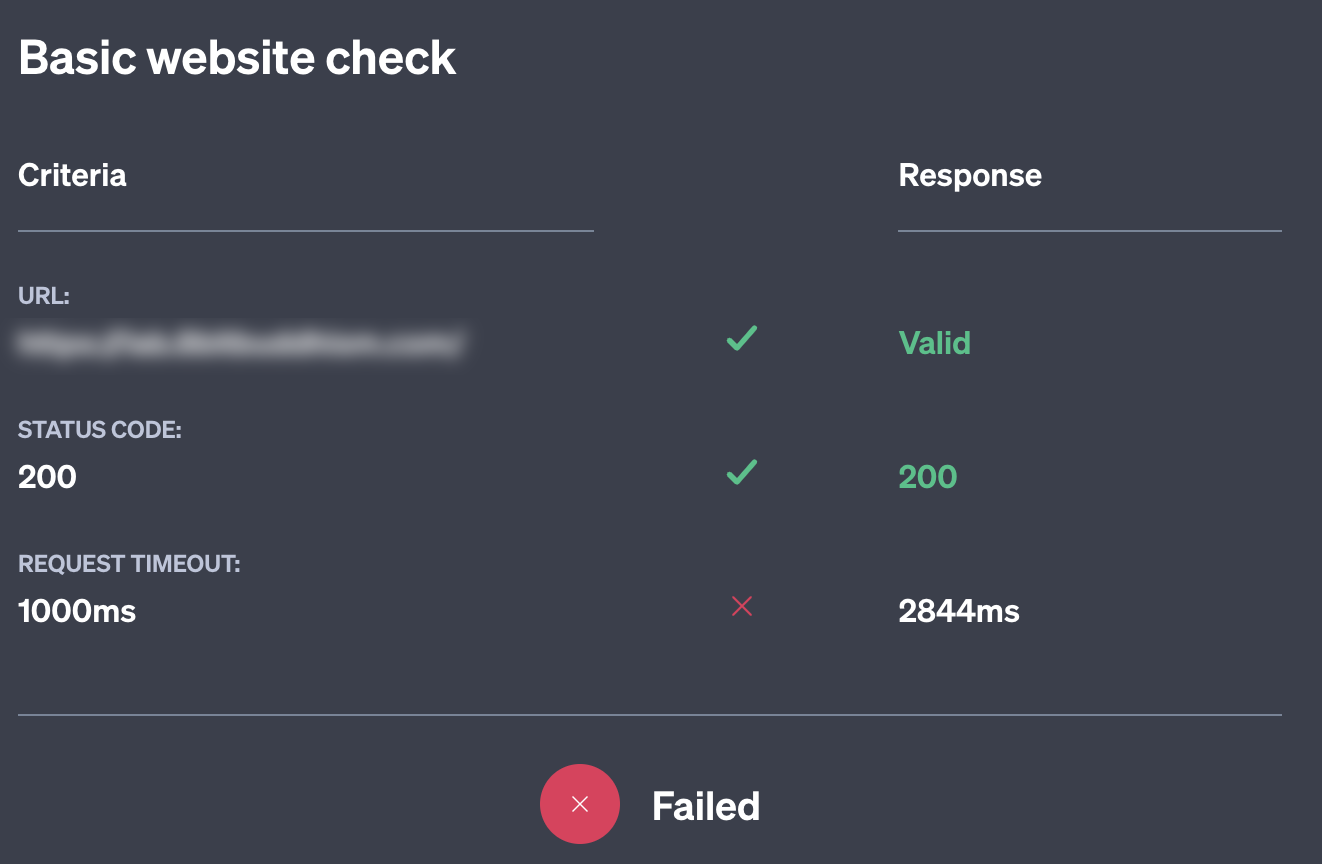
Fortunately for us, the Status Check detected this, automatically halted the Scenario, and returned our systems to normal operation without us having to do anything.
Conclusion
Continuous Status Checks are a convenient and easy way of creating a safety net for your systems during a chaos experiment. This tutorial showed how to use Status Checks with a custom endpoint, but you can also use Status Checks with third-party monitoring tools including Datadog, New Relic, and PagerDuty. Learn more in our Status Checks documentation.
Once you feel comfortable creating and using Status Checks, try out our other Recommended Scenarios and increase your blast radius by targeting more systems. See how far you can push your systems before they reach their limit, and build confidence in running your chaos experiments.
Avoid downtime. Use Gremlin to turn failure into resilience.
Gremlin empowers you to proactively root out failure before it causes downtime. See how you can harness chaos to build resilient systems by requesting a demo of Gremlin.

.svg)