How to use Amazon Cloudwatch with Gremlin

.svg)
.svg)

 This is an older tutorial
In this tutorial, you’ll learn how to use an Amazon CloudWatch alarm as a Health Check in Gremlin. Health Checks are automated checks that monitor a metric, alarm, or URL during a Gremlin experiment. If a Health Check detects that there’s something wrong (e.g. an alarm fires), it immediately stops the actively running experiment and marks it as having failed. This gives you immediate feedback on the results of your experiment, while also preventing an unintentional outage.
For this tutorial, we’ll be using an Amazon EC2 instance, and a single CloudWatch alarm. You’ll learn how to install Gremlin onto an EC2 instance, how to create a CloudWatch alarm that monitors that instance, how to create a Gremlin Health Check that leverages the CloudWatch alarm, and finally, how to use the Health Check in a Gremlin Scenario.
Overview
This tutorial will show you how to:
- Install Gremlin on an Amazon EC2 instance.
- Create an Amazon CloudWatch alarm.
- Customize a Gremlin Recommended Scenario.
- Run a Scenario and record your observations in the Gremlin web app.
Prerequisites
Before starting this tutorial, you’ll need:
- A Gremlin account (sign up for a free trial here).
- An AWS account with permissions to create EC2 instances (you can use a free-tier x86 or Arm instance for this tutorial).
Step 1 - Create your EC2 instance and install Gremlin
First, create a new EC2 instance. We’ll create a simple Linux instance and deploy the Gremlin agent onto it:
- Log into your AWS account and open EC2.
- Click Launch instance and configure your new instance.
- Give it a Name, such as “gremlin-cloudwatch-demo”.
- Select Amazon Linux 2023 or later as the Amazon Machine Image (AMI). You could use another AMI as long as Gremlin supports it, but the instructions in this tutorial will assume Amazon Linux 2023.
- Select an Instance type. You can use a free-tier-eligible type, like t2.micro.
- Select or create a key pair to connect to your instance over SSH. You can also just use EC2 Instance Connect to connect to your instance via your browser.
- Create or select a security group. Make sure to allow SSH traffic if you plan to use SSH to connect to your instance.
- Leave the remaining options set to their default, or configure them how you wish, then click Launch instance.
- Once your instance is up and running, connect to it using EC2 Instance Connect, SSH, or your preferred method.
Next, follow the instructions for installing the Gremlin agent on a virtual machine:
- Log into the Gremlin web app.
- Download your Client Configuration File from the Configuration tab of the Team Settings page.
- In your EC2 instance’s shell, install the Gremlin agent by running the following commands (assuming Amazon Linux 2023 or later):
Finally, we need to apply the client configuration file so the agent can authenticate with Gremlin:
- In a text editor like nano or vim, open
/etc/gremlin/config.yamland replace its contents with the contents of your client configuration file. Save your changes. - Restart the Gremlin agent by running
systemctl restart gremlind.
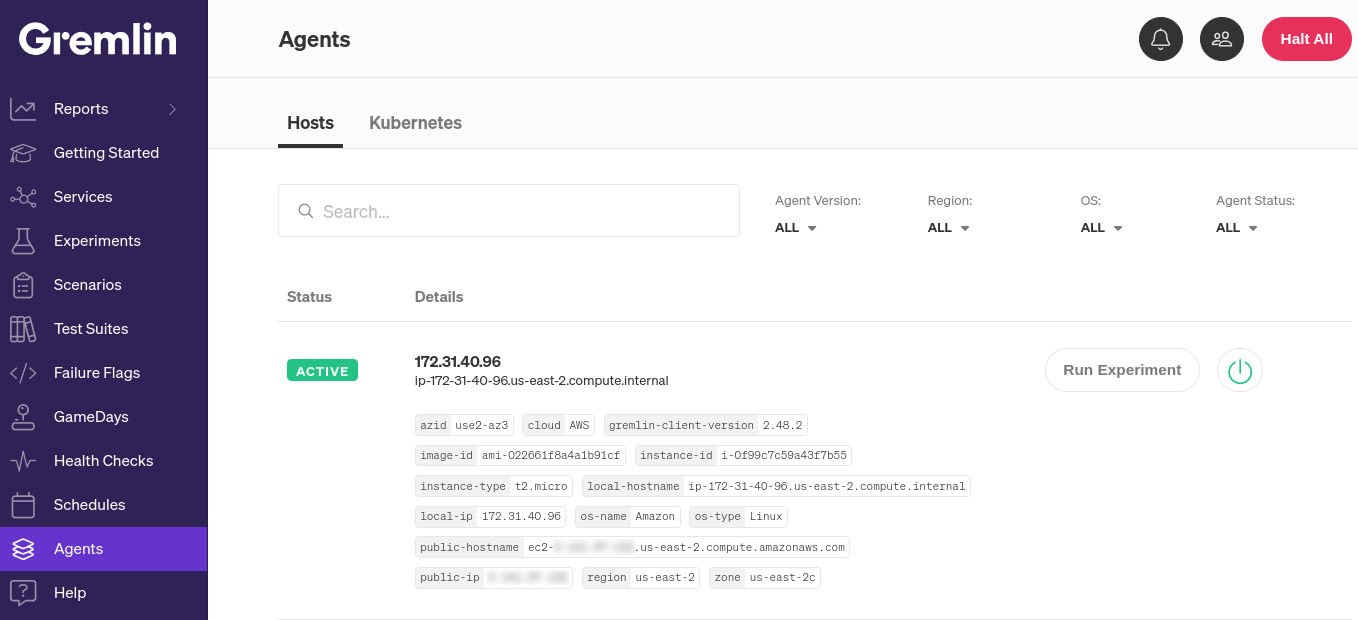
You can check whether the agent was installed correctly by opening the Gremlin web app and checking the Agents page.
At this point, you can close your SSH connection to the instance.
Step 2 - Create CloudWatch alarm
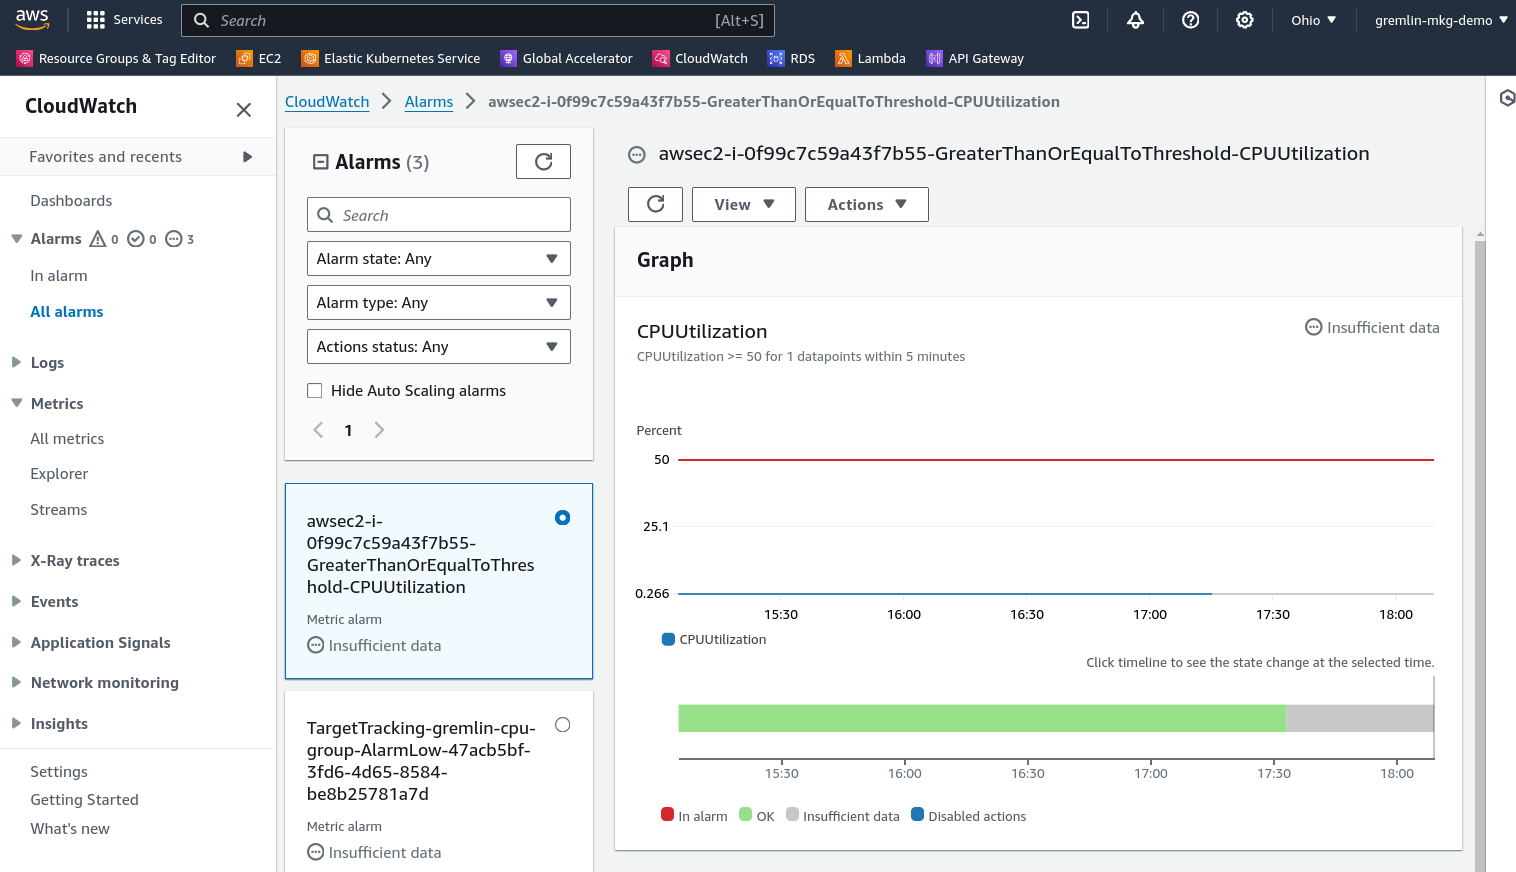
Next, we’ll create a CloudWatch alarm to use with Gremlin. We’ll create a simple alarm that fires if the instance’s average CPU usage exceeds 50% over five minutes.
- Open the EC2 instance list in your browser and find the instance you just created.
- Under the Alarm Status column, click the plus icon next to “View alarms.” This will start the form for creating a new alarm.
- Select Create an alarm if it’s not already selected.
- Disable Alarm notification, since we don’t need to be notified when the alarm fires. Gremlin will query the alarm’s state directly.
- Under Alarm thresholds, set the following parameters:
- Group samples by: Average
- Type of data to sample: CPU utilization
- Alarm when: >=
- Percent: 50
- Consecutive period: 1
- Period: 5 minutes
- Click Create to create the alarm.
Step 3 - Grant Gremlin access to CloudWatch
Now that we have our target instance and our CloudWatch alarm configured, let’s give Gremlin permission to read it. This will let us use the alarm as a Health Check while running Scenarios.
As a reminder, a Health Check is an automated check that monitors the state of a system before, during, and after a Scenario. Gremlin uses Health Checks to verify that the system being tested is still in a healthy state. However, the metrics that define “healthy” can vary between systems, which is why we’ll create a new Health Check that points to our CloudWatch alarm. This way, we can set up our alarms in CloudWatch to fire based on the metrics/SLIs we choose, and if a Scenario causes the alarm to fire because it exceeds our defined thresholds, Gremlin will detect this and immediately stop the experiment. This is also how we determine the criteria for pass/fail when running Reliability Management tests, but that’s a different topic.
To integrate CloudWatch with Gremlin:
- In the Gremlin web app, click on Health Checks in the nav menu.
- Click + Health Check.
- From the Observability Tool drop-down list, select AWS.
- If you’ve already authenticated using AWS, select your account ID from the drop-down list and skip to step 5. Otherwise, select Add a new account ID:
- Select IAM role as the authentication type. You can use a service account instead, but an IAM role is the recommended method.
- For the role creation method, select Cloud Formation. Gremlin will automatically configure the correct roles for you. You can manually set them up instead if you need more control.
- Click the Launch Stack button to launch a new tab. This will open in AWS, and if you’re logged in, it will prompt you to grant access to Gremlin.
- After you create the template in AWS, copy the RoleARN from the stack outputs and paste it into the AWS IAM Role ARN box.
- Click Save.
- Click Next.
- Enter a name for the Health Check. We recommend using the same name that you used to create the monitor in CloudWatch.
- Check Create a Health Check from an AWS CloudWatch Alarm URL, then copy and paste the URL for the alarm from AWS into the Monitor or Alert URL text box. To get the URL, open your list of alarms in CloudWatch, click on the alarm’s name, then copy the URL from your browser.
- Click Test Health Check to confirm that Gremlin can access and evaluate the alarm.
- Click Create Health Check.

Step 4 - Create and run a Scenario using your CloudWatch Health Check
Now it’s time to put our EC2 instance, CloudWatch alarm, and Health Check to the test! We’ll use one of Gremlin’s pre-built Recommended Scenarios: Scalability: CPU. This Scenario simply consumes CPU in three stages: first, it consumes 50% for five minutes, then 75% for five minutes, then 90% for five minutes. We’ll also add our Health Check to this Scenario.
- Open the Scalability: CPU Scenario by clicking this link. Alternatively, you can open the Gremlin web app, selecting Scenarios, selecting the Recommended tab, then clicking View Details on the Scalability: CPU card.
- Click Customize.
- Under Health Checks, click Add Health Check and select the Health Check you just created.
- Click Update Scenario.
- Next to each of the CPU experiments, click the menu button, then click Edit.
- Select your EC2 instance as the target. The easiest way to do this is to enter your instance’s hostname, ID, or IP address in the search box and click on the result. You can confirm that you’re only targeting your EC2 instance by looking at the chart to the right.
- Click Update Scenario, then repeat steps 5–7 for the other two experiments.
- Click Save Scenario. Your Scenario steps should look similar to the screenshot below.
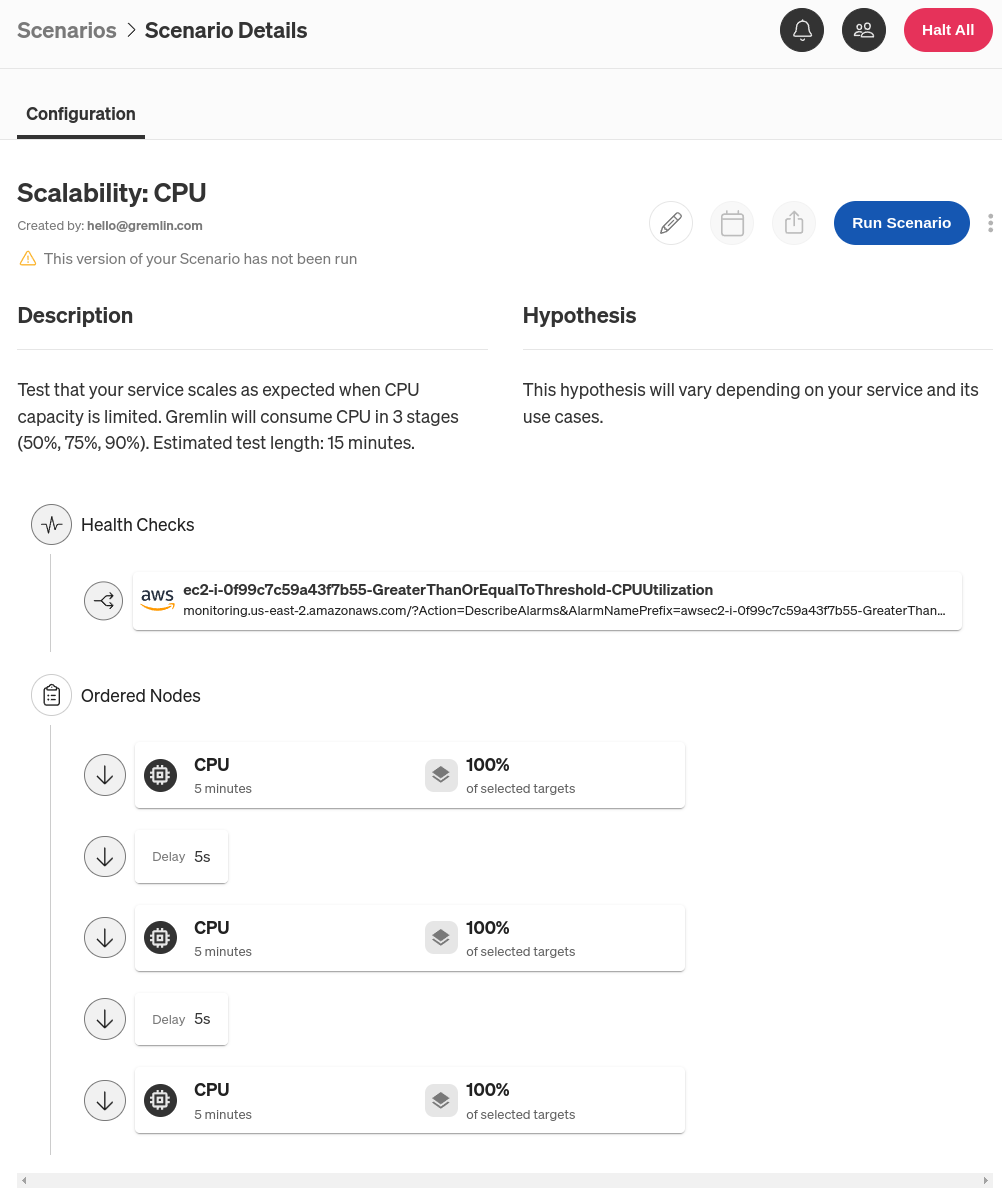
Now for the moment of truth: click Run Scenario to start the Scenario! It will take a few seconds for the Scenario to start running as Gremlin distributes the experiment to the instance. If you have metrics enabled (which they are by default), you can see CPU utilization start to increase.
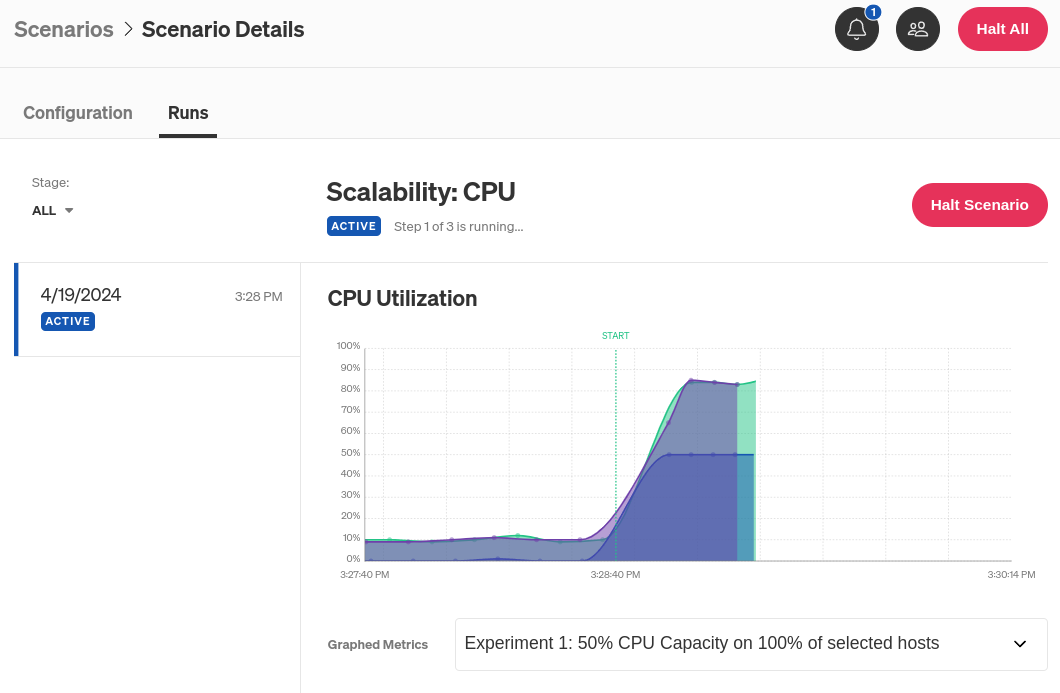
If you’re interested in seeing what’s going on behind-the-scenes, you can click on any of the experiment nodes for an in-depth view. You can also click on the Health Check to see the most recent response retrieved from CloudWatch, and the criteria Gremlin is comparing it against:

Unsurprisingly, the Scenario fails after a few minutes. If we click on the Health Check, we can see why: our CloudWatch alarm fired because CPU usage exceeded the threshold. Gremlin detected this, immediately stopped the currently running step, and marked the Scenario as having failed. Gremlin will save the Health Check and CPU metrics from this run, and we can record any observations in the results screen so we can refer to them later.

Next steps: running a reliability test
Now that you’ve set up your Health Check, you can simplify things by defining your EC2 instance as a service. Gremlin will automatically create a set of Scenarios specifically for your instance, and create a reliability score that measures how reliable your instance is based on which Scenarios it passes or fails. It will even automatically detect any dependencies your instance is talking to.
How does this work? In the Gremlin web app, select Services from the nav menu, then click + Service. Enter the name of your EC2 instance as the service name, make sure the type of service is set to “Host,” then click Next. Select your instance the same way you did when editing the Scenario (i.e. by instance name, hostname, or IP address), then click Create Service. This creates a service with a set of Scenarios called “Reliability Tests” ready to run, but before we can do this, we need to re-add our Health Check. Just click + Health Check, select your CloudWatch alarm like before, then click + Add. Now, if you go back to the service’s page, you can click on any of the Reliability Tests to run them. Gremlin will run them, monitor your CloudWatch alarm, and if the test completes without any problems, Gremlin marks it as passed. If the CloudWatch alarm goes into alarm mode, or for some reason the test can’t finish, Gremlin will mark it as having failed.
You can schedule these tests to run automatically, add more Health Checks, and even change which tests you can run. You can also add more EC2 instances or other resources as other services and run the same test suite on them to ensure they’re reliable as well. Check out our Reliability Management quick-start guide to learn more. For now, congrats on setting up your Amazon CloudWatch integration!
Avoid downtime. Use Gremlin to turn failure into resilience.
Gremlin empowers you to proactively root out failure before it causes downtime. See how you can harness chaos to build resilient systems by requesting a demo of Gremlin.

.svg)