How to run a Status Check on a private endpoint using private network integrations


.svg)
.svg)

 This is an older tutorial
Introduction
In this tutorial, we’ll show you how to create and run a Status Check to monitor a service hosted on a private network. With the release of private network integrations, Status Checks and Webhooks can now integrate with systems behind a firewall, within your virtual private cloud (VPC), and on-premises. This way, you can increase automation without having to expose internal endpoints to the public Internet.
Overview
This tutorial will show you how to:
- Step 1: Deploy the Integration Agent.
- Step 2: Create a Status Check.
- Step 3: Add the Status Check to a Scenario.
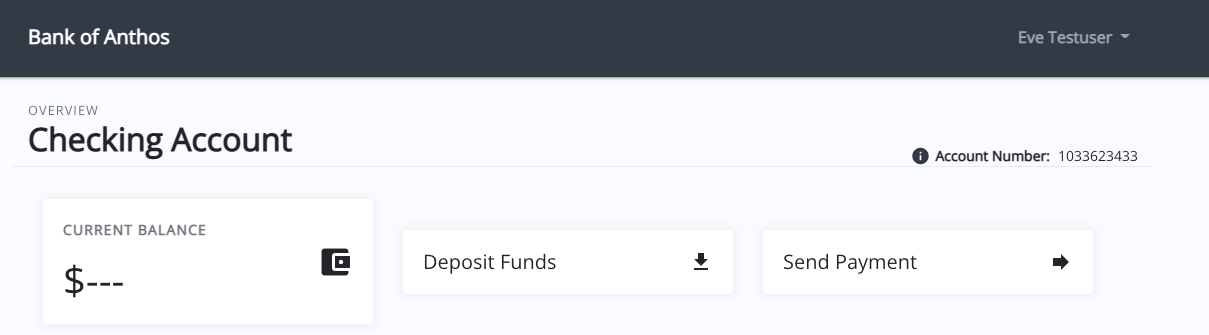
Throughout this tutorial, we’ll be taking on the role of an SRE at the fictional Bank of Anthos, a global bank with strict requirements for availability and low latency. One of the services that we’re responsible for is the <span class="code-class-custom">balancereader</span>, which reads customer balances from the ledger and presents it to the customer as “Current Balance”:
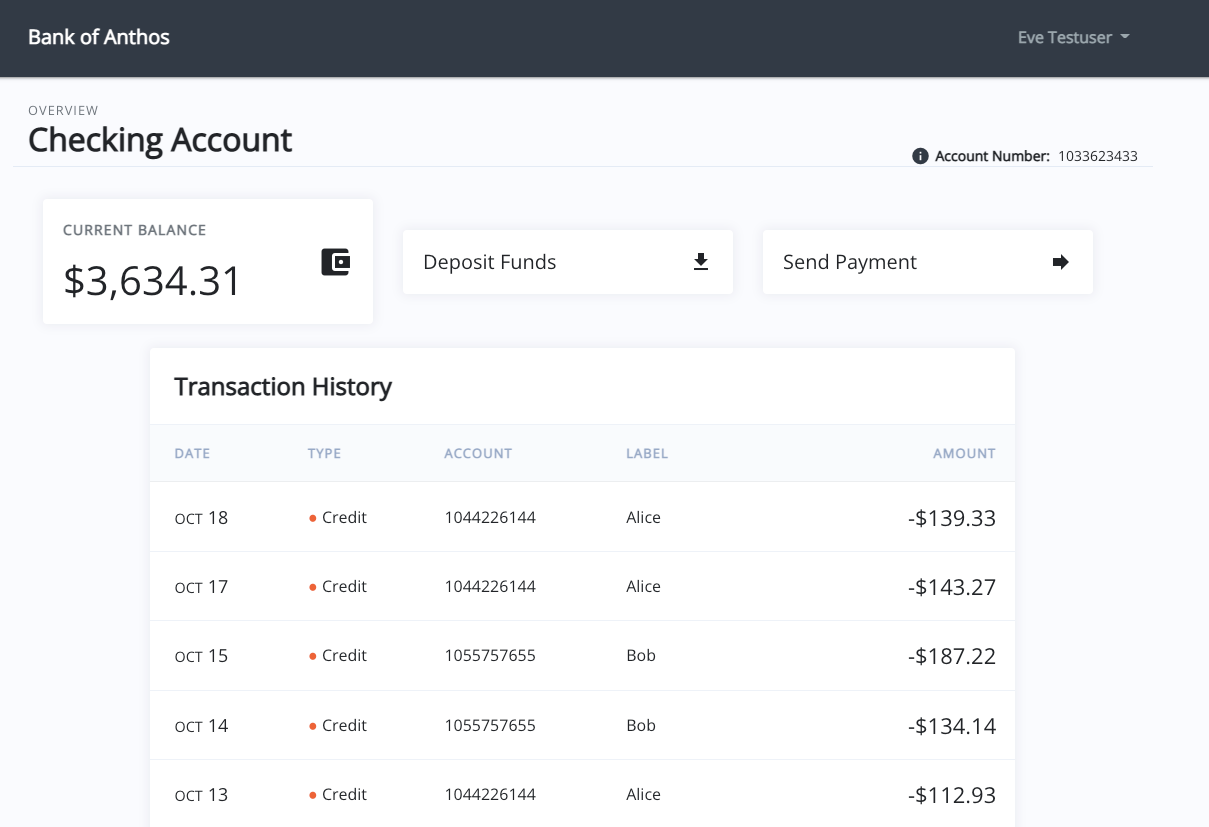
This is a critical and sensitive service, so we don’t want to risk our experiments introducing too much latency or taking the service offline. We also can’t expose this service to the Internet due to security concerns. We’ll create an internal Status Check to automatically monitor this service and halt any active experiments if performance degrades beyond a certain threshold.
Prerequisites
Before starting this tutorial, you’ll need:
- A Gremlin account (request a free trial).
- A web application running on a host. In this tutorial, we’ll use a Kubernetes cluster running the Bank of Anthos, an open source example banking application.
- Gremlin deployed to your Kubernetes cluster.
If you don’t have a Kubernetes cluster or Bank of Anthos deployed, that’s fine: you can use any web application. Just be aware that you will need to install Gremlin to your host and run attacks on the host instead of on a Kubernetes resource.
Step 1: Install the Integration Agent
We first need to install the integration agent. The integration agent is what allows us to run Status Checks and Webhooks internally within our network. Like the Gremlin agent, this agent only requires outbound access to the Internet over port 443. If we configure a Status Check or Webhook to run within our private network, then the integration agent will run the Status Check or Webhook itself, instead of Gremlin’s backend systems. It essentially proxies Status Checks and Webhooks so that they can reach your internal systems, avoiding the need to expose them to the Internet.
Install the agent by following the installation instructions in our documentation. You will also need to authenticate the agent with your Gremlin team. Follow our advanced configuration instructions to edit the integration agent configuration file, which is stored at <span class="code-class-custom">/etc/gremlin/integrations-config</span>. We’ll show you how to validate that the agent was installed and configured correctly in step 2.
Step 2: Create a Status Check
Now that the integration agent is running, let’s create a Status Check. This Status Check will check our bank’s frontend, which is available at http://192.168.68.101/ (your own IP address will be different, so replace this where necessary).
First, log into the Gremlin web app. Next, click Scenarios on the left-hand navigation bar, then click Status Checks at the top of the page. Click New Status Check to open the Status Check creation pane.
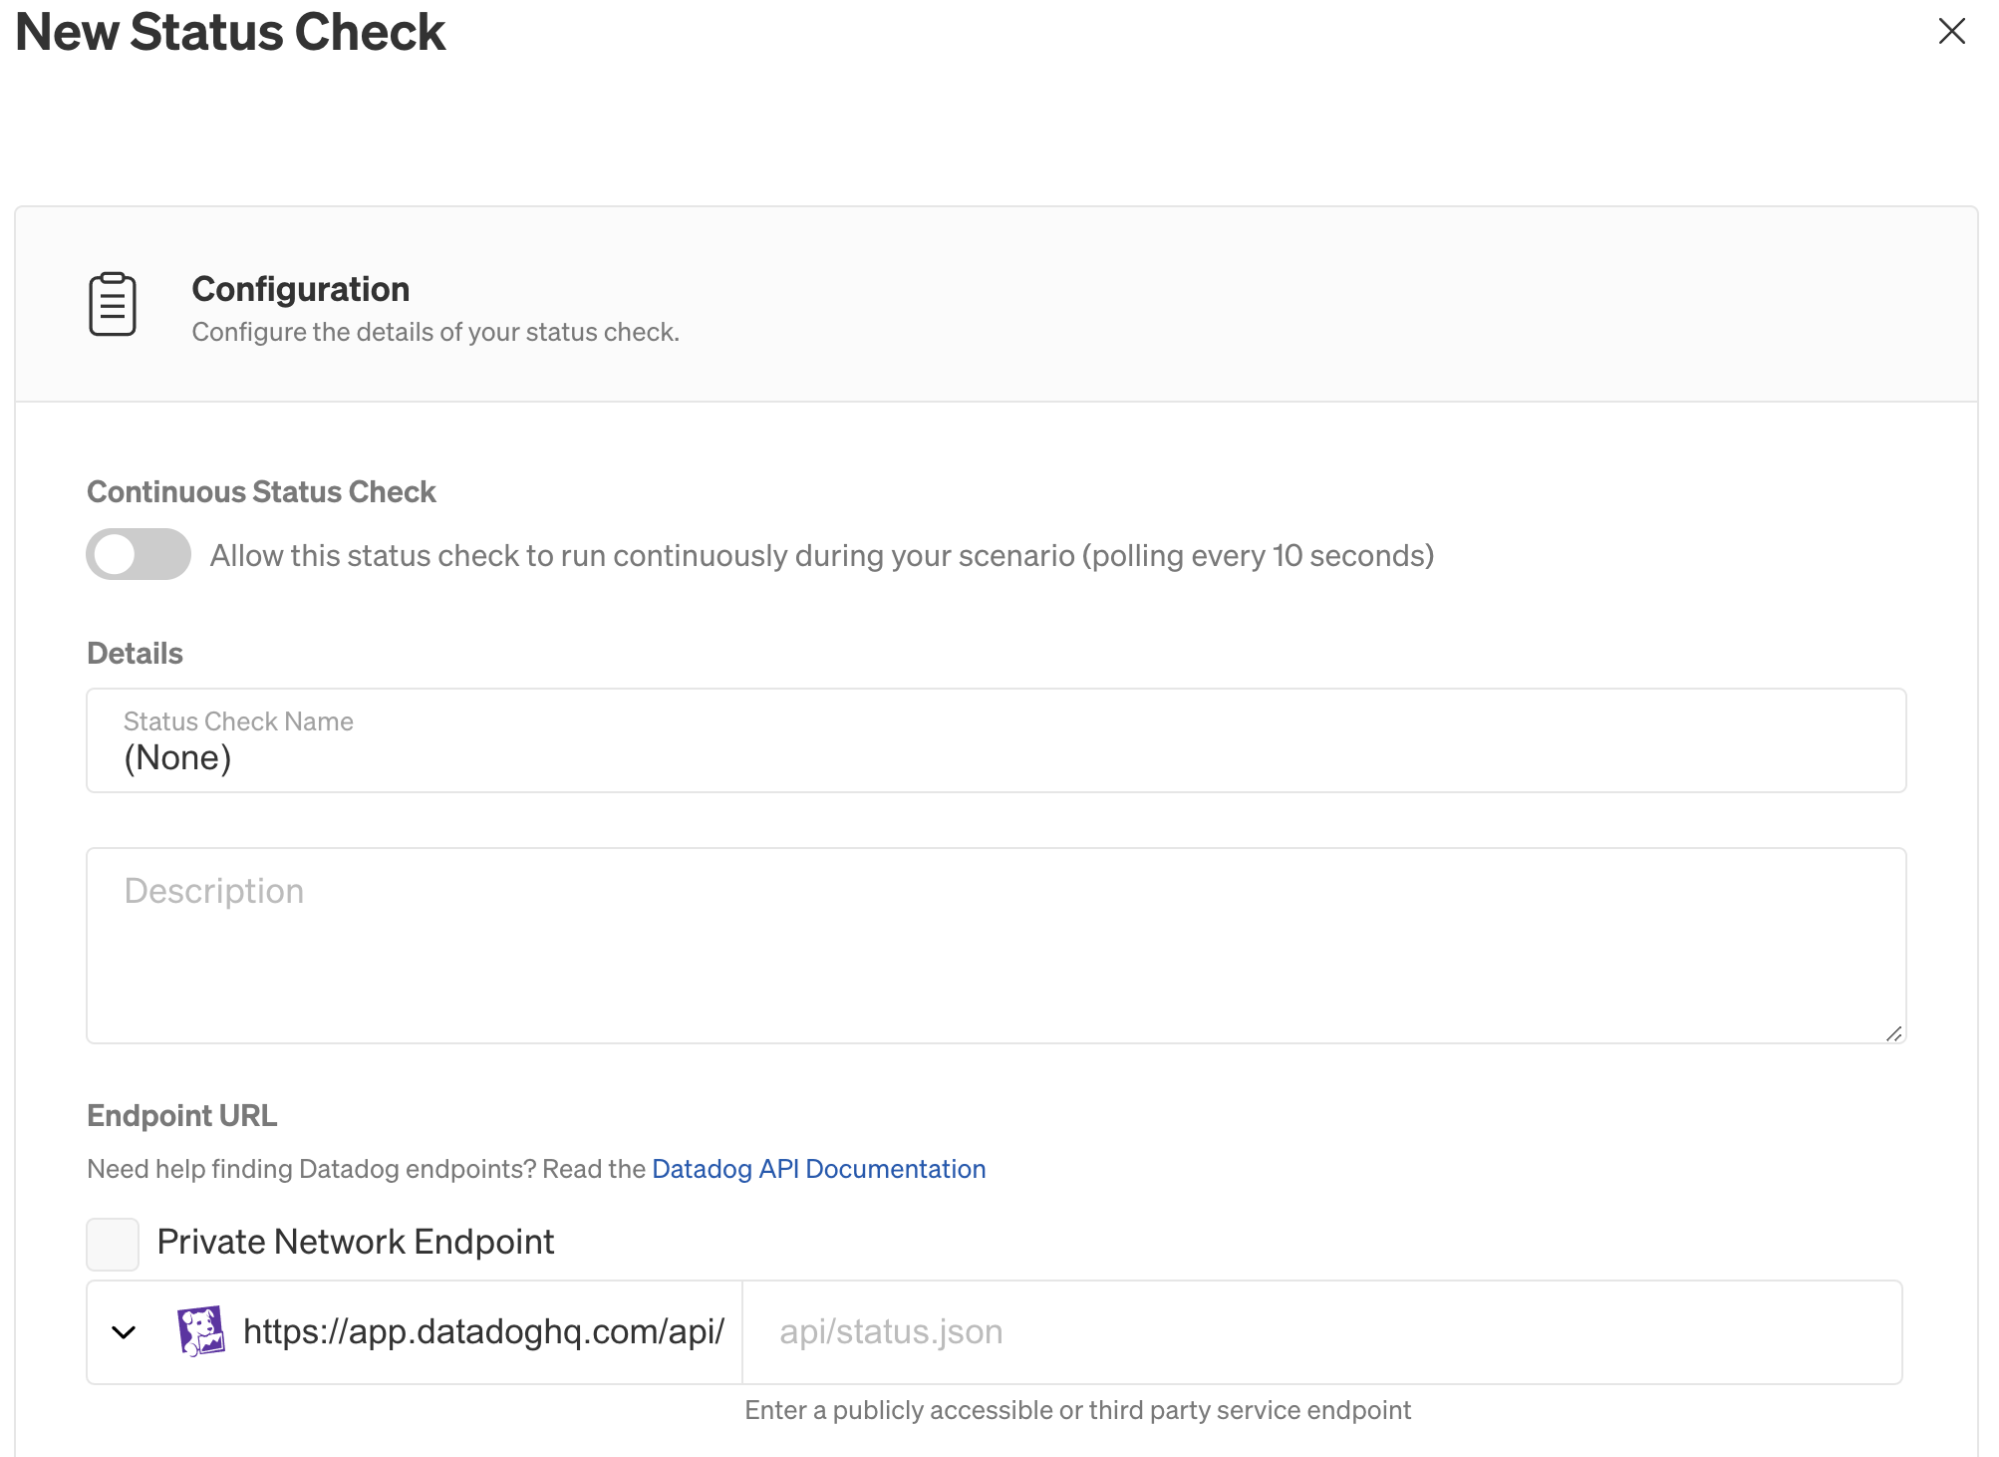
Let’s configure this Status Check:
- Click the Continuous Status Check toggle. This will run the Status Check every 10 seconds while the Scenario is running.
- Enter a name in the Status Check Name field. We’ll call this “Internal banking site check”.
- Optionally, enter a Description of this check to explain what it’s used for. For example, we’ll enter “Checks our internal banking service to ensure it’s still healthy.”
- Under Endpoint URL, check the Private Network Endpoint checkbox to indicate that this is a privately accessed URL. This disables the dropdown field and enables the URL text field, allowing you to enter the URL of the service you want to check. We’ll enter the internal IP address of our application, which in this case is
http://192.168.68.101/.NoteIf you don’t have the Integration Agent installed, a warning message will appear. You can still enter a URL and save the Status Check, but it won’t run. Make sure you have the Integration Agent installed and running before configuring this Status Check. If you run into problems, check the documentation. - Enter any HTTP headers you want to send in the Header Information fields. This is useful if your web application requires additional data, such as authentication credentials. You can add multiple headers using the - and + buttons to the right of the value fields. Otherwise, you can leave this blank.

- Click Test Request to run the Status Check. If successful, Gremlin will show the response contents underneath the Test Request button. Double-check this to make sure that this is the response you expected.

- Under Success Evaluation, enter the criteria that you want to use when evaluating the health of your systems.
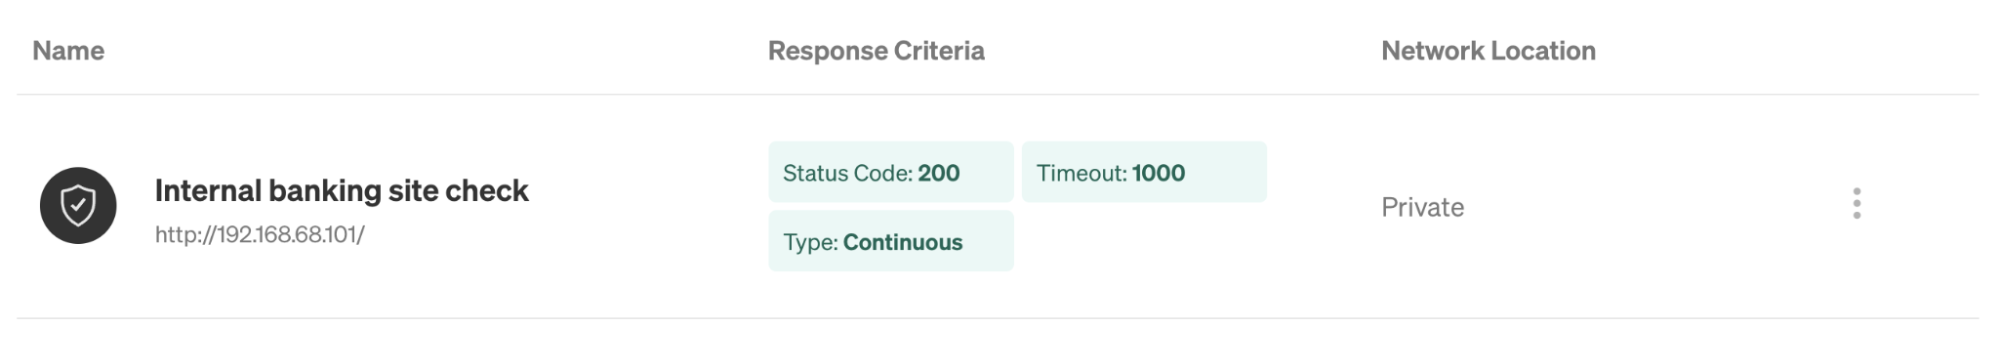
- In Healthy Status Code, enter the HTTP Status Codes that are considered healthy for your web application. This defaults to 200, but you can also enter a range of codes, such as 200-209. If the response contains an HTTP Status Code outside of this value, then the application is considered unhealthy and the Status Check halts the Scenario.
- In Request Timeout, enter the maximum time (in milliseconds) that the response should take before the service is considered unhealthy. This defaults to 500, but we’ll increase this to 1000. If the response time takes longer than this, then the Status Check halts the Scenario. If your team has SLOs or SLIs around response time, you should set this value to match them.
- Click Test Evaluation to send a test request and evaluate the response against your success criteria. If it fails, you can adjust your success criteria and repeat the evaluation until it’s successful.

- Click Save to save your new Status Check.
Our new Status Check appears in the list, and now we can add it to any new or existing Scenario.
Step 3: Add the Status Check to a Scenario
Next, let’s add our Status Check to a Scenario. We’ll start with a Recommended Scenario: Validate Health Checks - Latency, which runs a series of Latency attacks on our service. Click on the link (or the Run Scenario button below) to open this Scenario:
- Click the Customize button to edit the Scenario.
- Scroll to the bottom of the window and click Add a Status Check.
- Click the Start from a saved Status Check dropdown, then select the name of the Status Check you just created (e.g. “Internal banking site check”).
- Click Add to Scenario.

- For each of the Latency steps in the Scenario, click the Edit icon on the right-hand side and select the systems you want to impact. This should be the container (or host) where your service is running. For the Bank of Anthos, select Kubernetes, then your Bank of Anthos cluster, then the balanceservice Deployment. Remember to click Update Scenario after editing each step.
- Click Save Scenario.
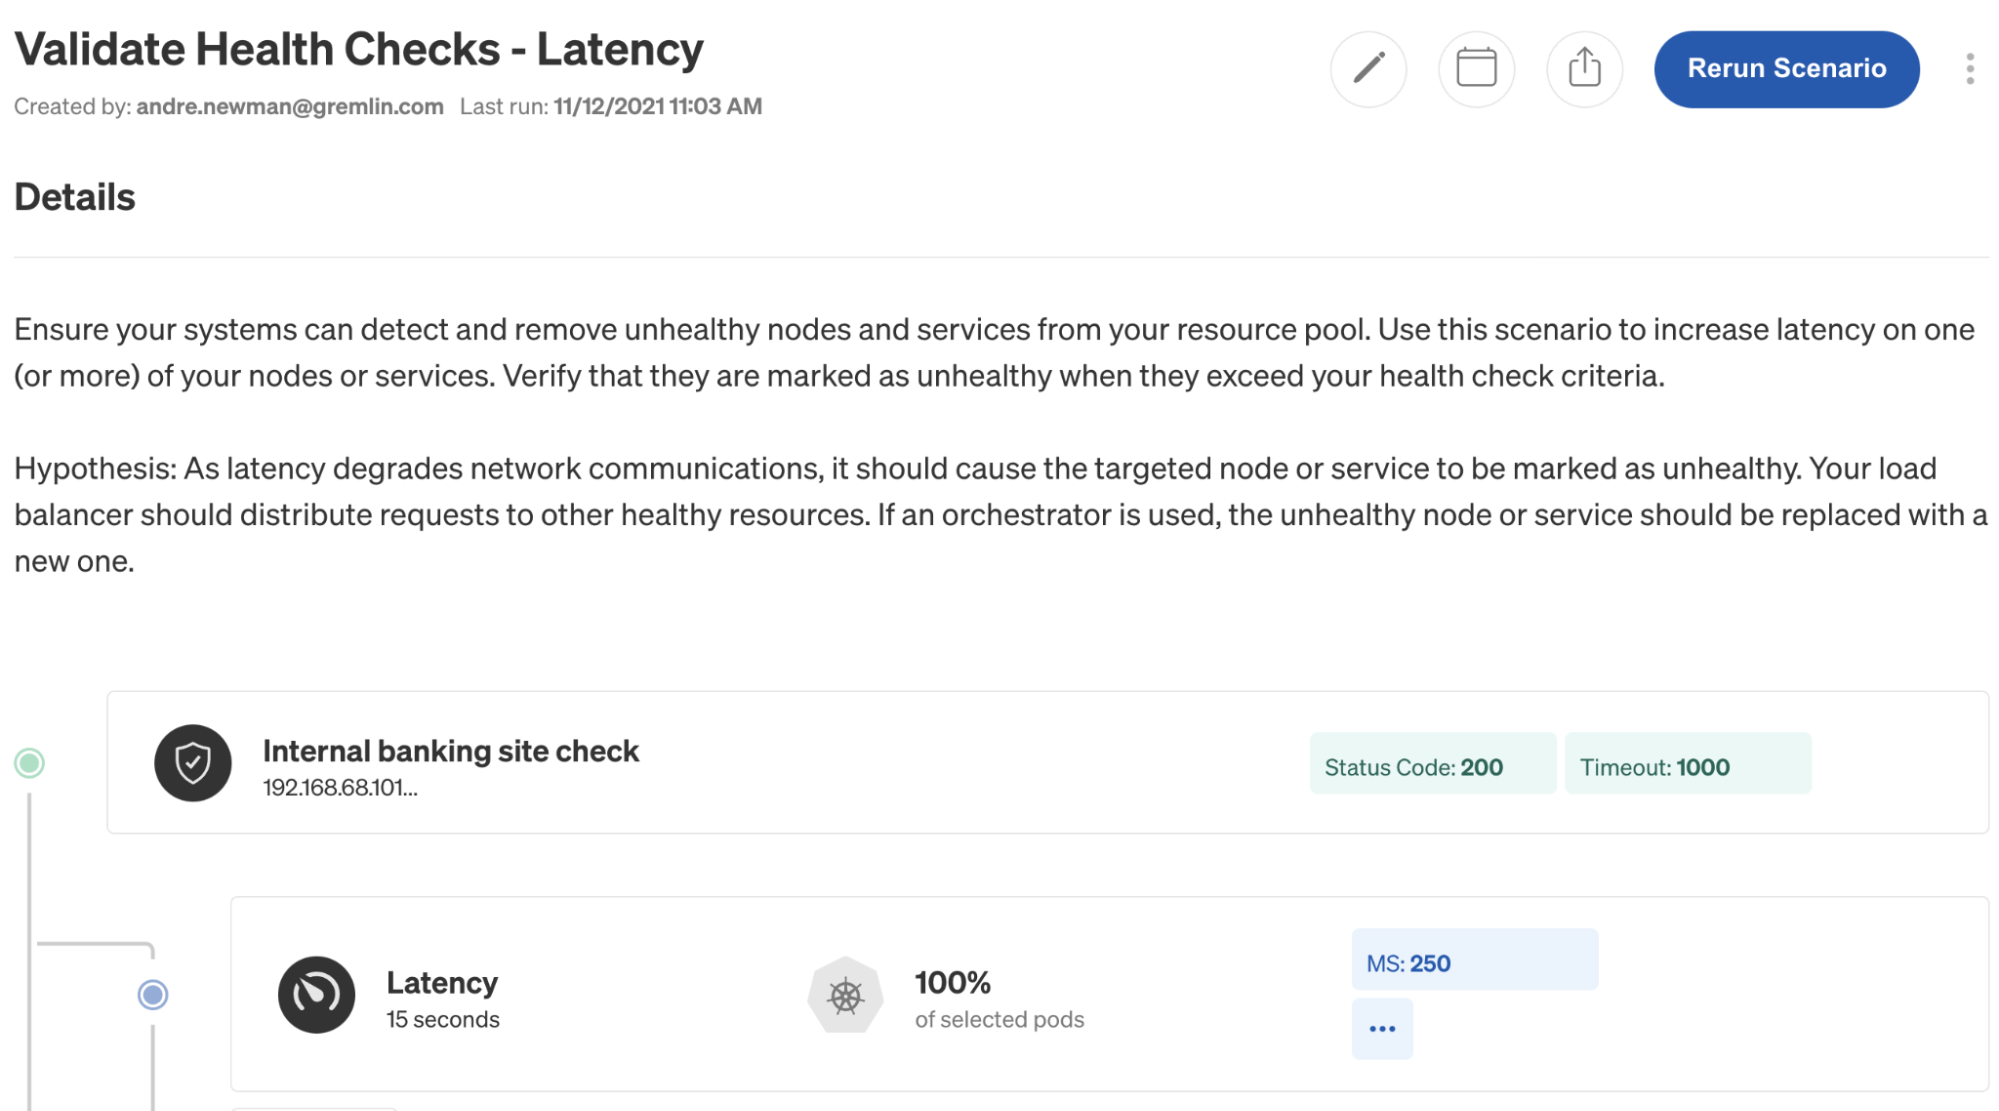
Click Run Scenario in the top right corner. This will run each step in the Scenario sequentially, while also running our Status Check every 10 seconds. On the second step, our latency increases to over 1000 ms, triggering the Status Check to halt the Scenario and revert the impact.

If we visit our website, we’ll see that it loads, but the Current Balance doesn’t appear. This is a big usability problem: If our balanceservice is down and customers open the site, will they think their money is missing? We might want to add a loading indicator to show the customer that we’re retrieving their balance, and if the service is down, add a user-friendly error message asking them to try again later.
We successfully created a Status Check to monitor an internal service, added it to a Scenario, and automatically halted the Scenario when it detected that the service’s response time was outside of our SLIs. This helped us find a usability issue and come up with a solution for improving resilience.
Secure integrations with your internal systems
This tutorial focused on Status Checks. You can also use the integration agent with Webhooks, which let you call custom HTTP endpoints during attacks. For example, you can send the state of an attack to a monitoring tool like Grafana, a CI/CD service like Jenkins, a testing tool like Blazemeter, or any on-premises or privately hosted tool. As long as the integration agent can send an HTTP request to it, you can integrate with it.
To learn more about private integrations, read our announcement blog post, or see our documentation pages on Status Checks and Webhooks.
Avoid downtime. Use Gremlin to turn failure into resilience.
Gremlin empowers you to proactively root out failure before it causes downtime. See how you can harness chaos to build resilient systems by requesting a demo of Gremlin.

.svg)