Highlight the impact of Chaos Experiments in Dynatrace with Gremlin webhooks

.svg)
.svg)

Dynatrace is a provider of application performance monitoring and IT operation intelligence software. In combination with Chaos Engineering experiments from Gremlin, you can tune your monitoring for more actionable data collection and alerting. Additionally, using Gremlin, you can train your team to interpret and investigate issues in your systems using Dynatrace.
If you want to get started using Dynatrace and Gremlin together, check out Ana’s tutorial. This tutorial will help you add webhooks if you want to visually correlate the impact of an attack with the result in Dynatrace.
Prerequisites
- Dynatrace account (get a trial account here)
- Gremlin account (if you don't have an account, request a free trial).
- Installed Dynatrace agent
- Installed Gremlin agent
Step 1: Gather your Dynatrace endpoint and entityId
Go to your Dynatrace controller. Capture your endpoint name from the URL:
- Managed:
- SaaS:
In my case, my endpoint is <span class="code-class-custom">https://kep58706.live.dynatrace.com/api/v1/events</span>.
Then go to the host, application, or other entity that will be attacked. Capture the id. In my case, the entityId is for a host and is <span class="code-class-custom">HOST-5927A0E39CF52333</span>. Keep both of these for Step 3.

Step 2: Generate an API key in Dynatrace
Get your API key. Settings -> Integration -> Dynatrace API -> Generate token.

Name the key <span class="code-class-custom">gremlin</span>. Turn off all options except “Access problem and event feed, metrics, and topology” and click “Generate.”

Save the API key for use in Step 3.
Step 3: Add a Gremlin webhook
Go to Settings -> Team Settings.

Then select Webhooks -> New Webhook.

Add a new webhook with the Name <span class="code-class-custom">Dynatrace Webhook</span>, a description, the endpoint URL from Step 1, then the Header <span class="code-class-custom">Authorization</span> and the Value <span class="code-class-custom">Api-token {your_api_key}</span>. Check “Attack Running” and “Attack Finished.” In the Payload, update the body to be the following, replacing {entity_id} with the id(s) from Step 1:
Click Save.

Step 4: Run a CPU attack
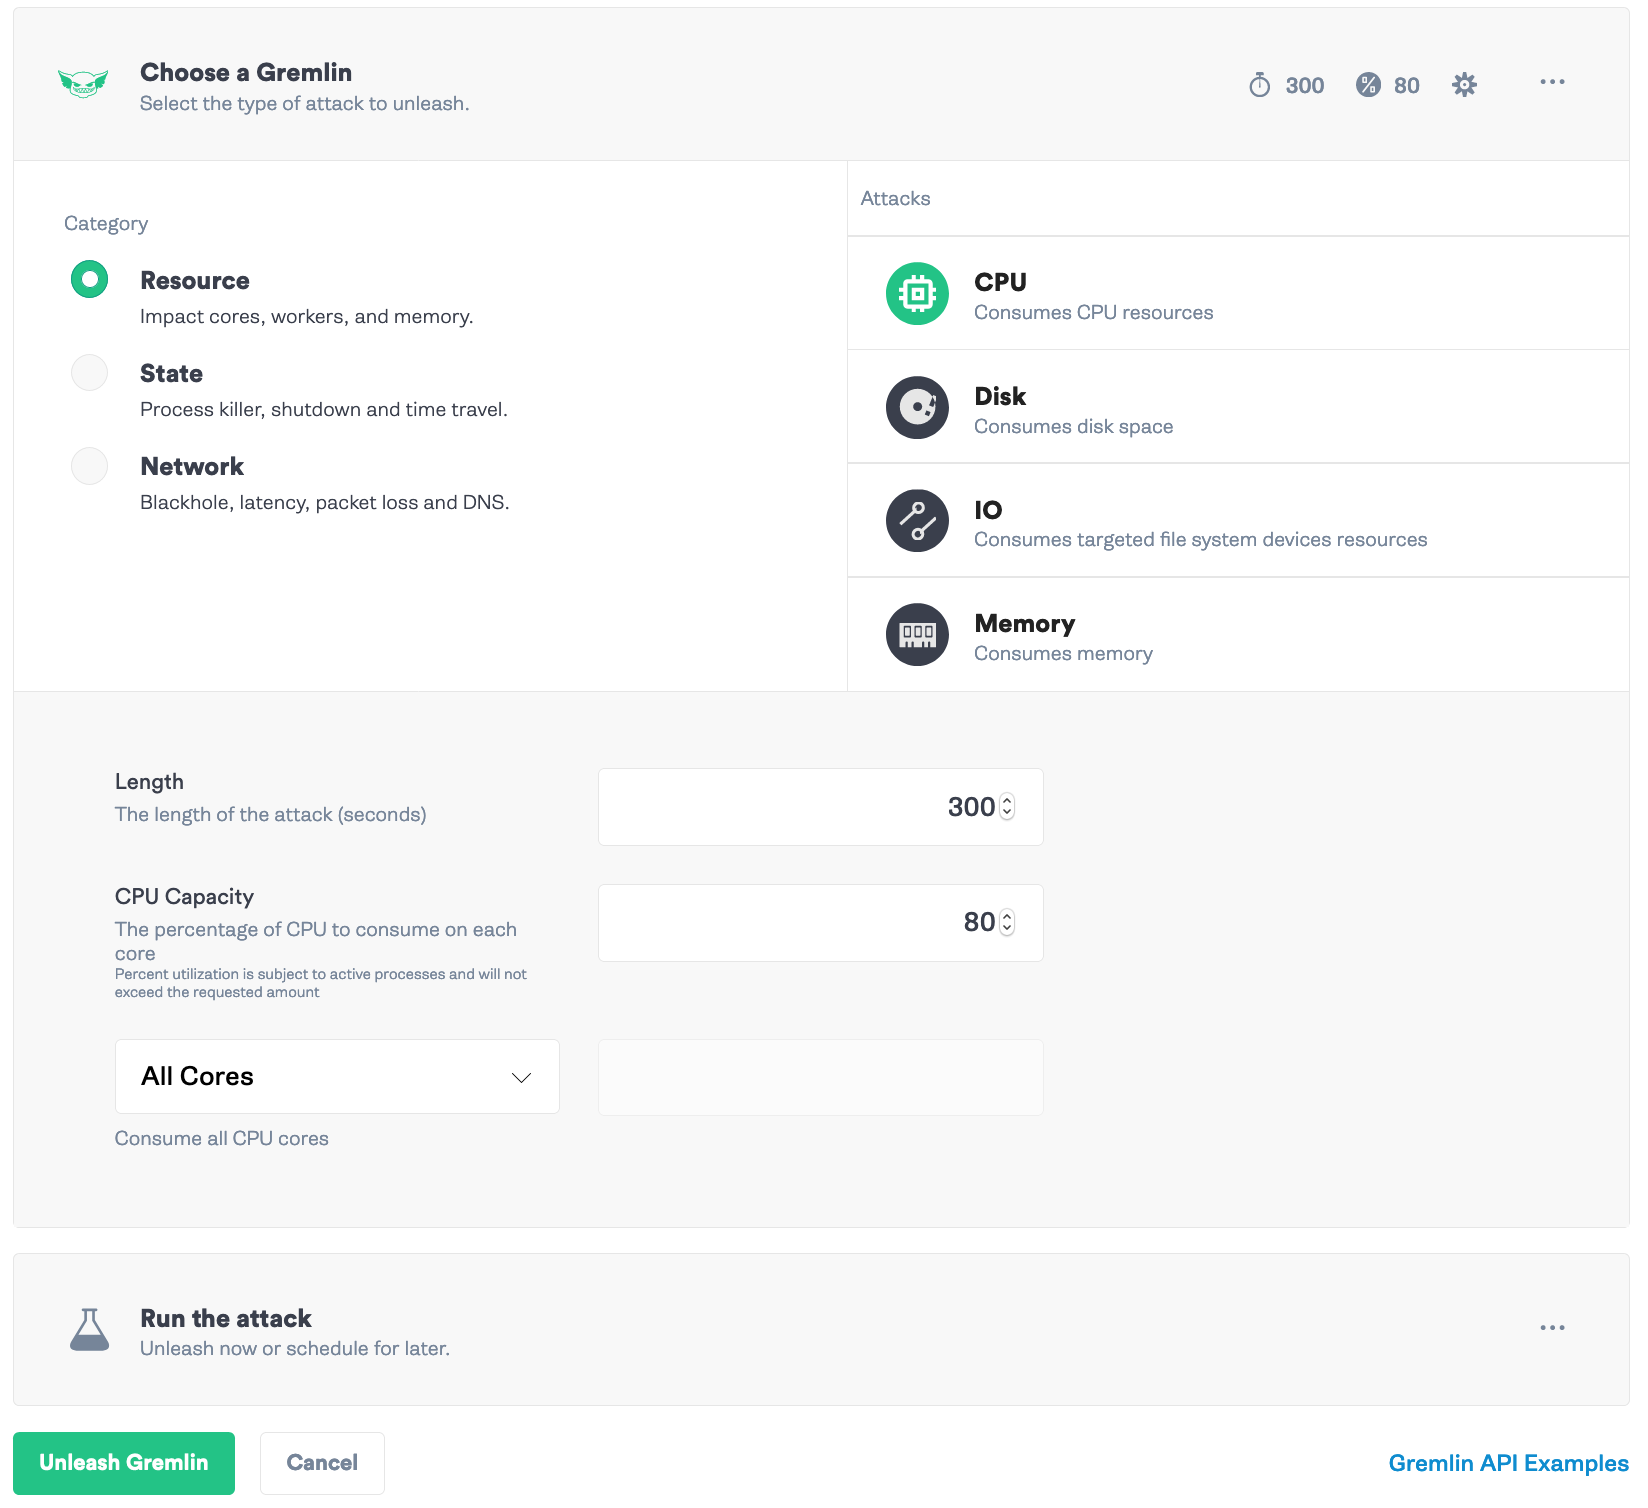
To try out our new annotations, we’ll run a CPU attack. In Gremlin, go to Attacks -> New Attack. Select a host that has a Dynatrace agent. Select Choose a Gremlin -> Resource -> CPU. Set the length to <span class="code-class-custom">300</span> seconds, <span class="code-class-custom">80</span>%, and <span class="code-class-custom">All Cores</span>. Click “Unleash Gremlin”.
Then head over to Dynatrace and select Hosts. Select the Host you just attacked. Check out the CPU Utilization chart and the Events chart to see the Gremlin attack information.

Conclusion
Now you have the ability to visualize Gremlin attacks in Dynatrace with annotations for when attacks are running and finished. This is just one example of what you can do with webhooks and Dynatrace. From here, you can create dashboards for reporting the results of your attacks out to other teams or executives. For example, highlight how your application performed during a scheduled attack and show improvement over time. Try it out and share what you build!
Related


Avoid downtime. Use Gremlin to turn failure into resilience.
Gremlin empowers you to proactively root out failure before it causes downtime. See how you can harness chaos to build resilient systems by requesting a demo of Gremlin.
.svg)