


Dynatrace Health Check
Supported platforms:
Adding a Dynatrace Health Check requires knowing your Dynatrace instance ID. If your Health Check monitors a Kubernetes resource (such as a deployment), you can simply select the resource to monitor from a list. For other resources (such as a host), you will need its entity ID.
Authenticating with Dynatrace
Before creating the Health Check, you'll need to authenticate your Gremlin account with Dynatrace. This is a one-time step per Gremlin team. Once the authentication is saved, it becomes available to your entire Gremlin team. If you or someone else in your Gremlin team has already authenticated with Dynatrace, you can skip this section and go directly to Creating a Dynatrace Health Check.
- Navigate to your Dynatrace instance in a web browser. The start of the URL will look similar to this: https://gml12345.live.dynatrace.com/. Keep this instance ID handy for later reference.
- In the Gremlin web app, select Configurations > Health Checks.
- Select the Authentication tab. If your Dynatrace instance isn’t already listed, click + Authentication.
- Select Dynatrace from the Observability Tool list. If Dynatrace isn’t available to select, then you are already authenticated.
- Enter the Base URL for the Dynatrace API. This is the URL you retrieved in step 1 (e.g., https://gml12345.live.dynatrace.com/).
- If your Dynatrace instance is on-premises, select Yes for Is this observability tool behind a firewall or on-prem. You will be prompted to install the Gremlin Private Network Integration (PNI) agent. If you’re using Dynatrace SaaS, you can ignore this field.
- In the Dynatrace web app, copy or create an API key. This key will require the following permissions:
- Ingest Events: Allows Gremlin to send experiment and status events into Dynatrace.
- Read Events: Allows Gremlin to query existing event data.
- Read Entities: Required for resolving monitored hosts, services, and other Dynatrace entities.
- Read Problems: Required if Health Check or failure validation depends on Dynatrace Problem data.
- Back in the Gremlin web app, paste the API key into the Authorization box.
- Click Save.
Authenticating using AWS Secrets Manager
When using AWS Secrets Manager with Health Checks, your secret should contain the following key-value pairs:
Creating a Dynatrace Health Check
The fastest way to create a Dynatrace Health Check is to add a dynatrace-entity-id tag to your service with its corresponding Dynatrace entity ID as the value. After you authenticate with Dynatrace, Gremlin automatically looks up the entity ID in Dynatrace and creates a Health Check if it finds it (you’ll be prompted to add the Health Check via a banner).
For example, the screenshot below associates this service with an entity ID of “host-1234”:

If you don’t know your service’s entity ID, or want to create a Dynatrace Health Check manually:
- In the Gremlin web app, select Configurations > Health Checks.
- Under the Health Checks tab, click + Health Check.
- Select Dynatrace in the Observability Tool drop-down (if you don’t see it, go to Authenticating with Dynatrace), then click Next.
The following steps vary depending on whether the service you’re monitoring is Kubernetes-based.
Kubernetes-based Health Checks
If you’re using Kubernetes, Gremlin provides a way to search for and select the corresponding resource in Dynatrace without having to open Dynatrace.
- Click Select Kubernetes Object to look up in Dynatrace if it isn’t already selected.
- Use the menu and/or search box to select the Kubernetes resource you want to monitor. You can only select one resource. If you left the Health Check name blank, Gremlin will use the resource name as the Health Check name.
- Click Test Health Check to validate that Gremlin can access the Dynatrace entity.
Non-Kubernetes Health Checks
For other target types, you must provide a Dynatrace Entity ID.
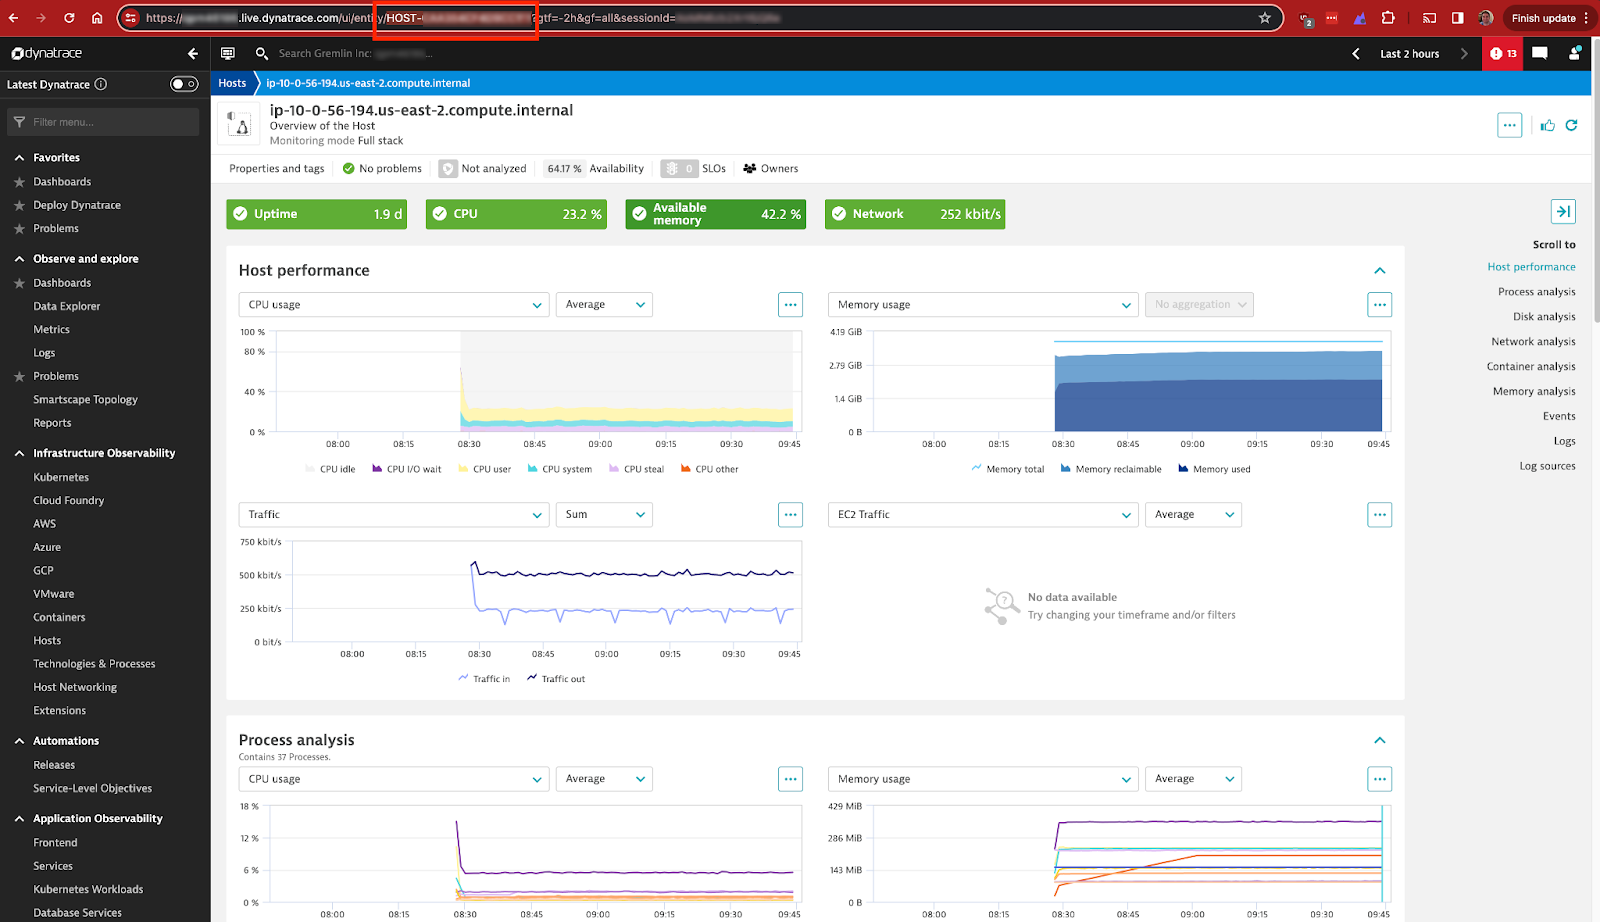
- In the Dynatrace web app, navigate to the entity you want to monitor. For example, if your target is a host, click on the Hosts link in the sidebar, then click on the name of the host you want to monitor.
- Once the entity details screen has loaded, copy the relevant entity ID from your browser’s URL bar. In the screenshot below, the entity ID is highlighted in red.
- Paste the Entity ID into the Entity ID field in Gremlin.
- Click Test Health Check to validate that Gremlin can access the Dynatrace entity.
How Dynatrace Health Checks work
Excluding the legacy integration, Gremlin uses Dynatrace’s Events API as the basis for Dynatrace Health Checks. Specifically, Gremlin monitors one of several event categories depending on your selection for the Category box. The exact data, metrics, and thresholds used by these categories are managed by Dynatrace, not Gremlin. Because of this, we recommend reviewing the first few runs of your test suite to make sure you are not receiving any false positives.To learn more about the Events API and categories, see the following links:
Legacy Dynatrace integration
The Problems URL option is available for users who want to use the previous method of adding a Dynatrace Health Check. This method uses the Problems API. This method is still available, but we recommend using one of the other methods.
- In the Dynatrace web app, navigate to the entity you want to monitor. For example, if your target is a host, click on the Hosts link in the sidebar, then click on the name of the host you want to monitor.
- Once the entity details screen has loaded, copy the relevant entity ID from your browser’s URL bar.
- Start creating your Dynatrace Health Check in Gremlin by following the instructions in Creating a Dynatrace Health Check. In the Problems URL field, enter the following URL, replacing
INSTANCE_IDwith your Dynatrace instance ID, andENTITY_IDwith your Dynatrace entity ID:https://ENTITY_ID.live.dynatrace.com/api/v2/problems?problemSelector=status("open")&entitySelector=entityId("INSTANCE_ID") - Click Test Health Check.
Set your polling interval (how often Gremlin runs the Health Check during testing), select a category, and click Create Health Check.