Halting Gremlin Attacks Using the Datadog Webhook

.svg)
.svg)

 This is an older tutorial
Gremlin is a simple, safe and secure service for performing Chaos Engineering experiments through a SaaS-based platform. Datadog is a popular SaaS cloud monitoring tool that integrates with Gremlin.
Prerequisites
Overview
This tutorial will show you how to set up Gremlin and Datadog on a host, and how to set up Gremlin’s Datadog webhook so you can halt Gremlin attacks automatically from Datadog when alerts fire.
- Step 1 - Install the Gremlin agent
- Step 2 - Install the Datadog agent
- Step 3 - Create a Metrics monitor in Datadog
- Step 4 - Set up the Datadog/Gremlin integration
- Step 5 - Run a CPU attack in Gremlin
- Step 6 - Set up the Datadog webhook
Step 1 - Installing the Gremlin Agent
Install the Gremlin agent on the Ubuntu host using Step 1 of our Ubuntu 18.04 tutorial.
Step 2 - Installing the Datadog Agent
When you sign up for a Datadog account, their signup process will prompt you to install your first agent. The Datadog UI will show you the command during their signup workflow with the full API key included. You can just copy/paste it to the terminal on your Ubuntu host. Datadog has a one step install command for Ubuntu. You can run it like below, replacing <span class="code-class-custom">YOUR_API_KEY</span> in the command with your Datadog API key.
If you already have a Datadog account, you can find your API key by hovering over Integrations in the left navigation bar, selecting API, and clicking on API Keys on the next screen:
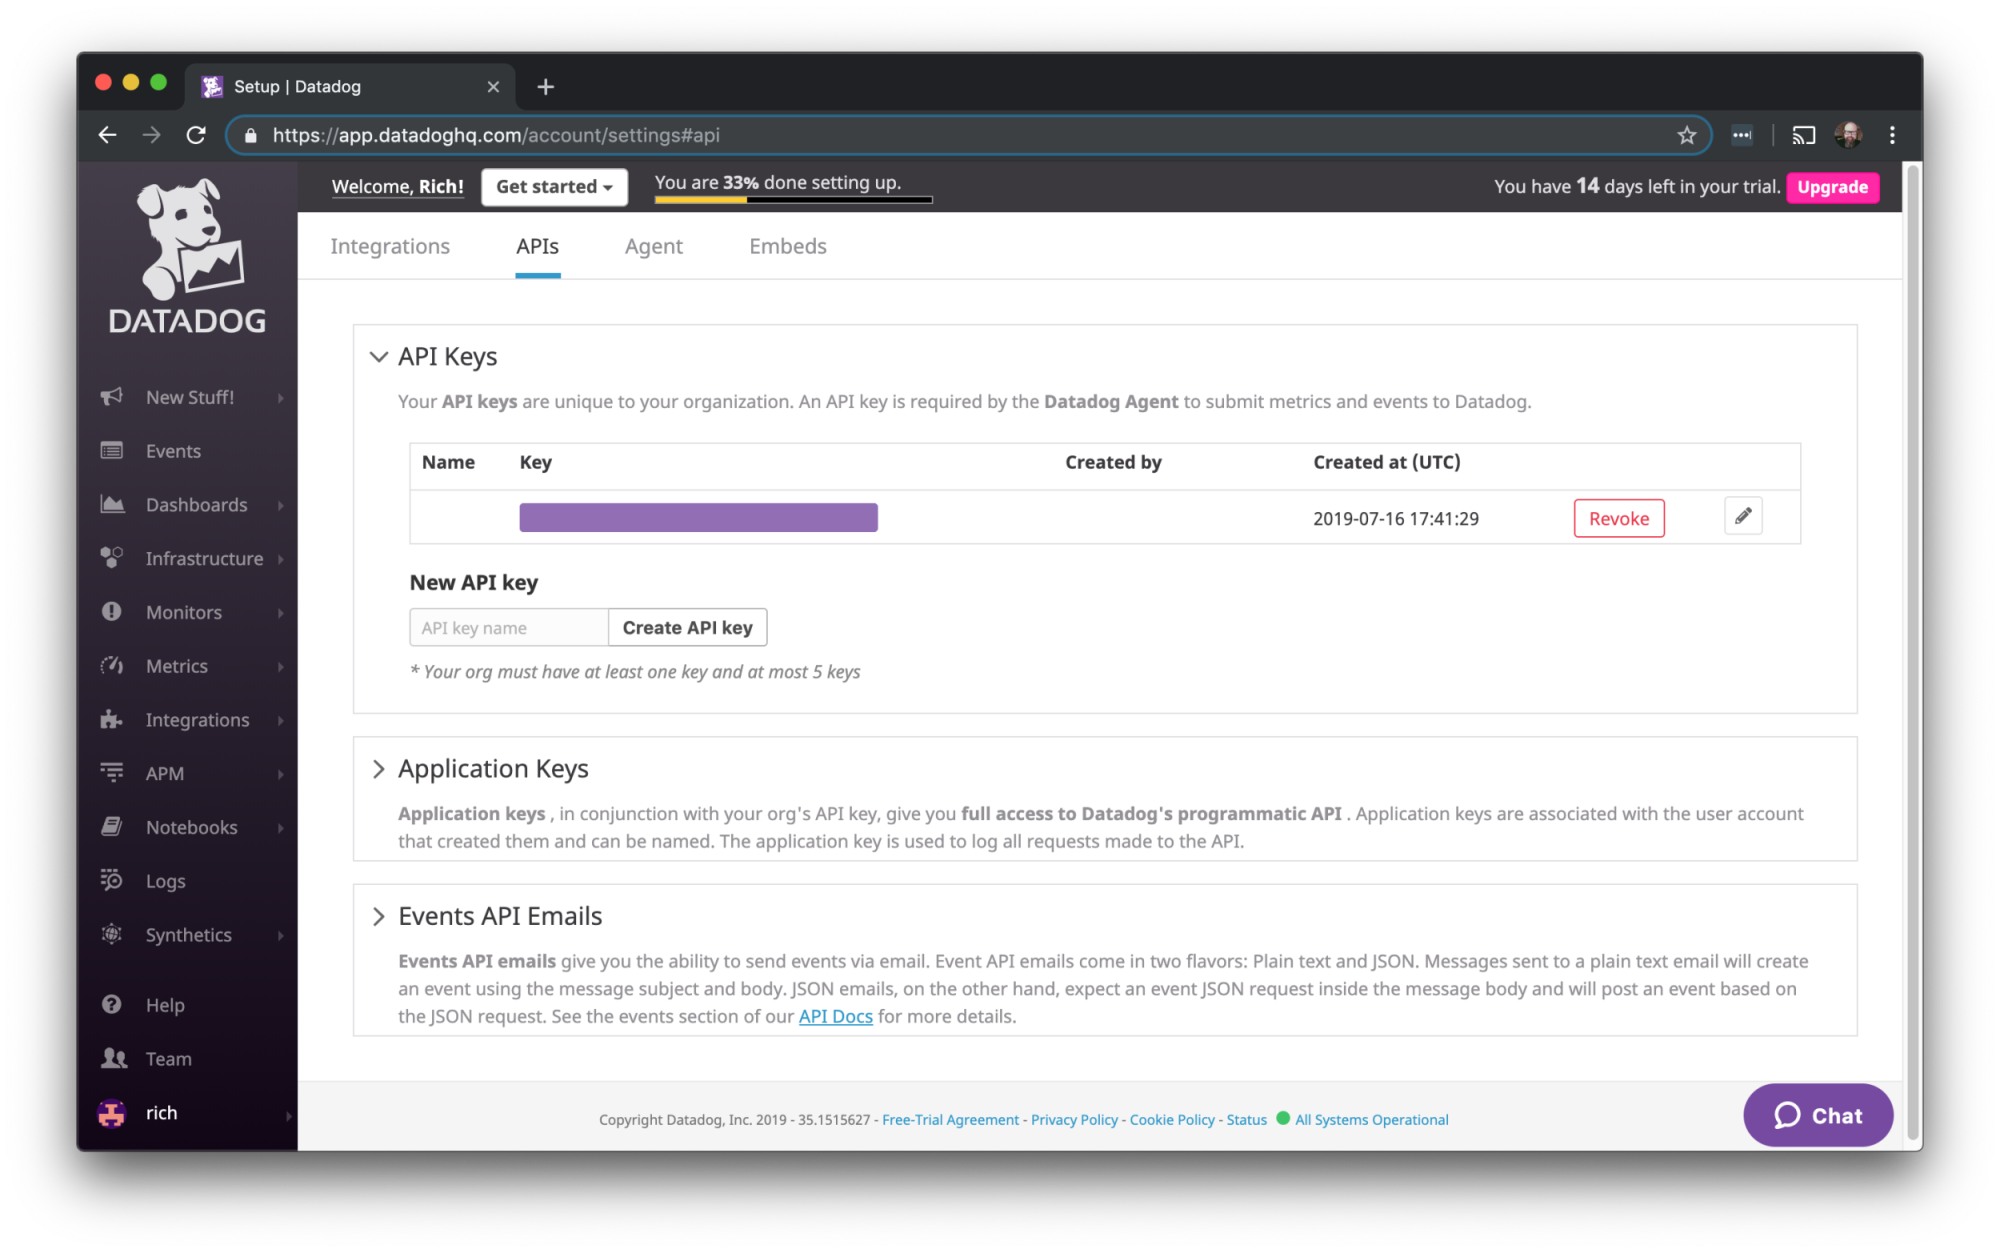
Hover your mouse over that purple block under Key, and it will reveal the API key. Then you can copy/paste it to the install command.
Step 3 - Create a Metrics monitor in Datadog
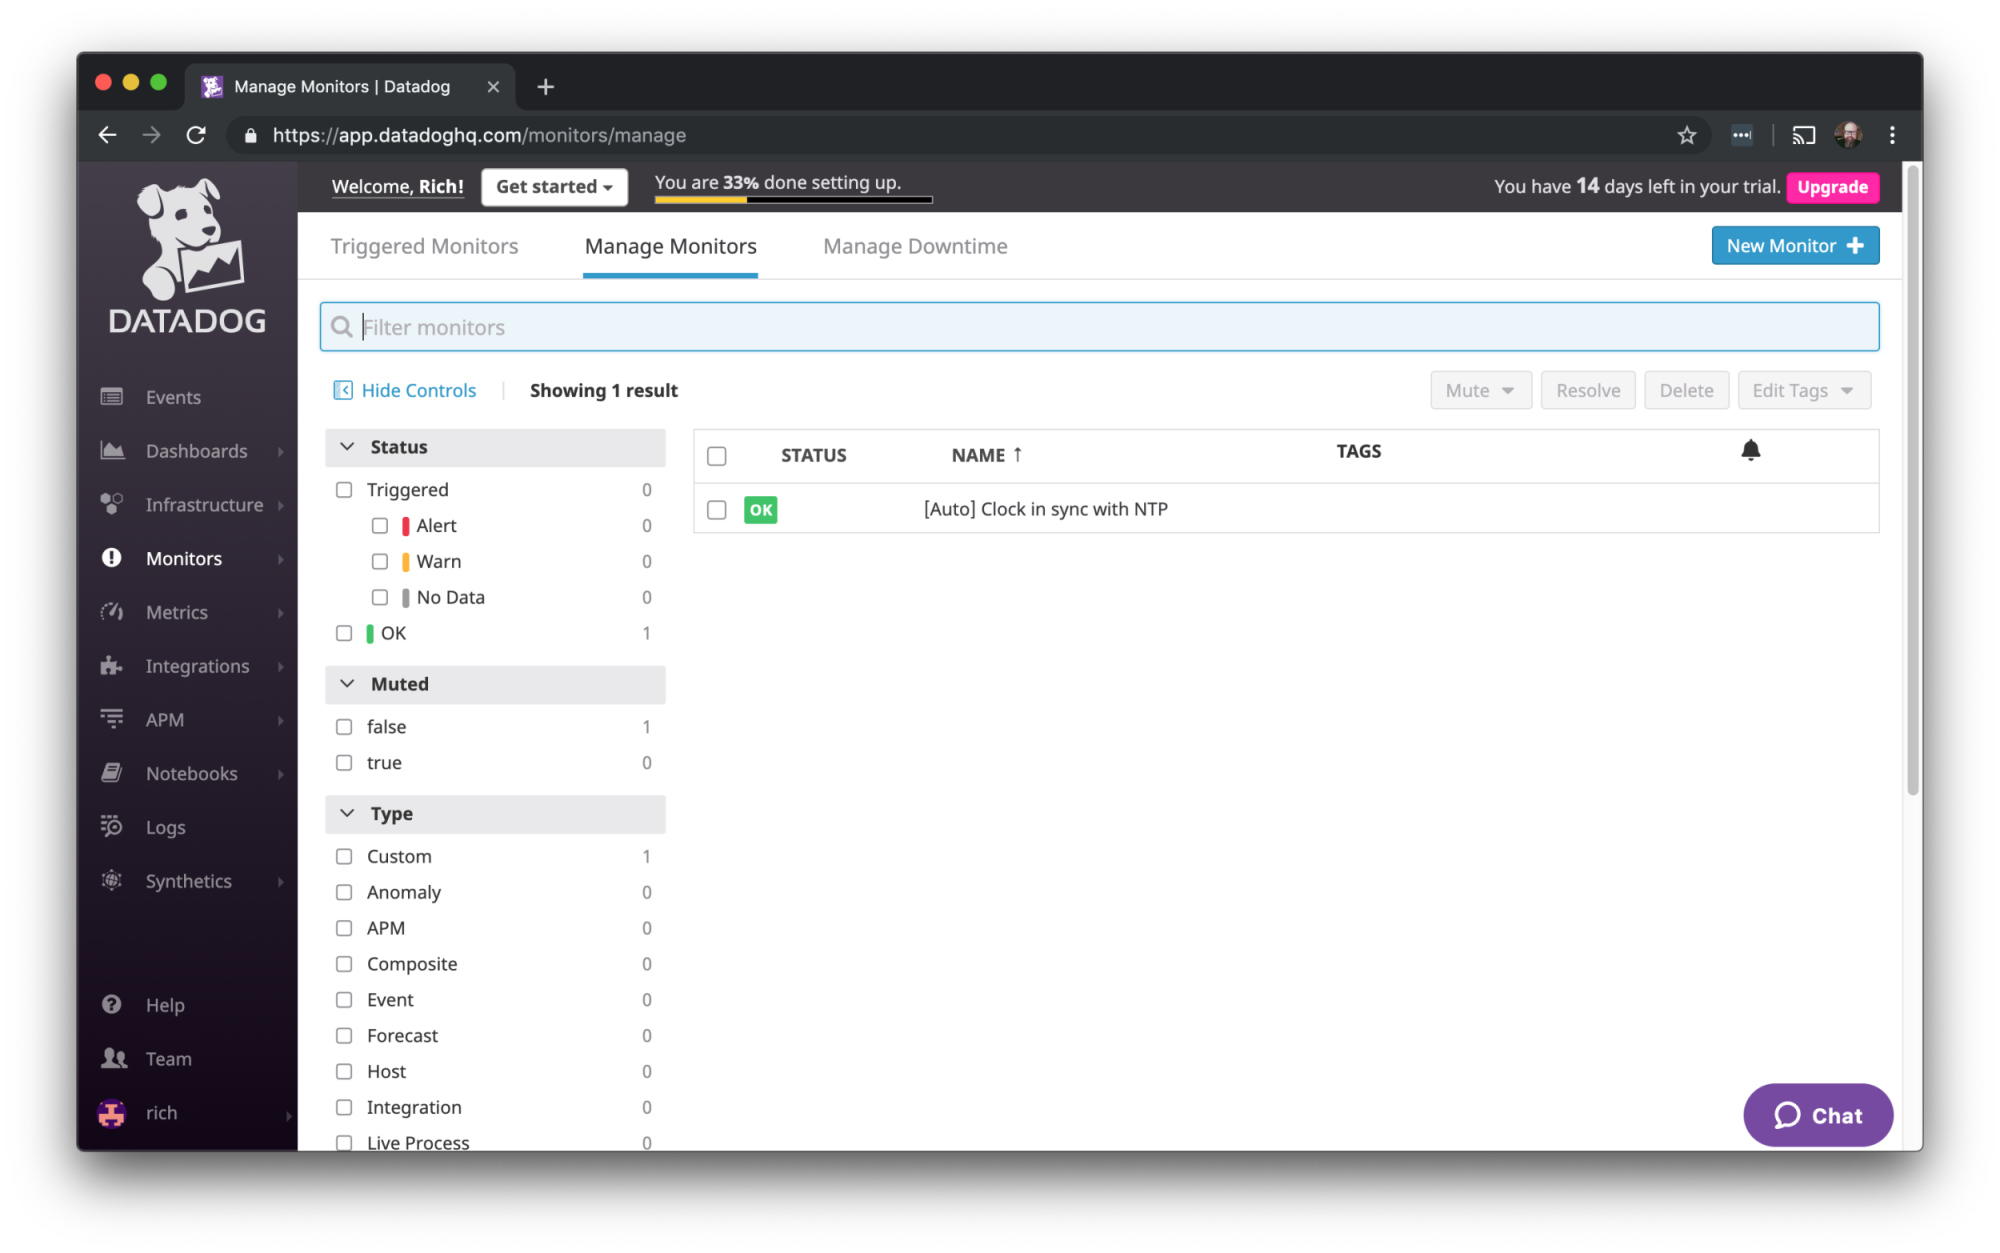
Click on Monitors in the left navigation bar, and then Manage Monitors. If your Datadog account is new you should just have one monitor defined:
Click New Monitor in the upper right of the screen. Under “Select a monitor type” click Metric.
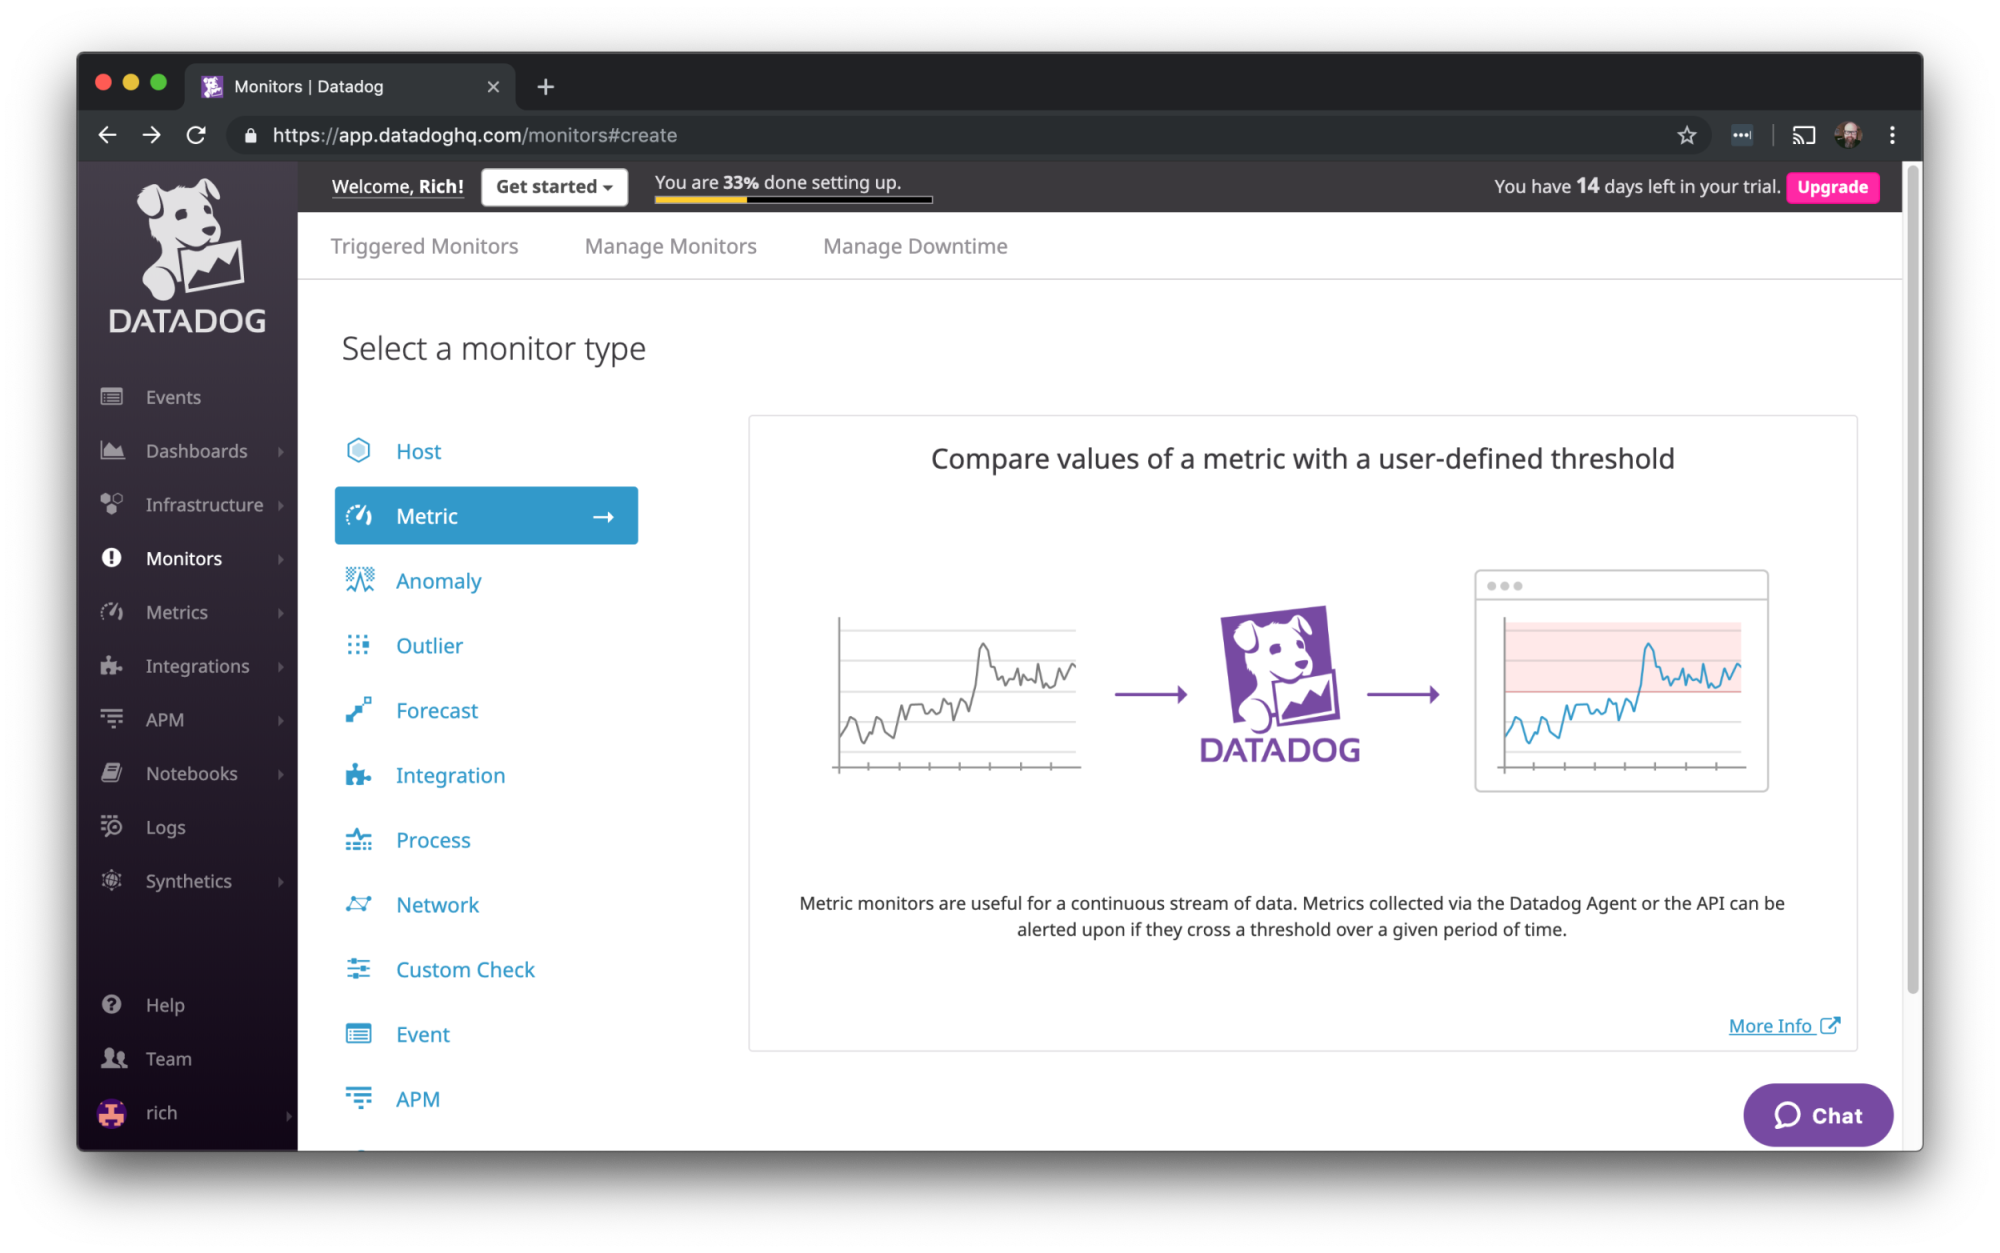
On the next screen we’ll define the metric we want to monitor.
Leave the detection method set to threshold. For the metric name, enter “cpu” and you’ll be shown all the metrics Datadog knows about that have the string cpu in their names. Select the metric named system.cpu.idle.
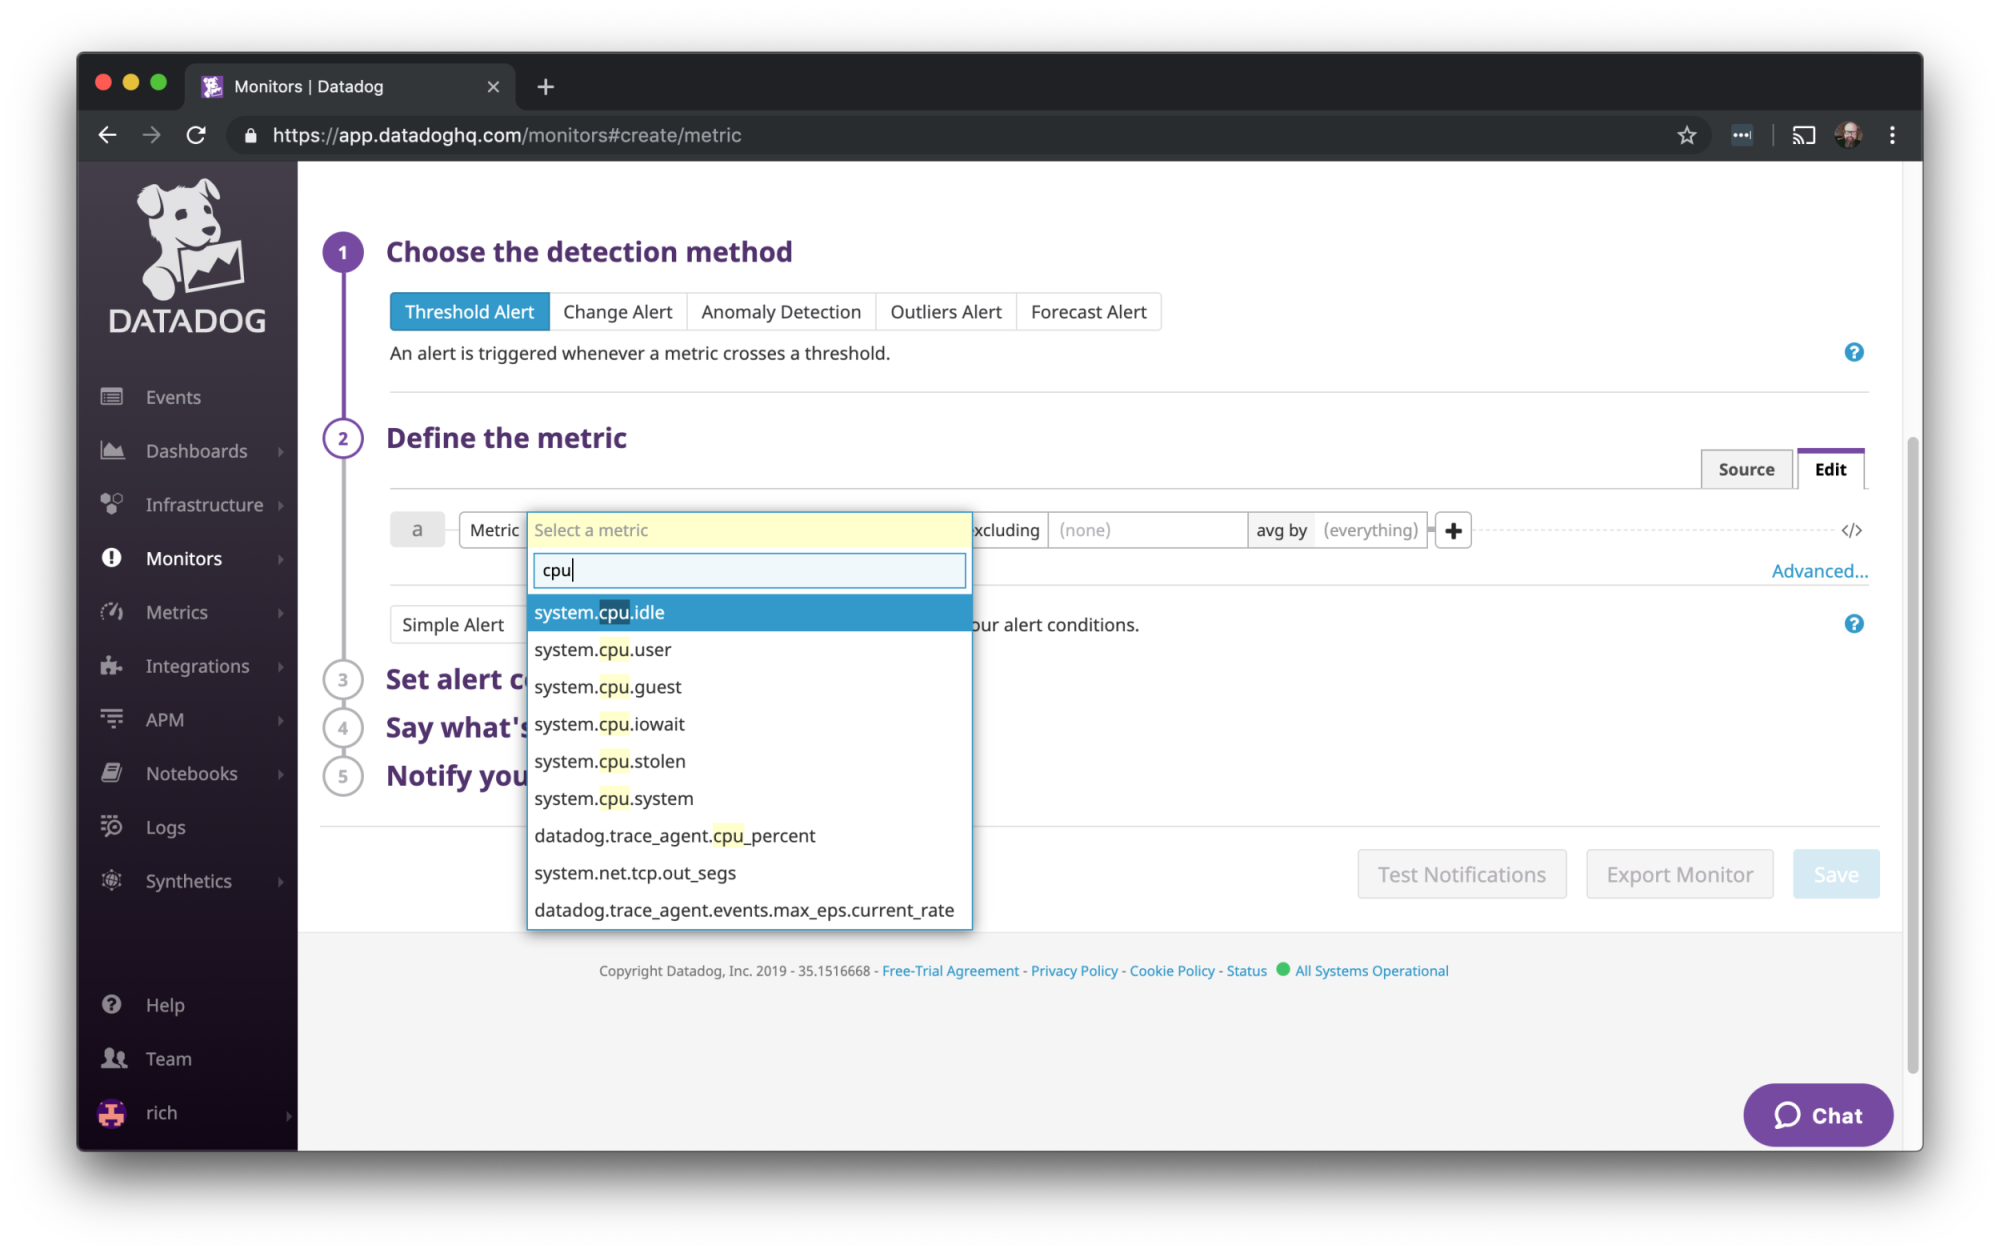
In the “from” box, select your Ubuntu host’s hostname. Leave the alert type set to Simple Alert.
Then click on “Set alert conditions” to expand those settings. We’re going to set an alert that will trigger when the idle CPU is at or below 40 percent. Datadog has you construct a sentence in their UI that describes the alert, using pulldown menus they provide. We’re going to change the first box to “below or equal to,” the second to “at least once,” and the third to “5 minutes.” The final sentence should read: “Trigger when the metric is below or equal to the threshold at least once during the last 5 minutes.”
On the next line, for Alert threshold enter “40.” Leave the other settings at their defaults. It should look like this:
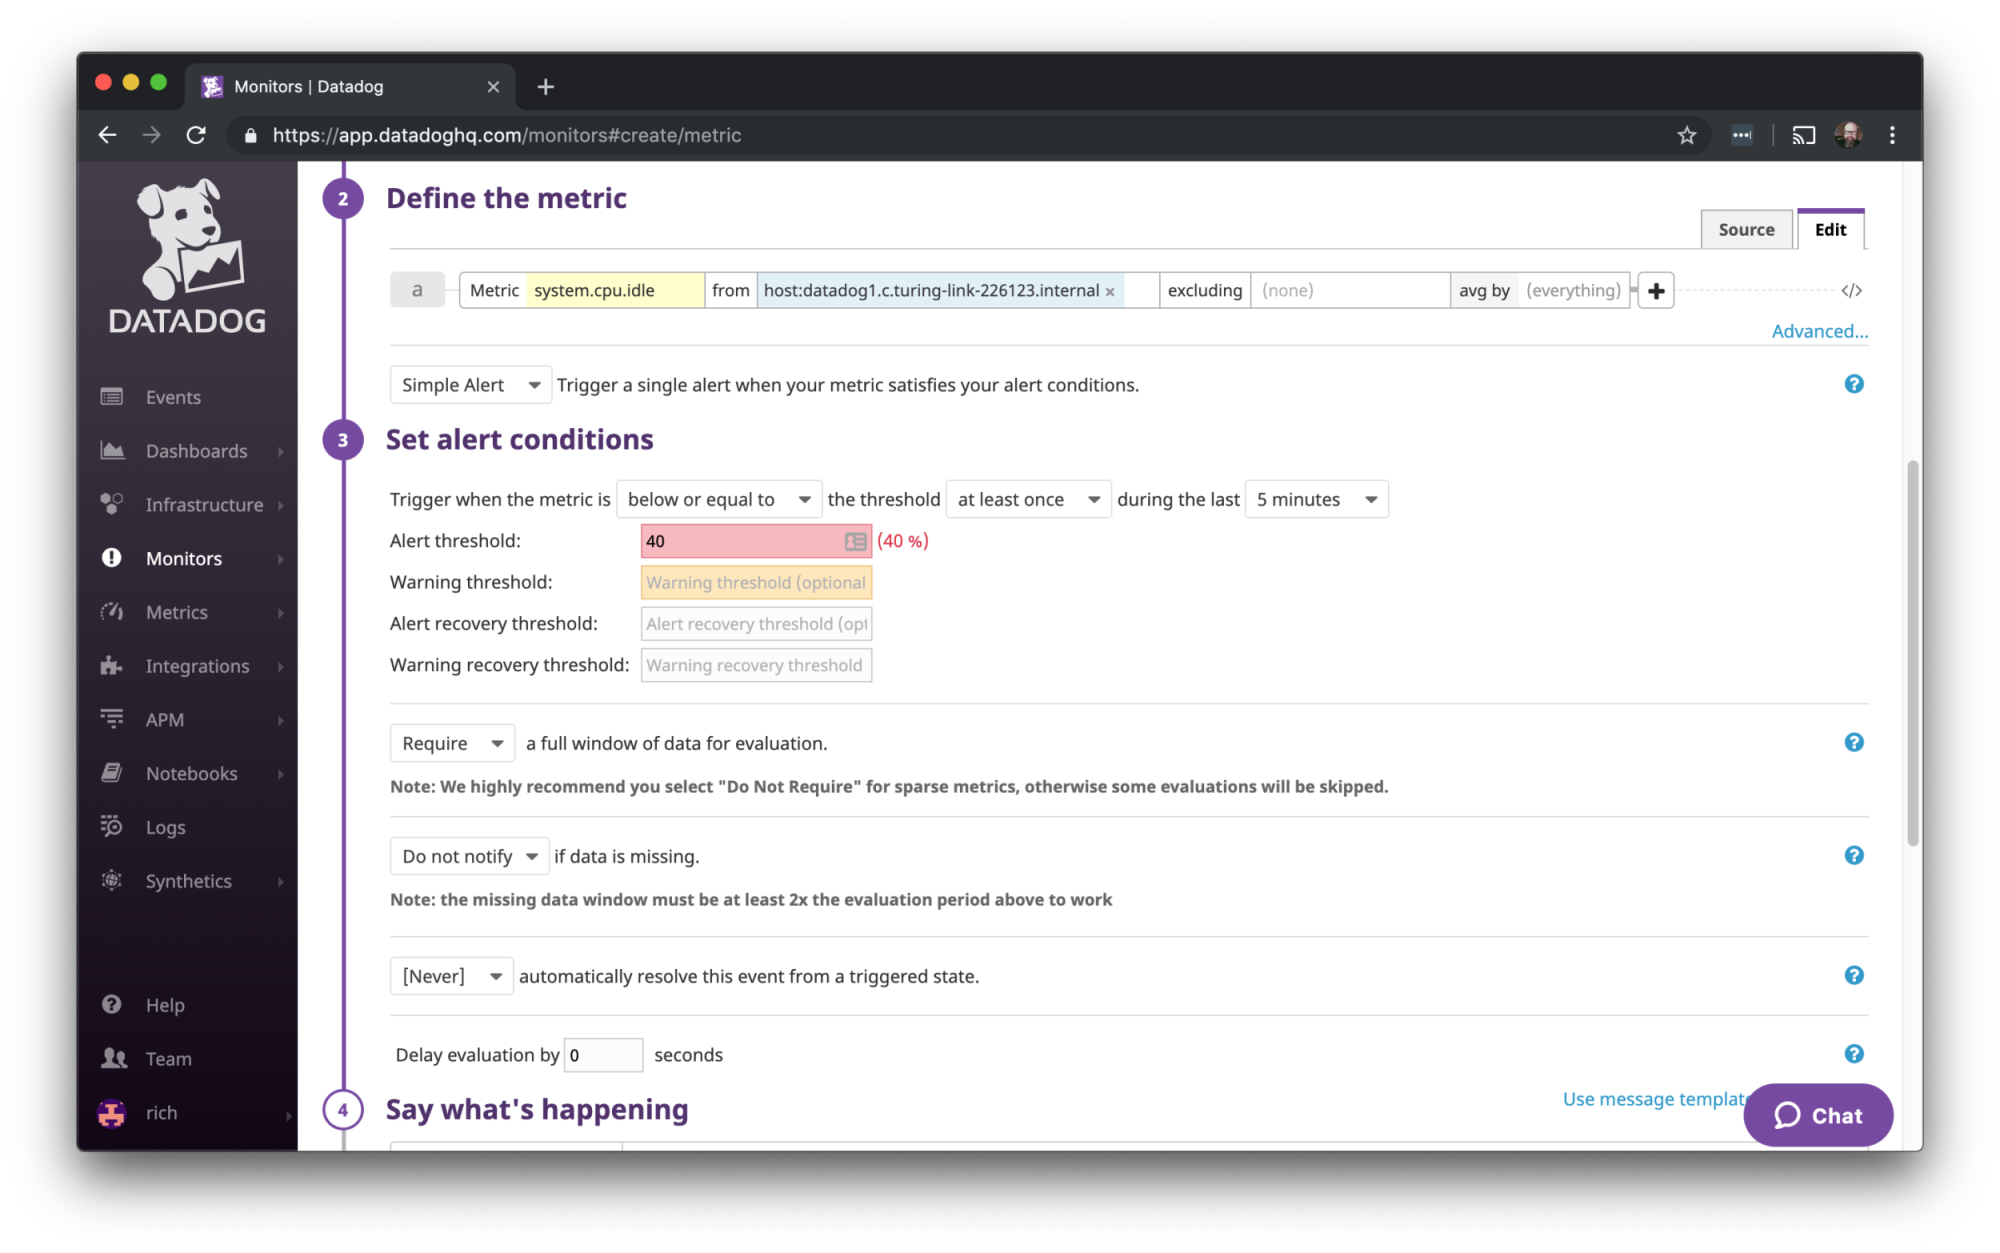
Note that we are not recommending you configure actual CPU alerts in production with these settings. We’re doing this to easily demonstrate the Datadog/Gremlin integration.
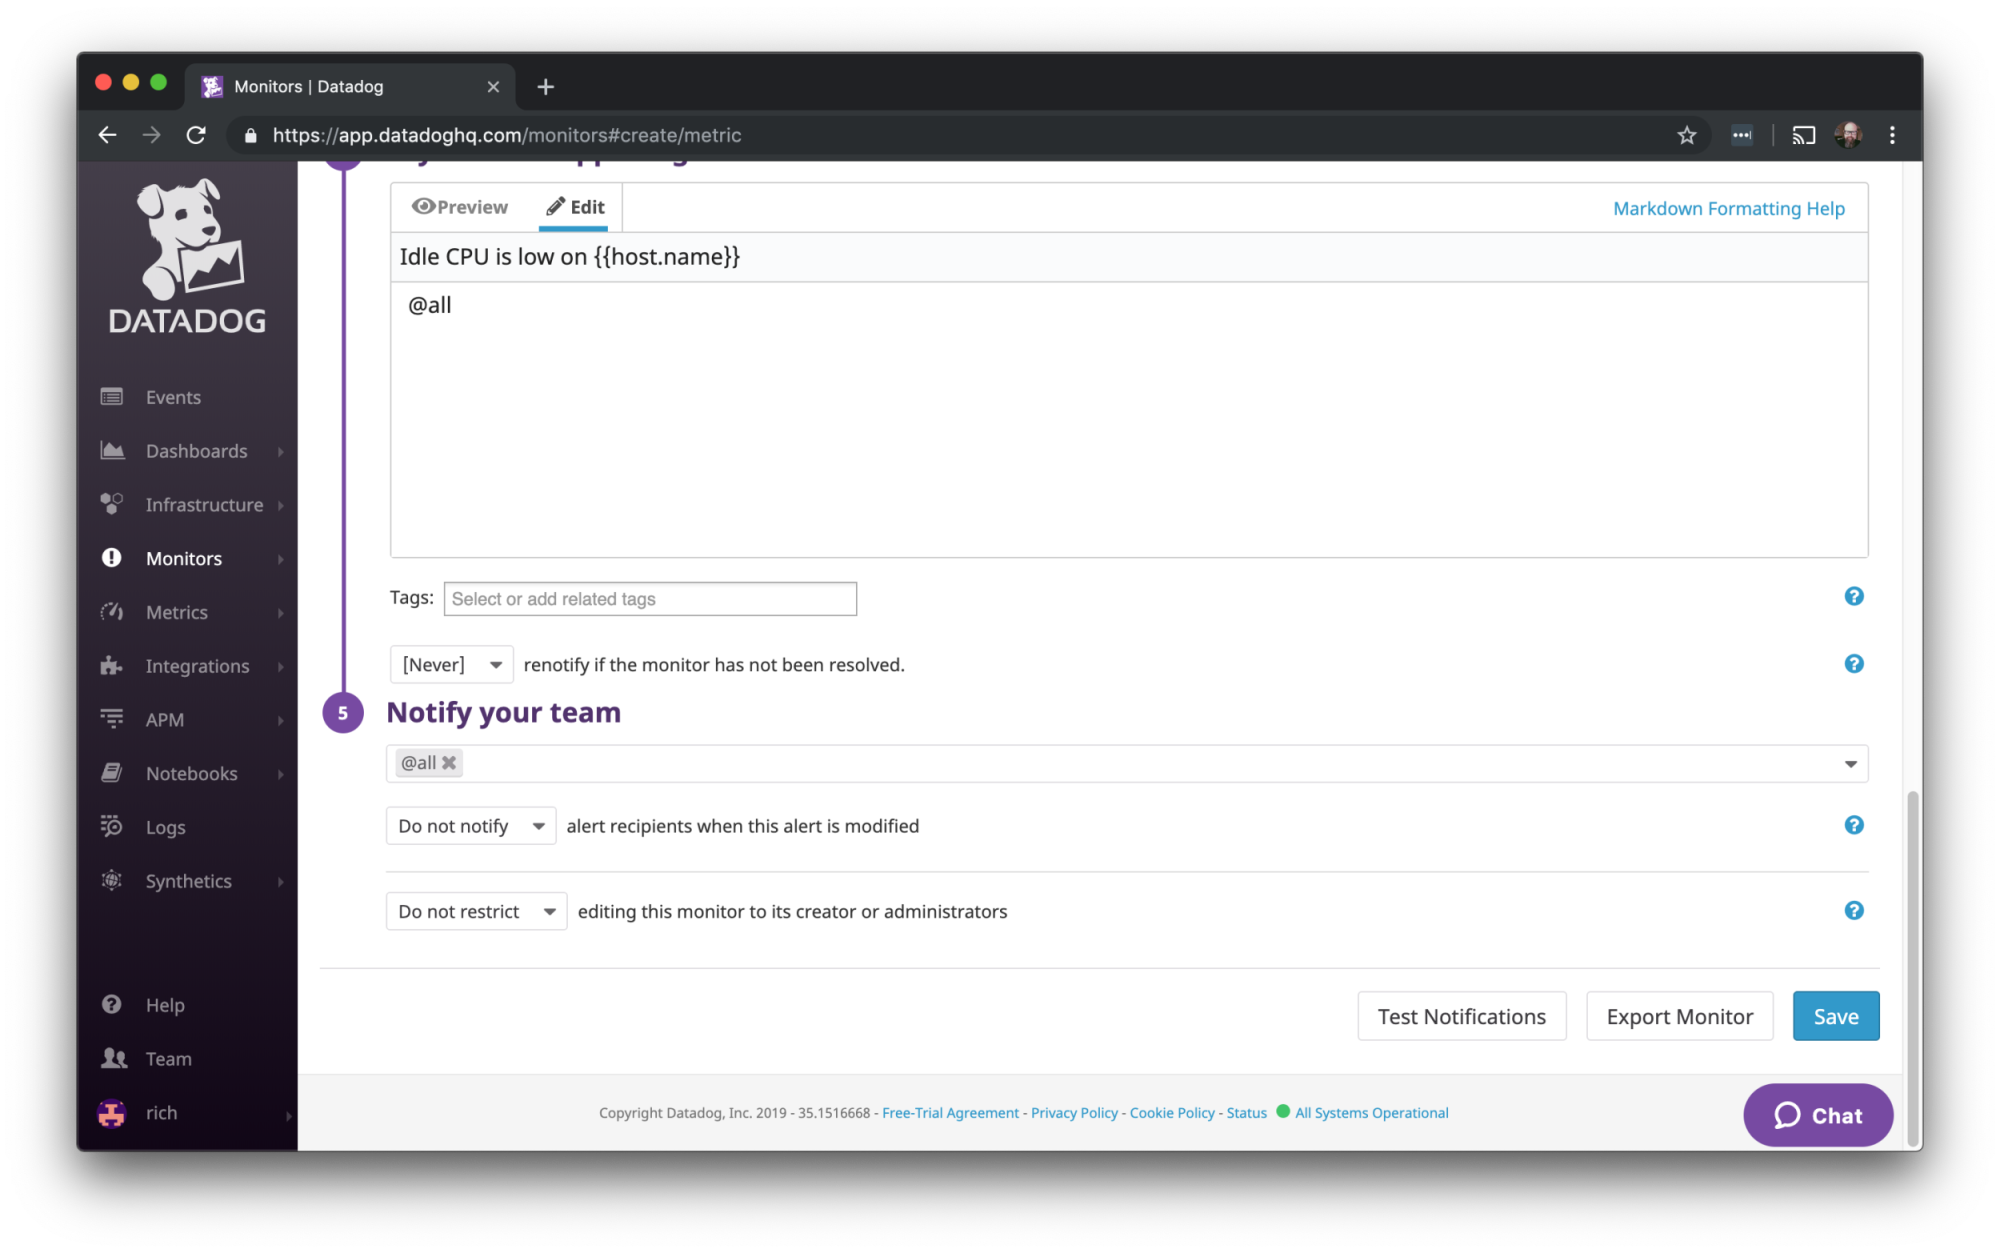
Next, scroll down to the “Say what’s happening” section. For the Monitor Name, enter
Idle CPU is low on {{host.name}}
You can leave Monitor Message blank.
Scroll down to “Notify your team.” With the pulldown menu, you can choose to notify all or just your individual email. You can leave the other settings set to the default.
Click Save in the lower right corner.
Step 4 - Set up the Gremlin Datadog integration
The Gremlin Datadog integration allows you to see the events from your Gremlin experiments in Datadog. This is handy when it comes to correlating your experiments to changes in metrics.
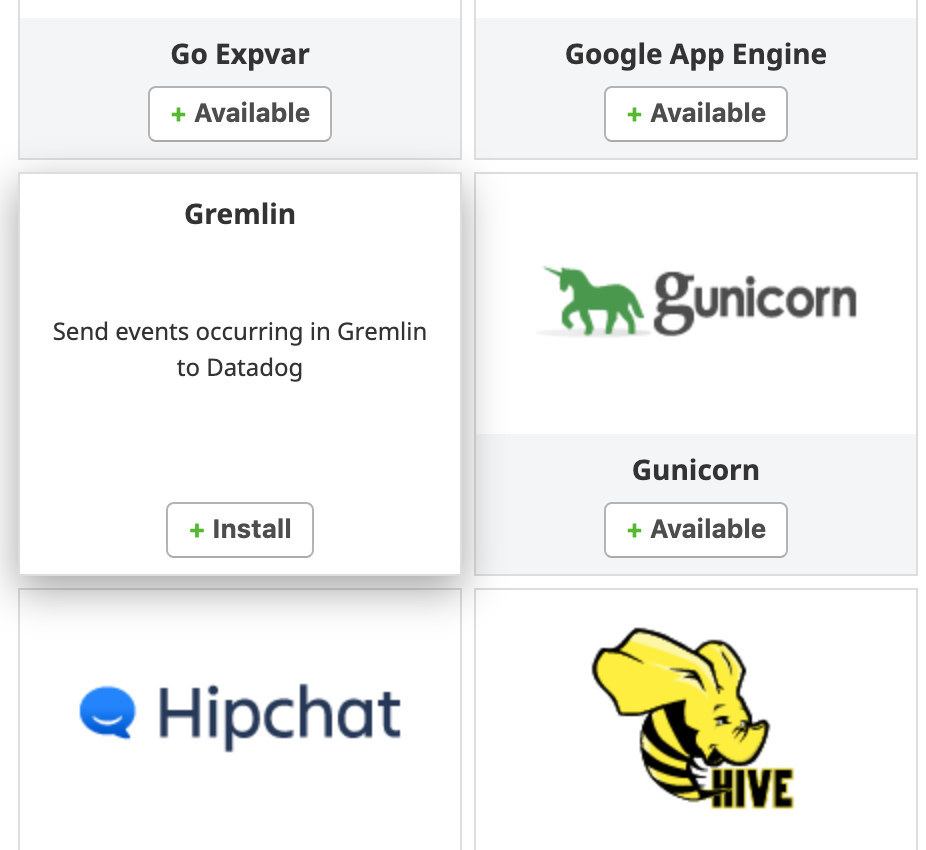
In Datadog, click Integrations in the left navigation bar. You’ll be taken to a page with a long list of services that Datadog integrates with. Find Gremlin on the list and hover your mouse over it. The Gremlin box will change to a new view with a button that says Install.
You’ll see a screen with info on how the integration works.
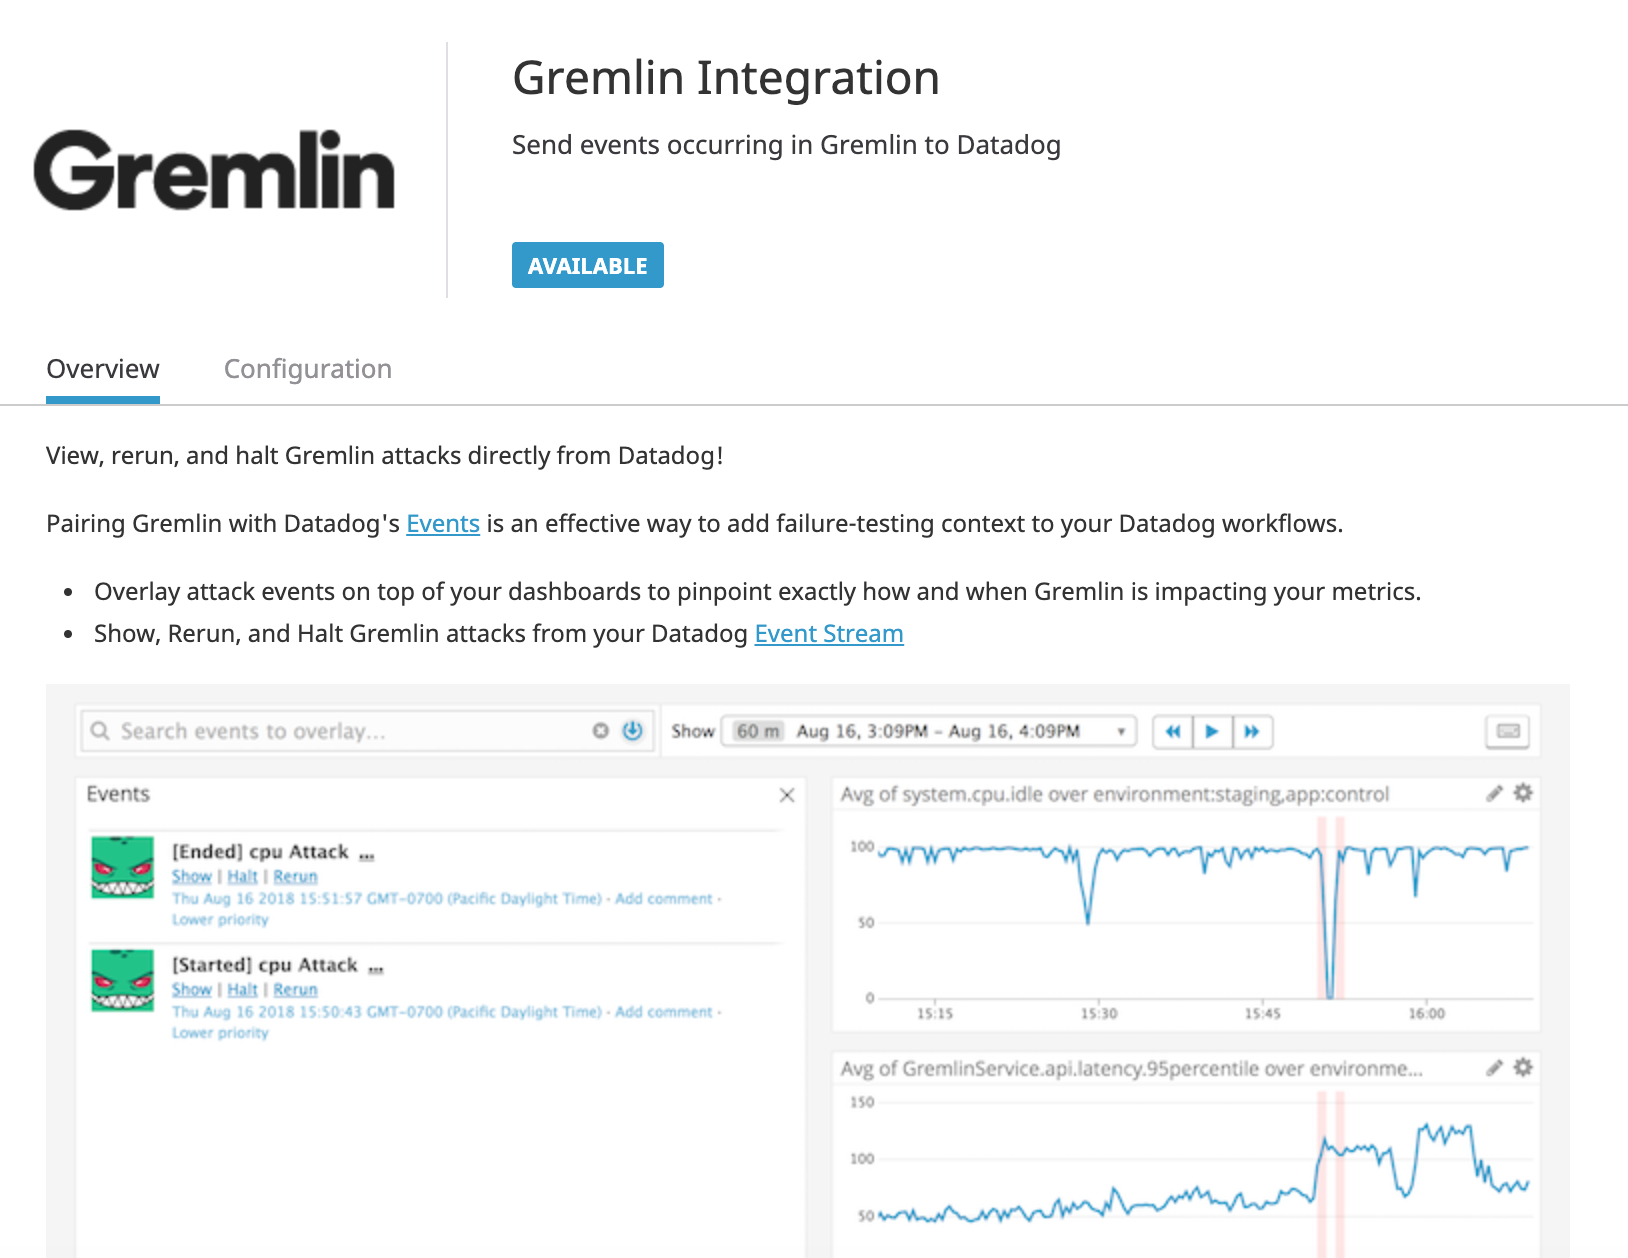
Click Configuration, and then Install Integration.

Next we need to set up the Gremlin side of the integration. This will require your API key, the same key that we used when installing the Datadog agent.
If you don’t still have that API key, you can find it by hovering over Integrations in the Datadog left navigation bar, selecting API, and clicking on API Keys on the next screen:
Hover your mouse over that purple block under Key, and it will reveal the API key.
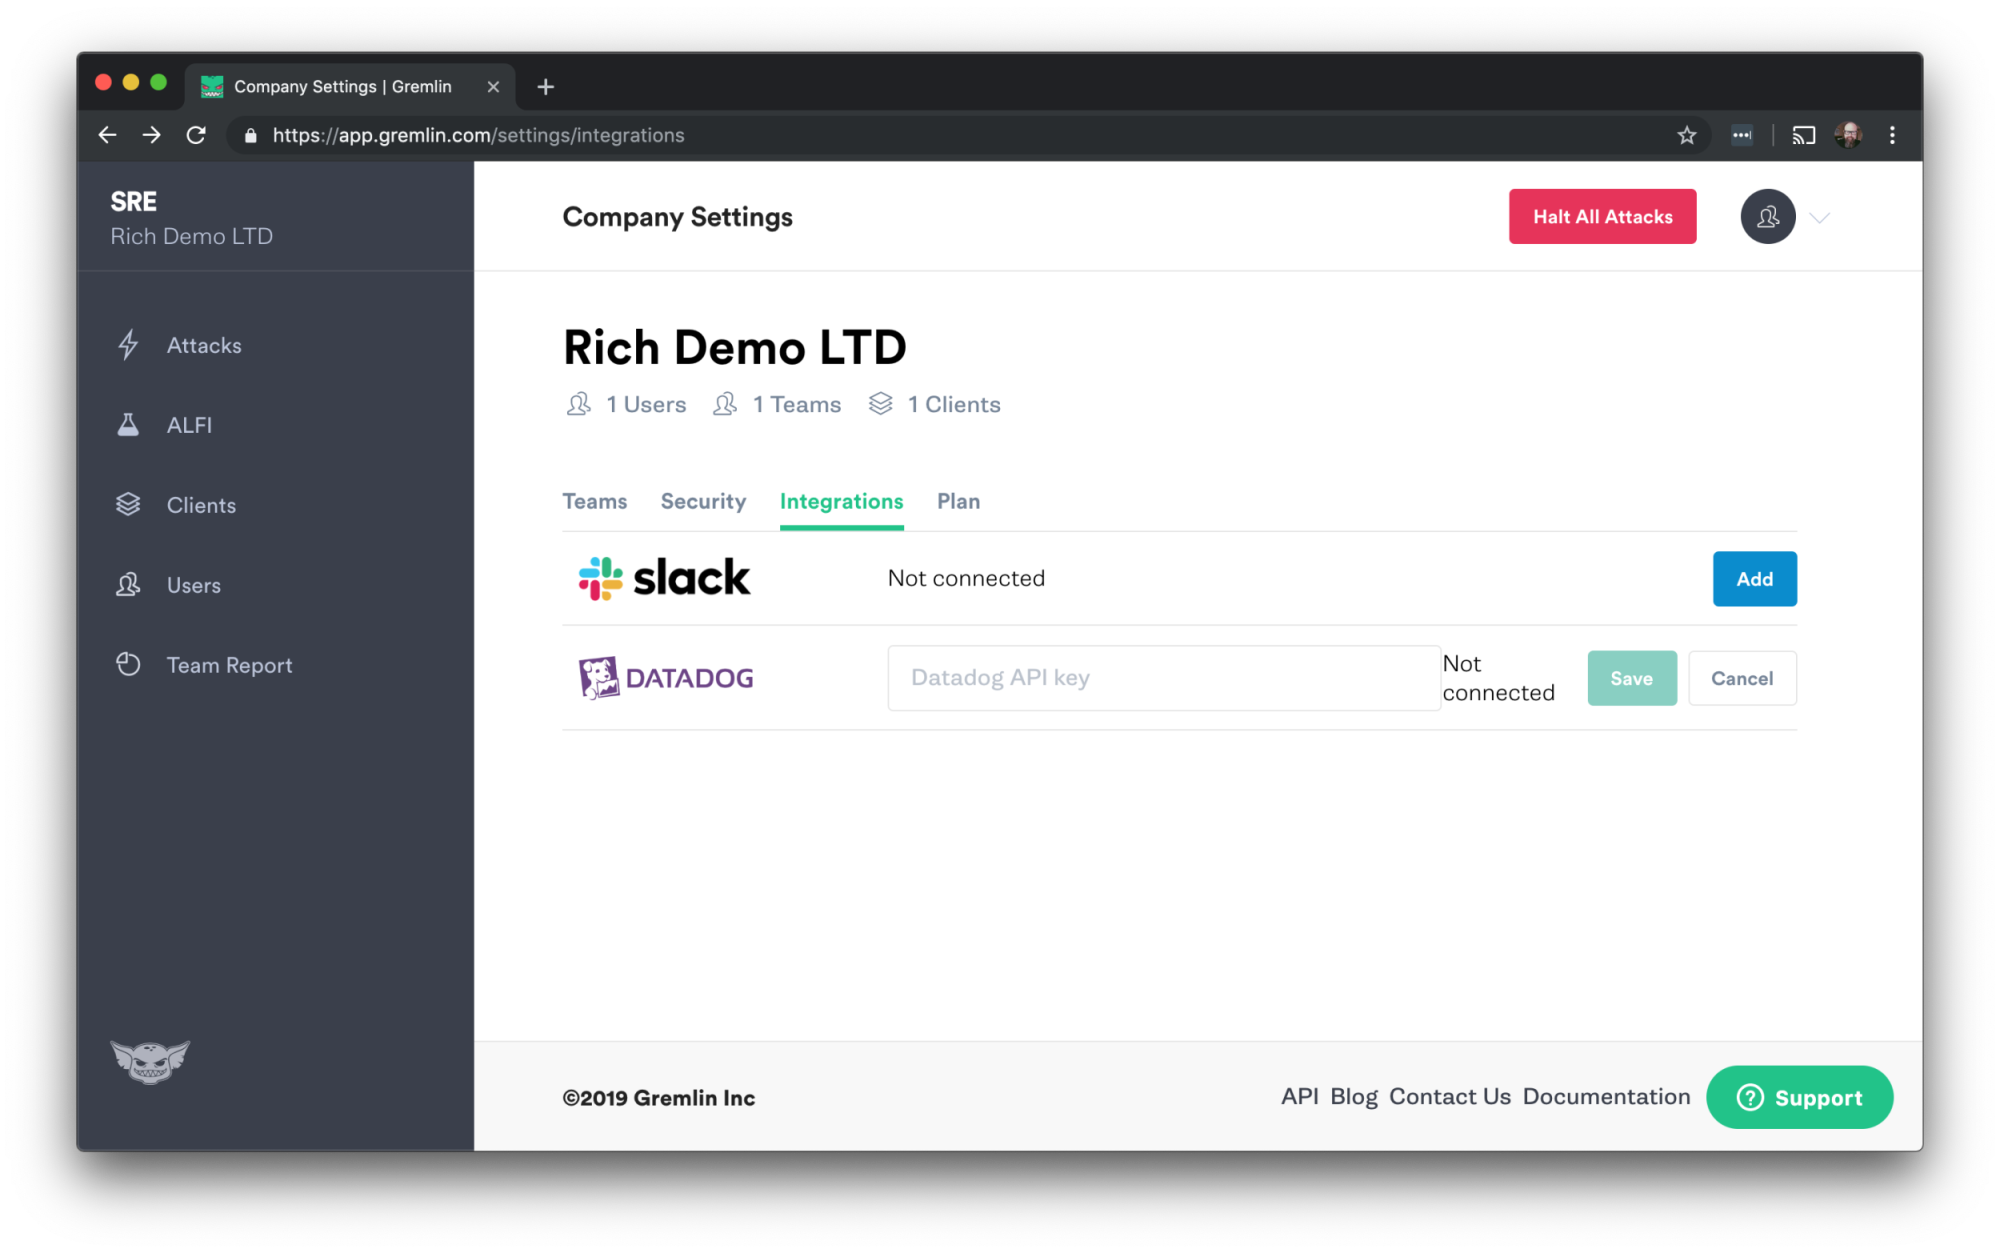
Log into Gremlin and go to Company Settings. The page will open to the Teams tab by default. Click Integrations.
Then click Add next to the Datadog integration. Paste in your Datadog API key and hit Save.
You should see a message saying “Connection added,” and then the Integrations screen will look like this:
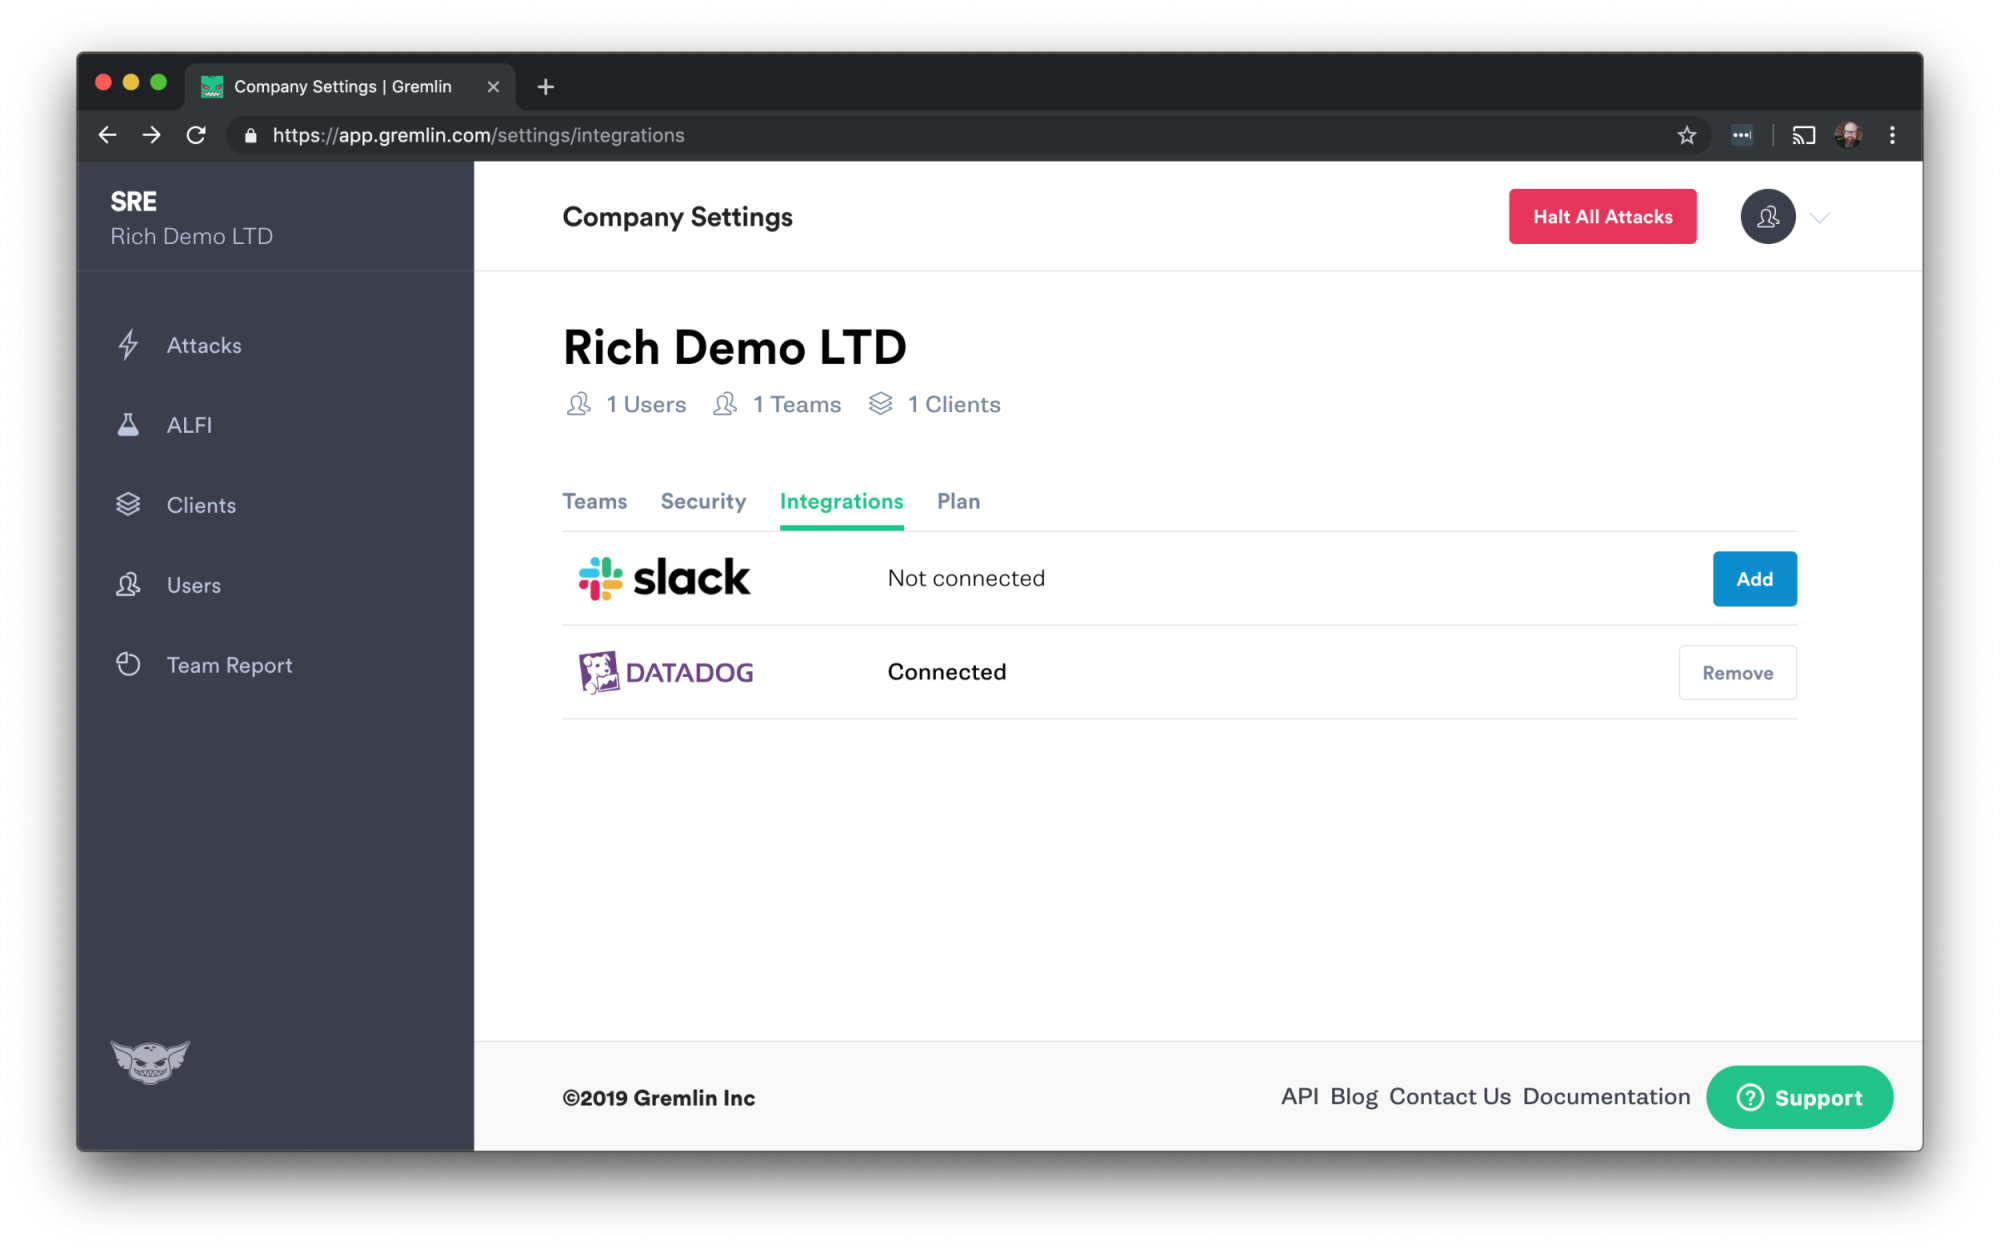
The integration is now configured, and you’ll see info about Gremlin experiments in Datadog.
Step 5 - Run a CPU attack in Gremlin
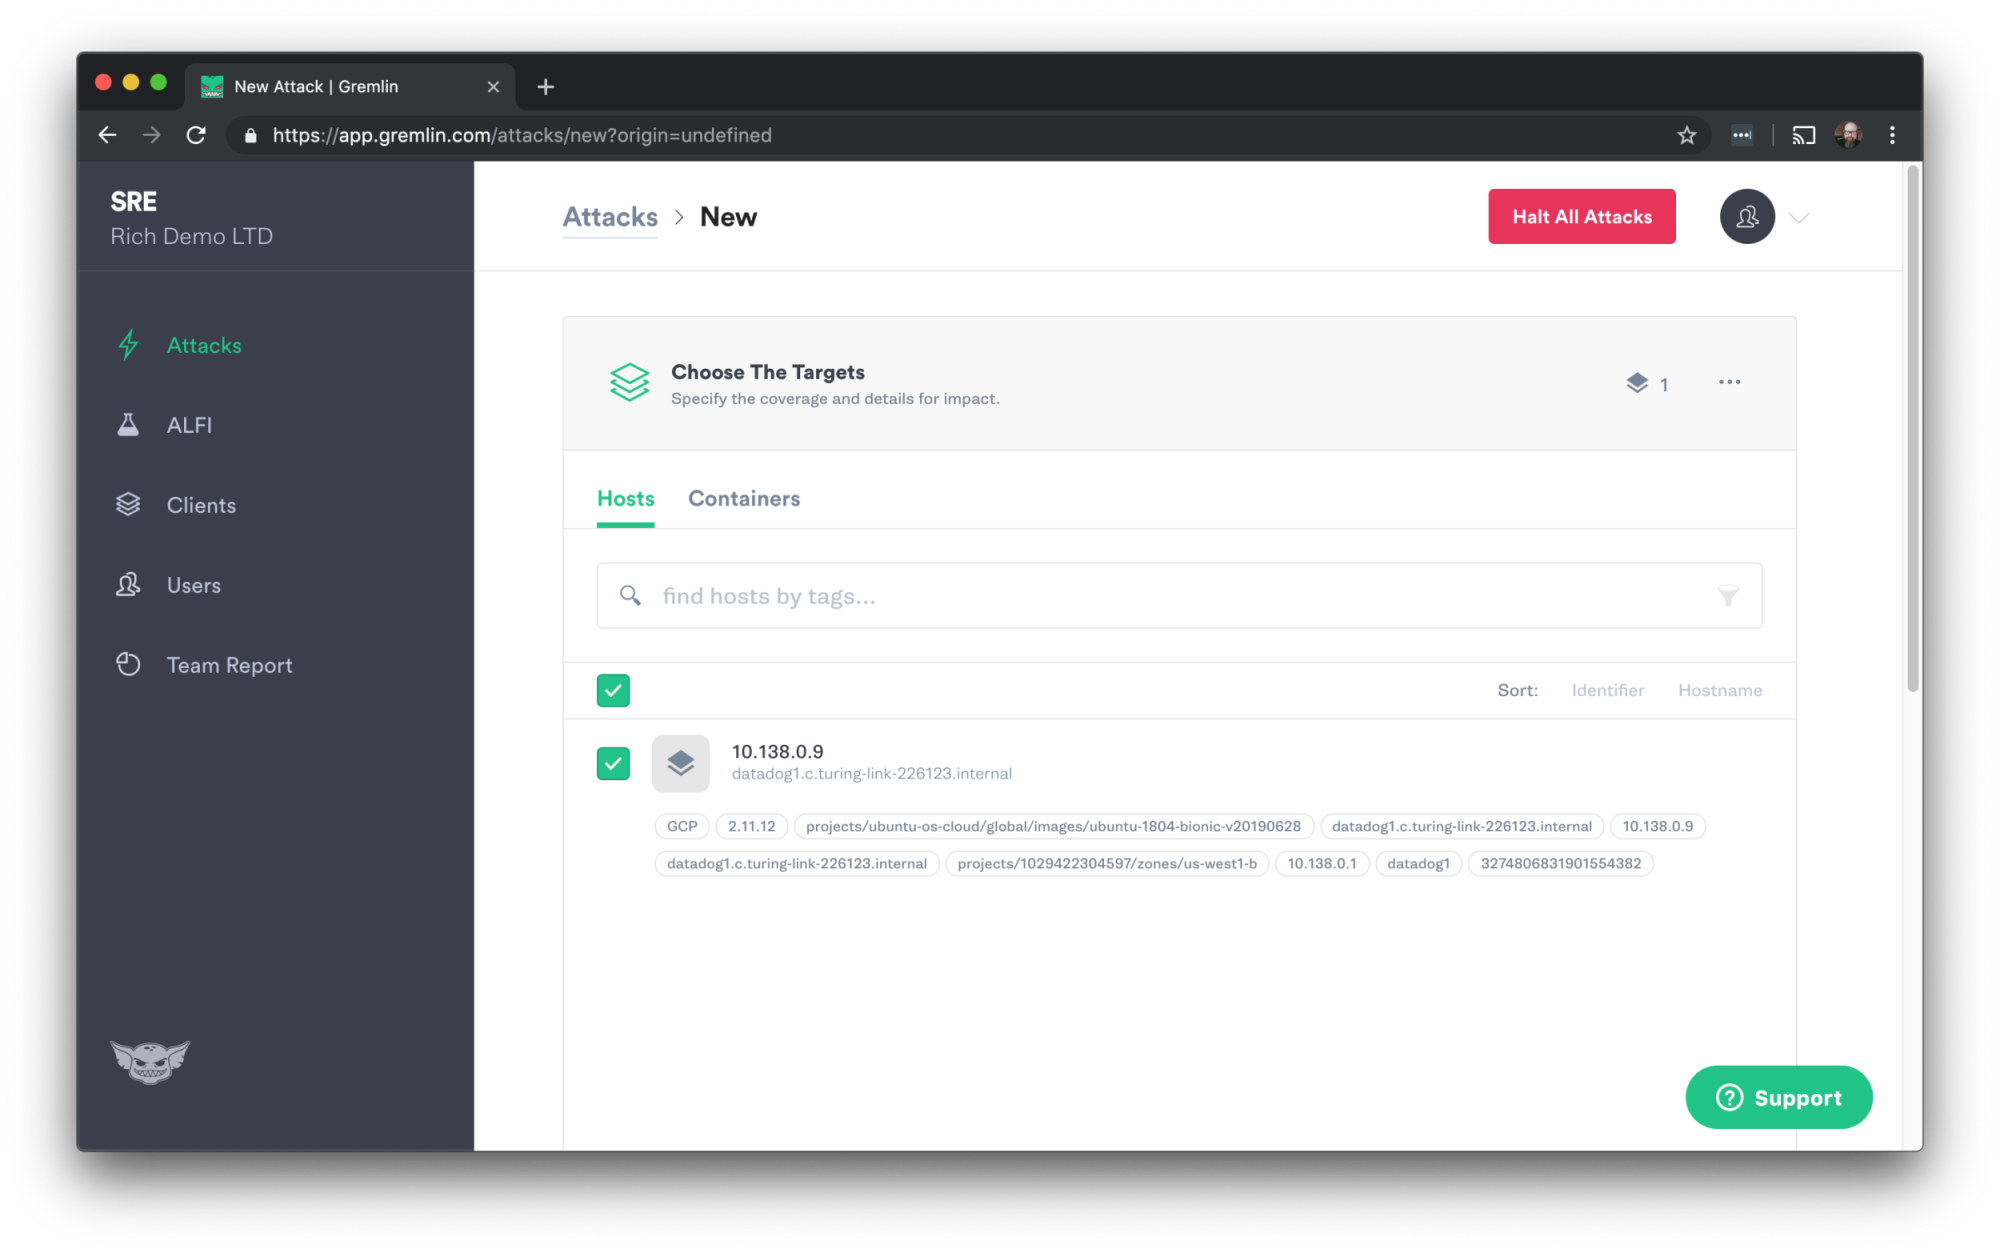
Log into Gremlin. Click Attacks in the left navigation bar, and the green New Attack button. Select the Ubuntu host as the target for the attack.
Scroll down and click “Choose a Gremlin.” The CPU attack should be selected by default. If not, click on Resource and then CPU.
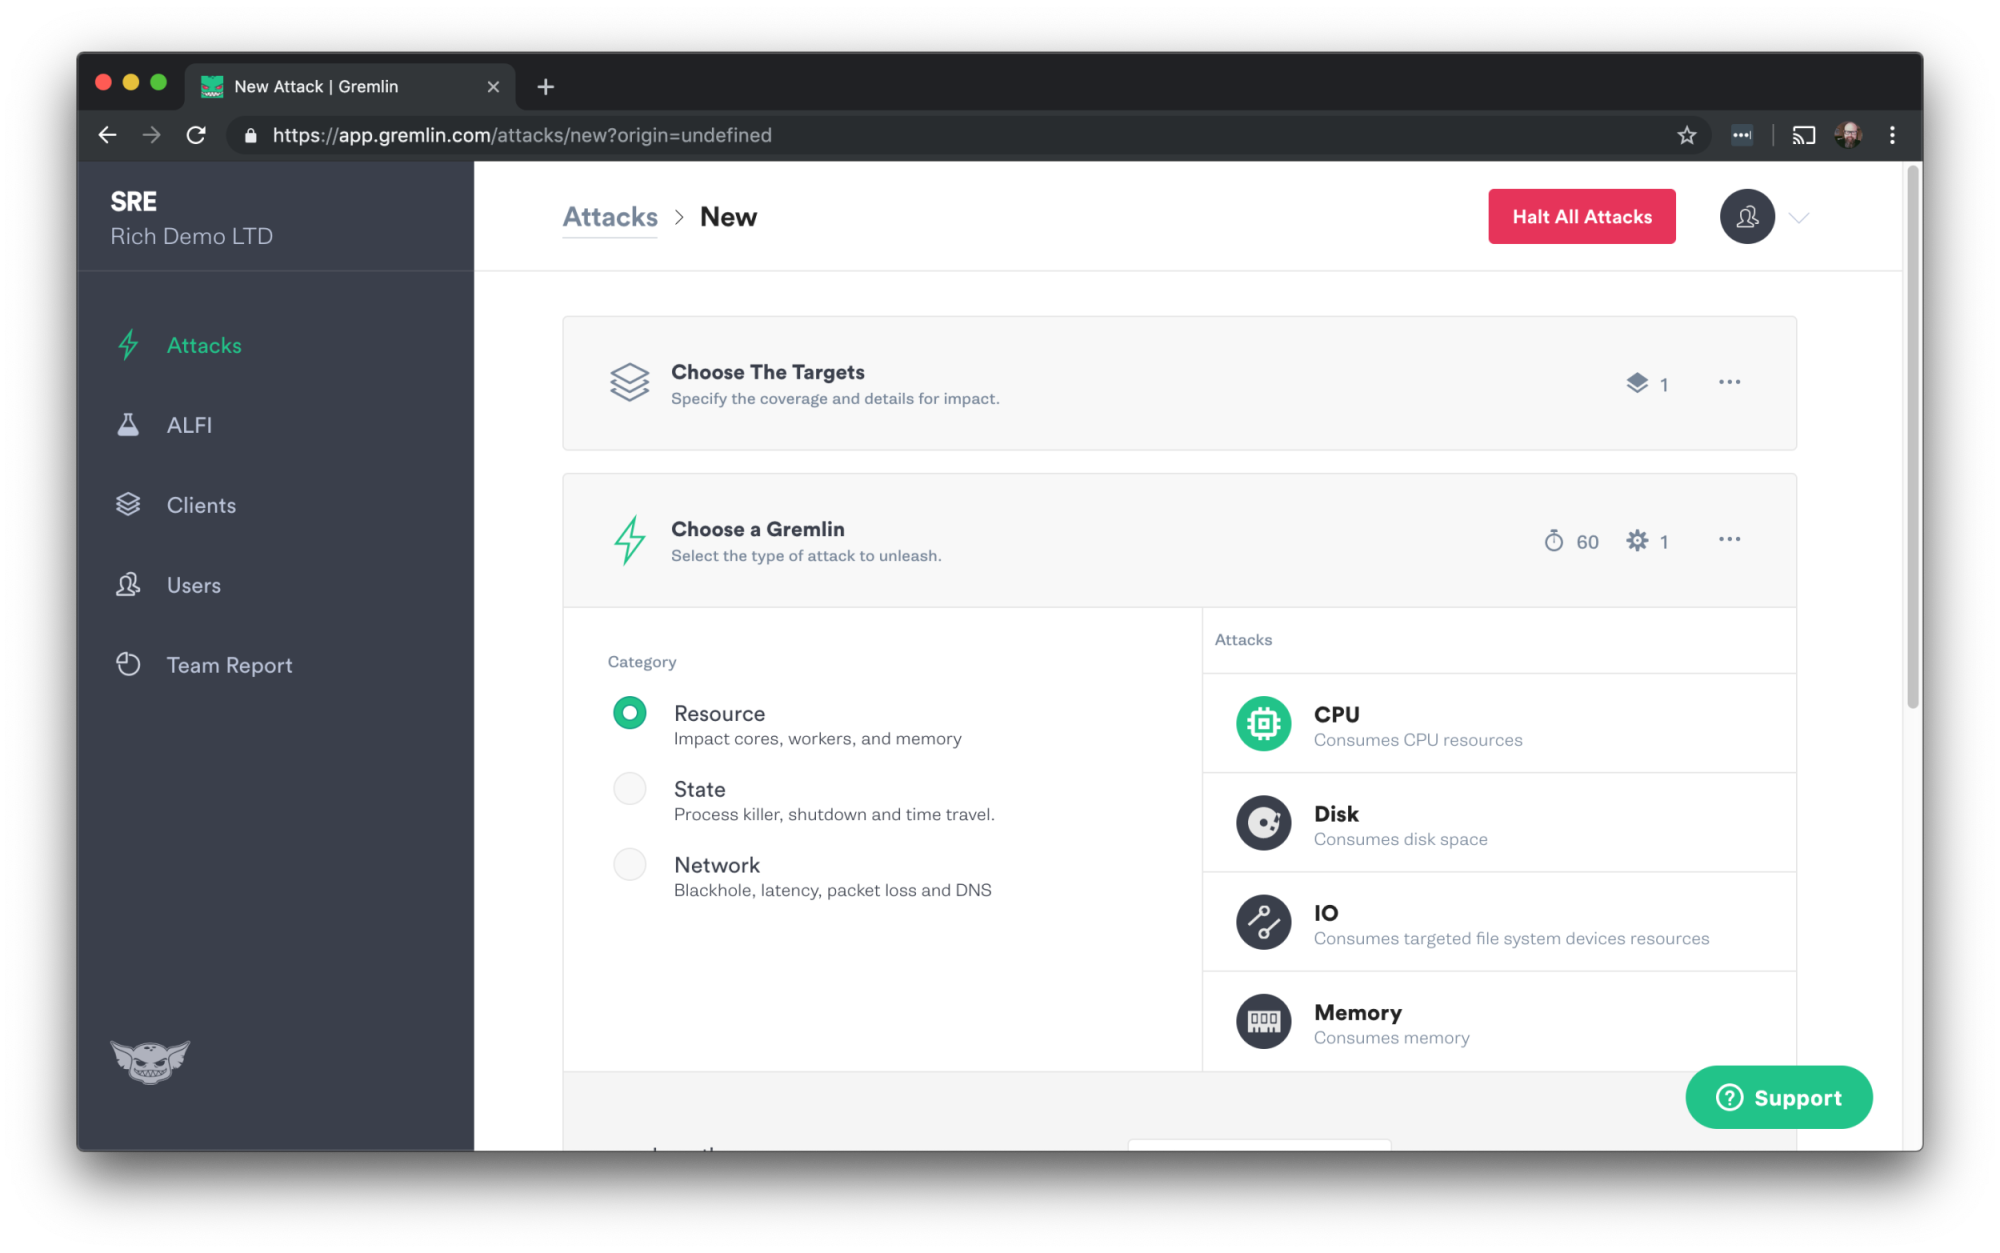
Scroll down and we’ll set the parameters for the attack. Change the length to 120 seconds. Click on the pulldown menu for Cores and select All Cores. Then click the Unleash Gremlin button.

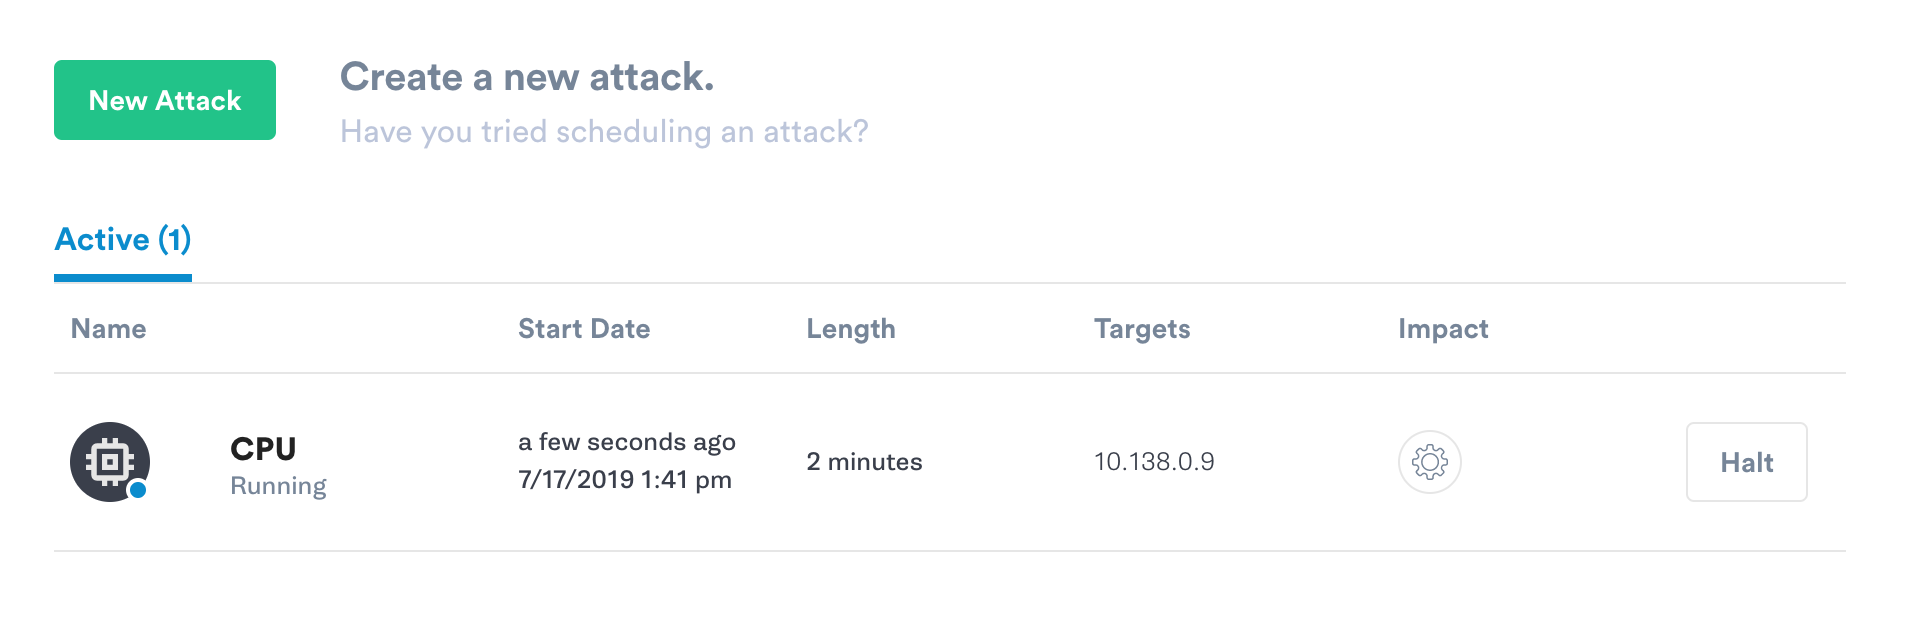
On the Attacks page you’ll see the attack listed as Pending for a bit, and then it will change to Running.
Now go back to Datadog. Click on Events in the left navigation bar. On the Events page you should now see that your CPU alert was triggered when the CPU idle dropped below 40 percent, as well as messages from Gremlin about the attack starting and ending.
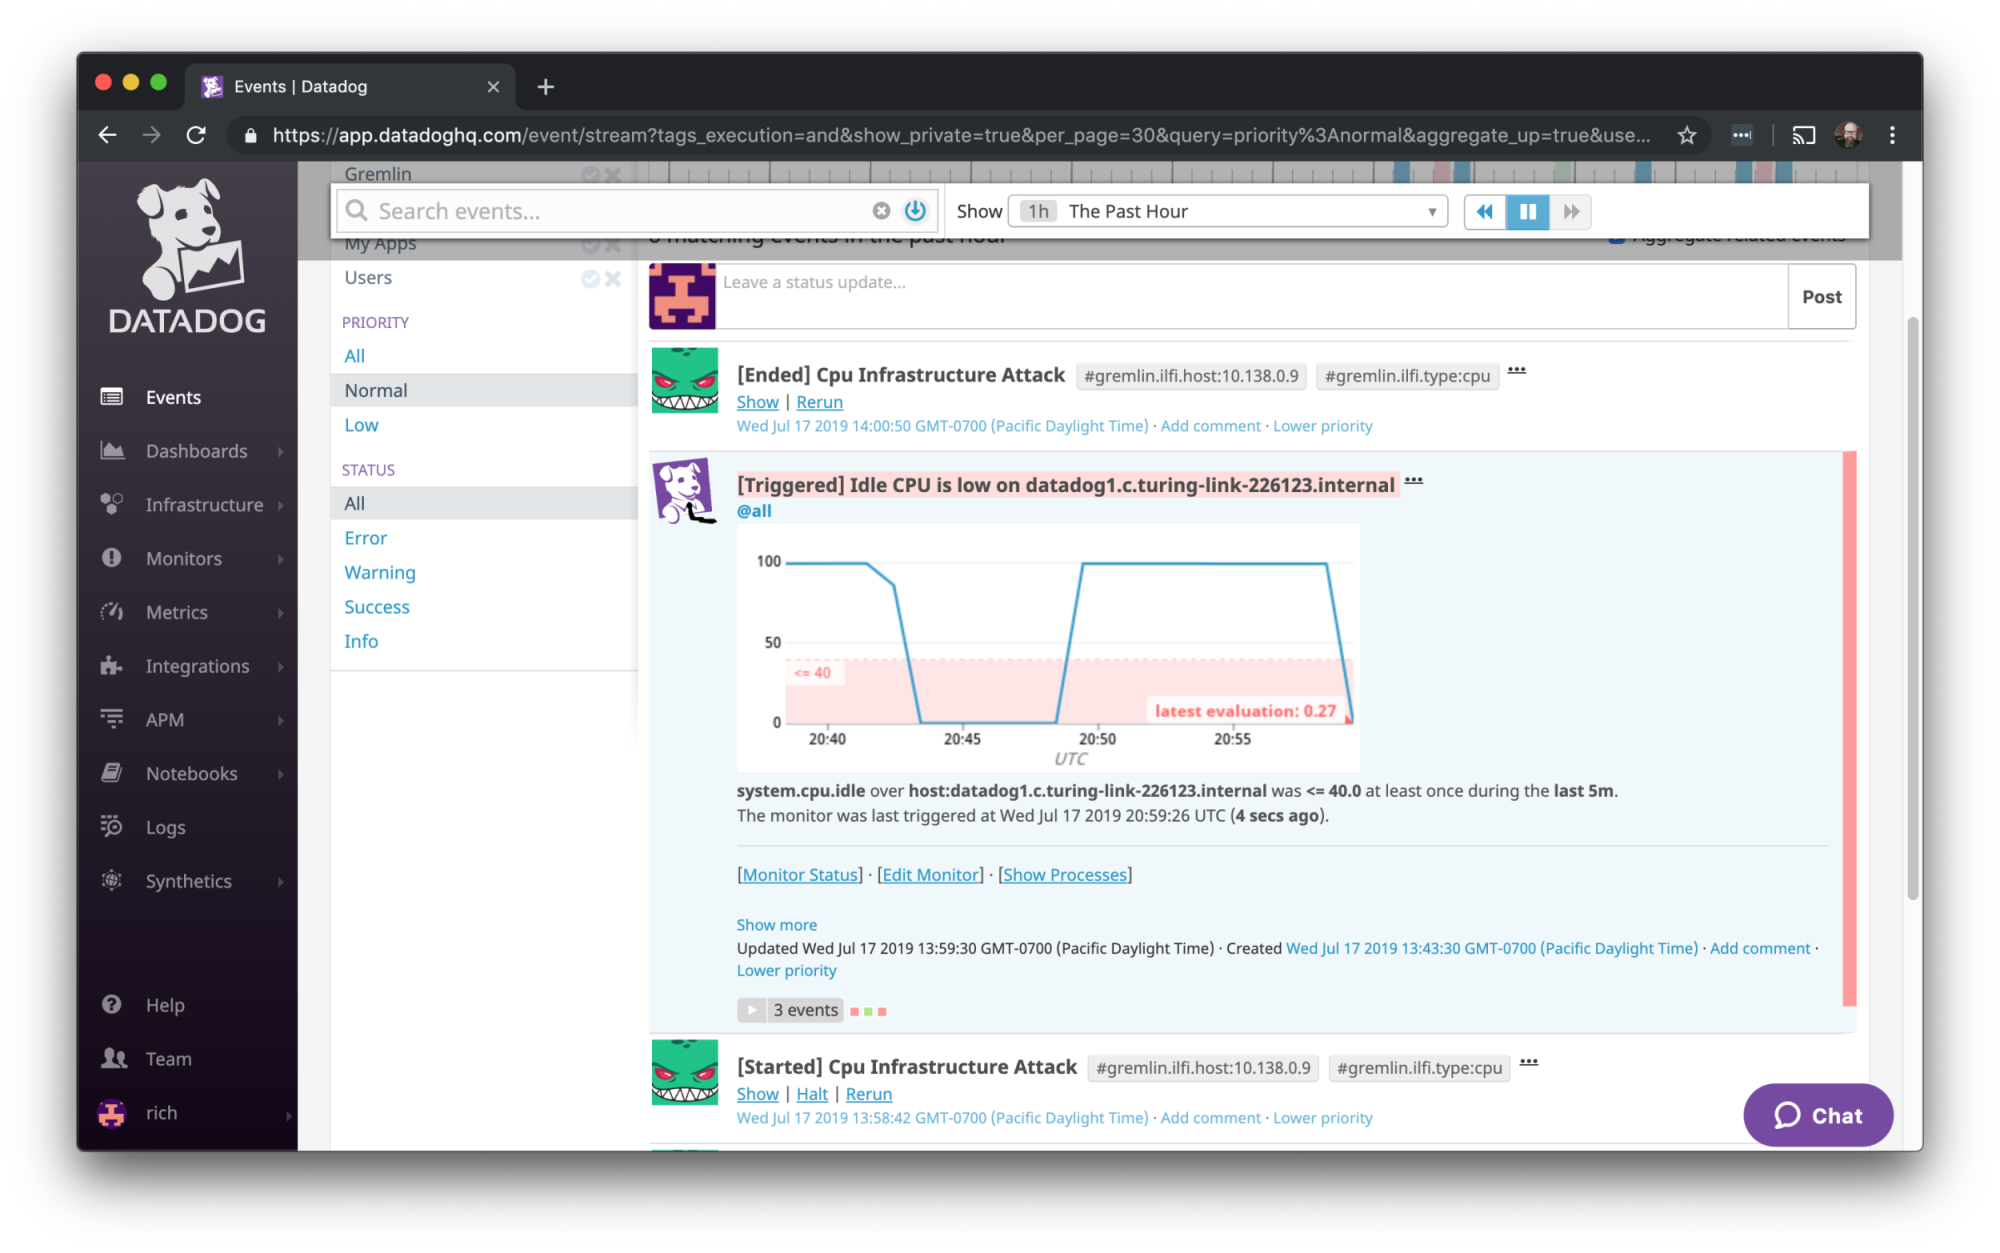
This was the initial level of our integration with Datadog, and it provides some nice information for anyone looking at the Events page. It’s pretty easy to correlate the CPU spike with the attack that was run. This would be handy if someone oncall was alerted due to an attack, or was investigating an incident.
What we’ve added recently to the integration is a webhook that allows you to have Datadog automatically stop all running Gremlin attacks when a specific alert is triggered. We’ll set that up next.
Step 6 - Set up the Datadog webhook
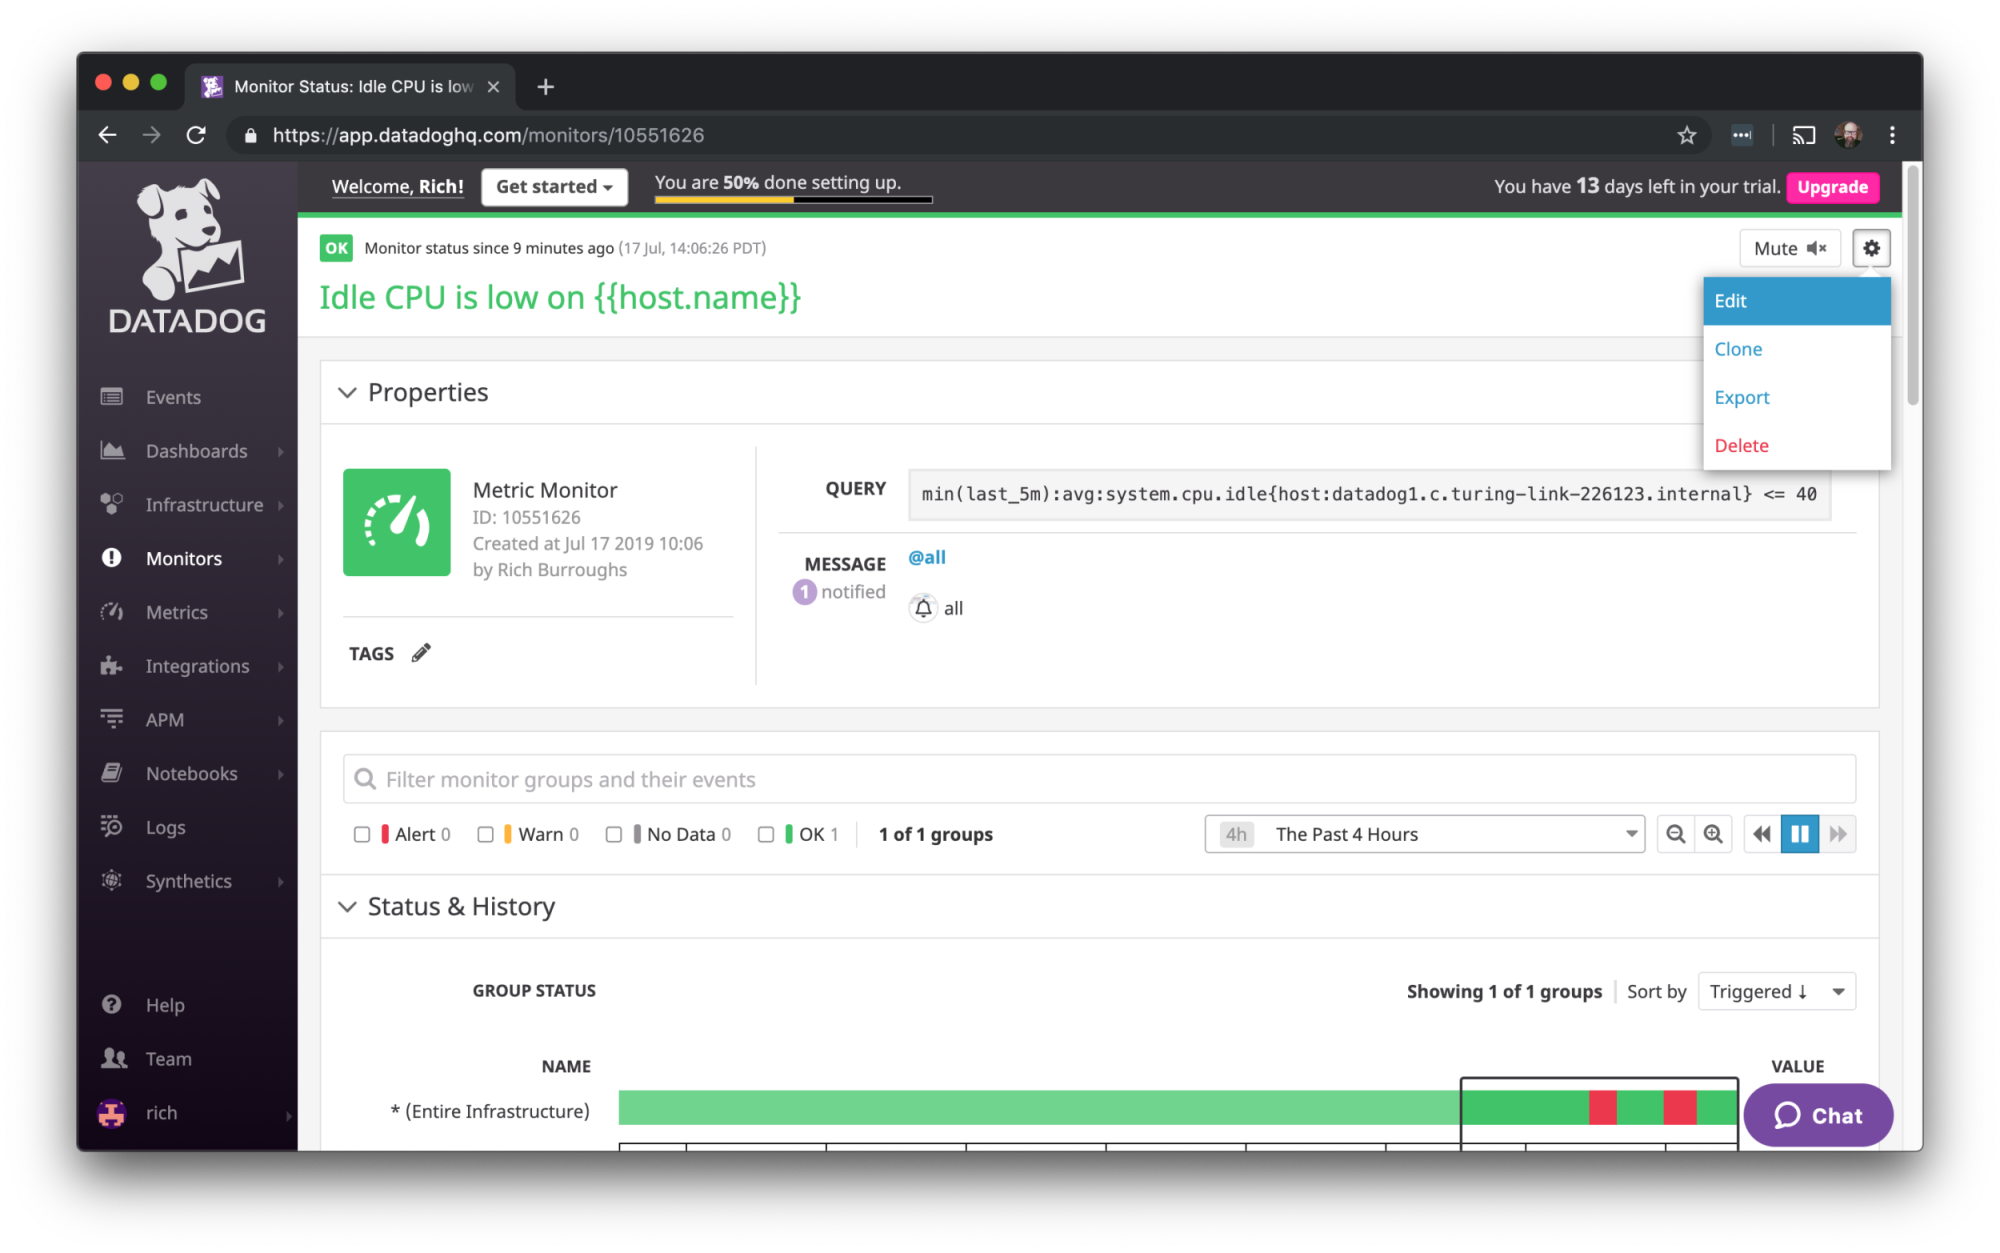
In Datadog, click Monitors in the left navigation bar, and then Manage Monitors. This will take you to the list of monitors configured, and you’ll see the CPU monitor we added.

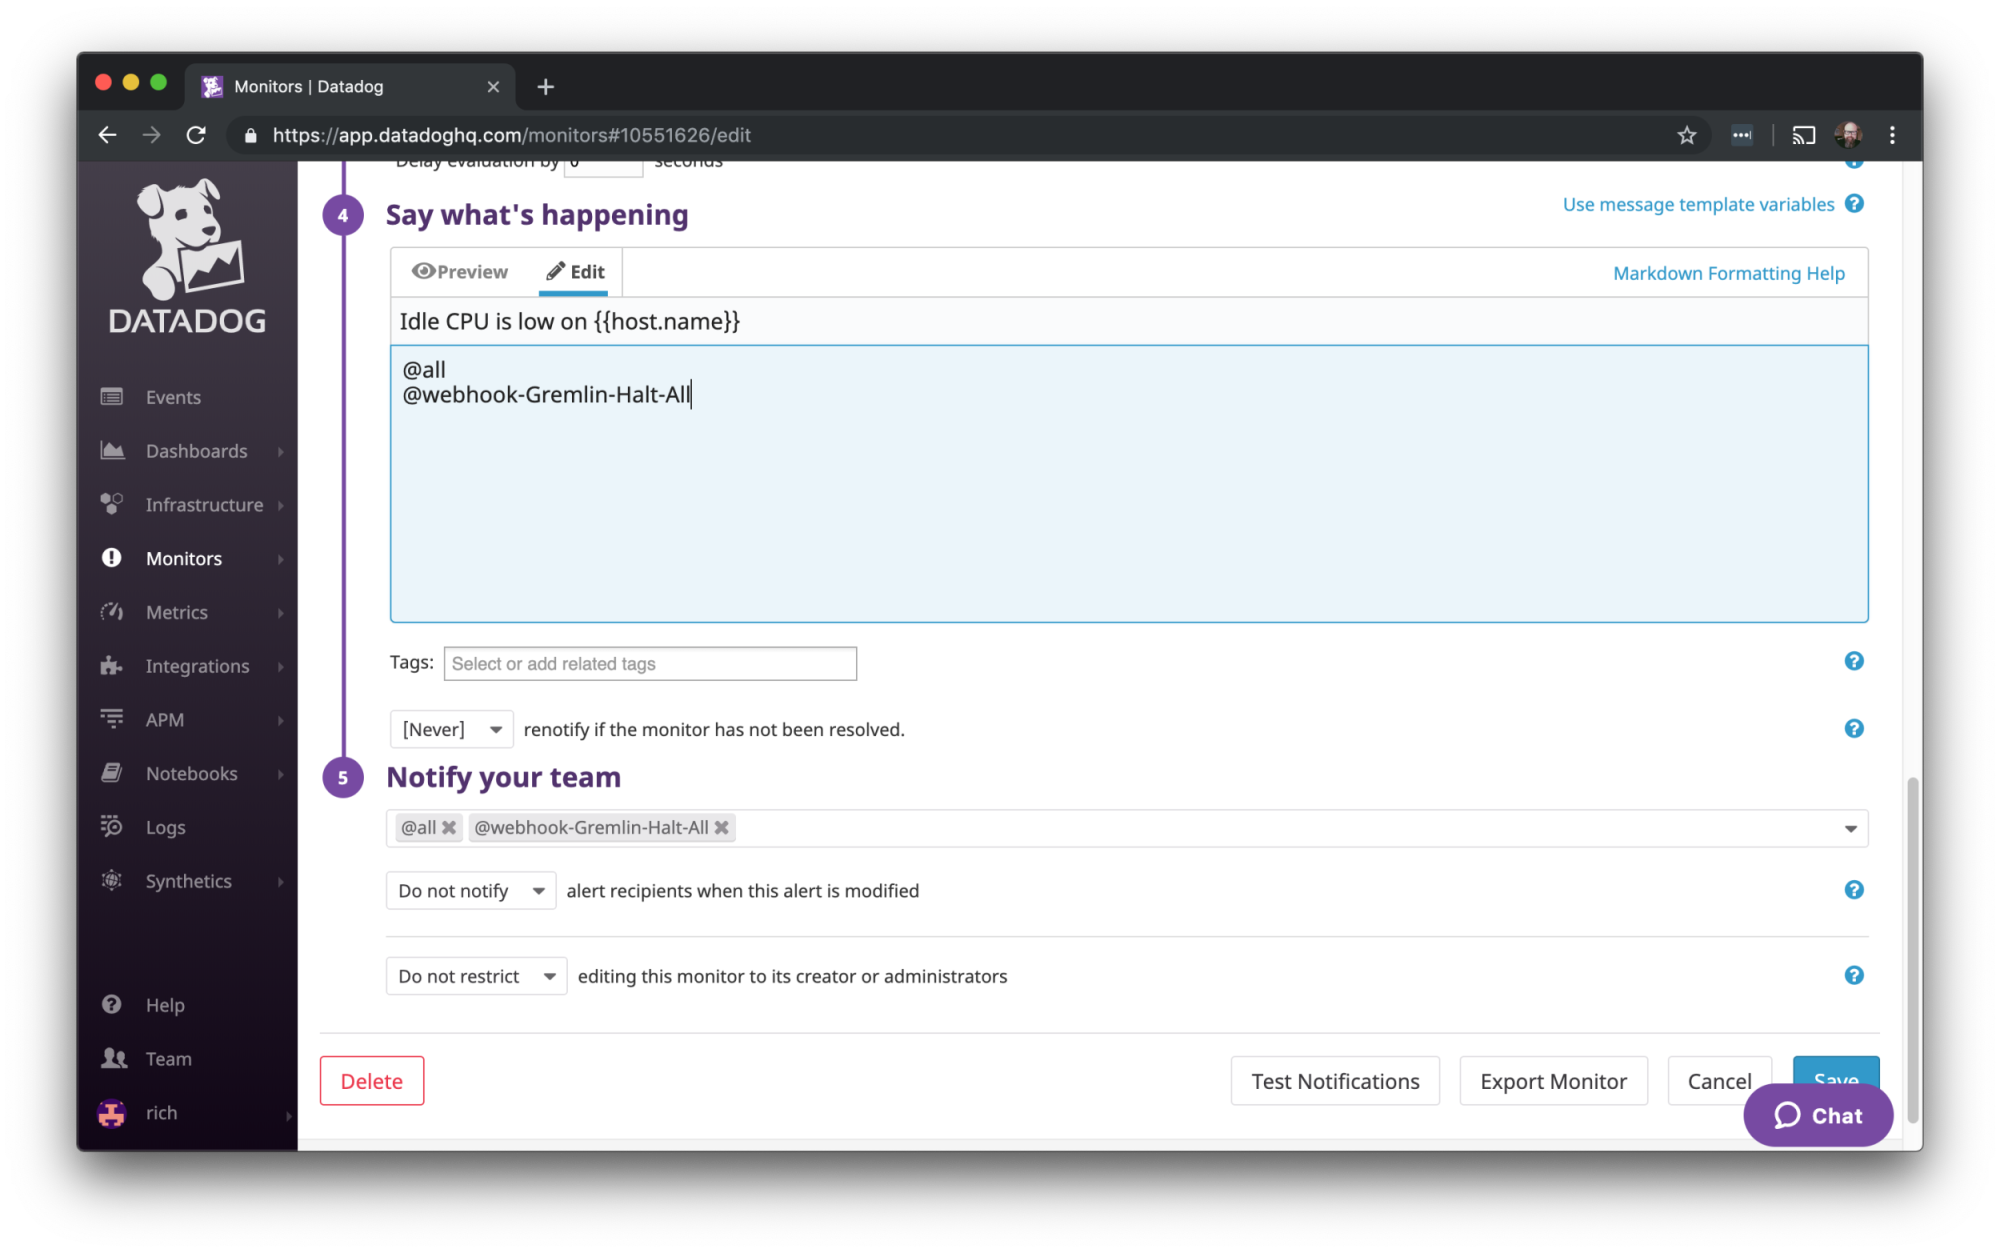
Click on it and we’ll get back to the page for the monitor. On the actions menu in the upper right click Edit.
That will take us back to the same screen we saw when we configured the monitor. Scroll down to the “Say what’s happening” section. We’ll add a line here that says @webhook-Gremlin-Halt-All:
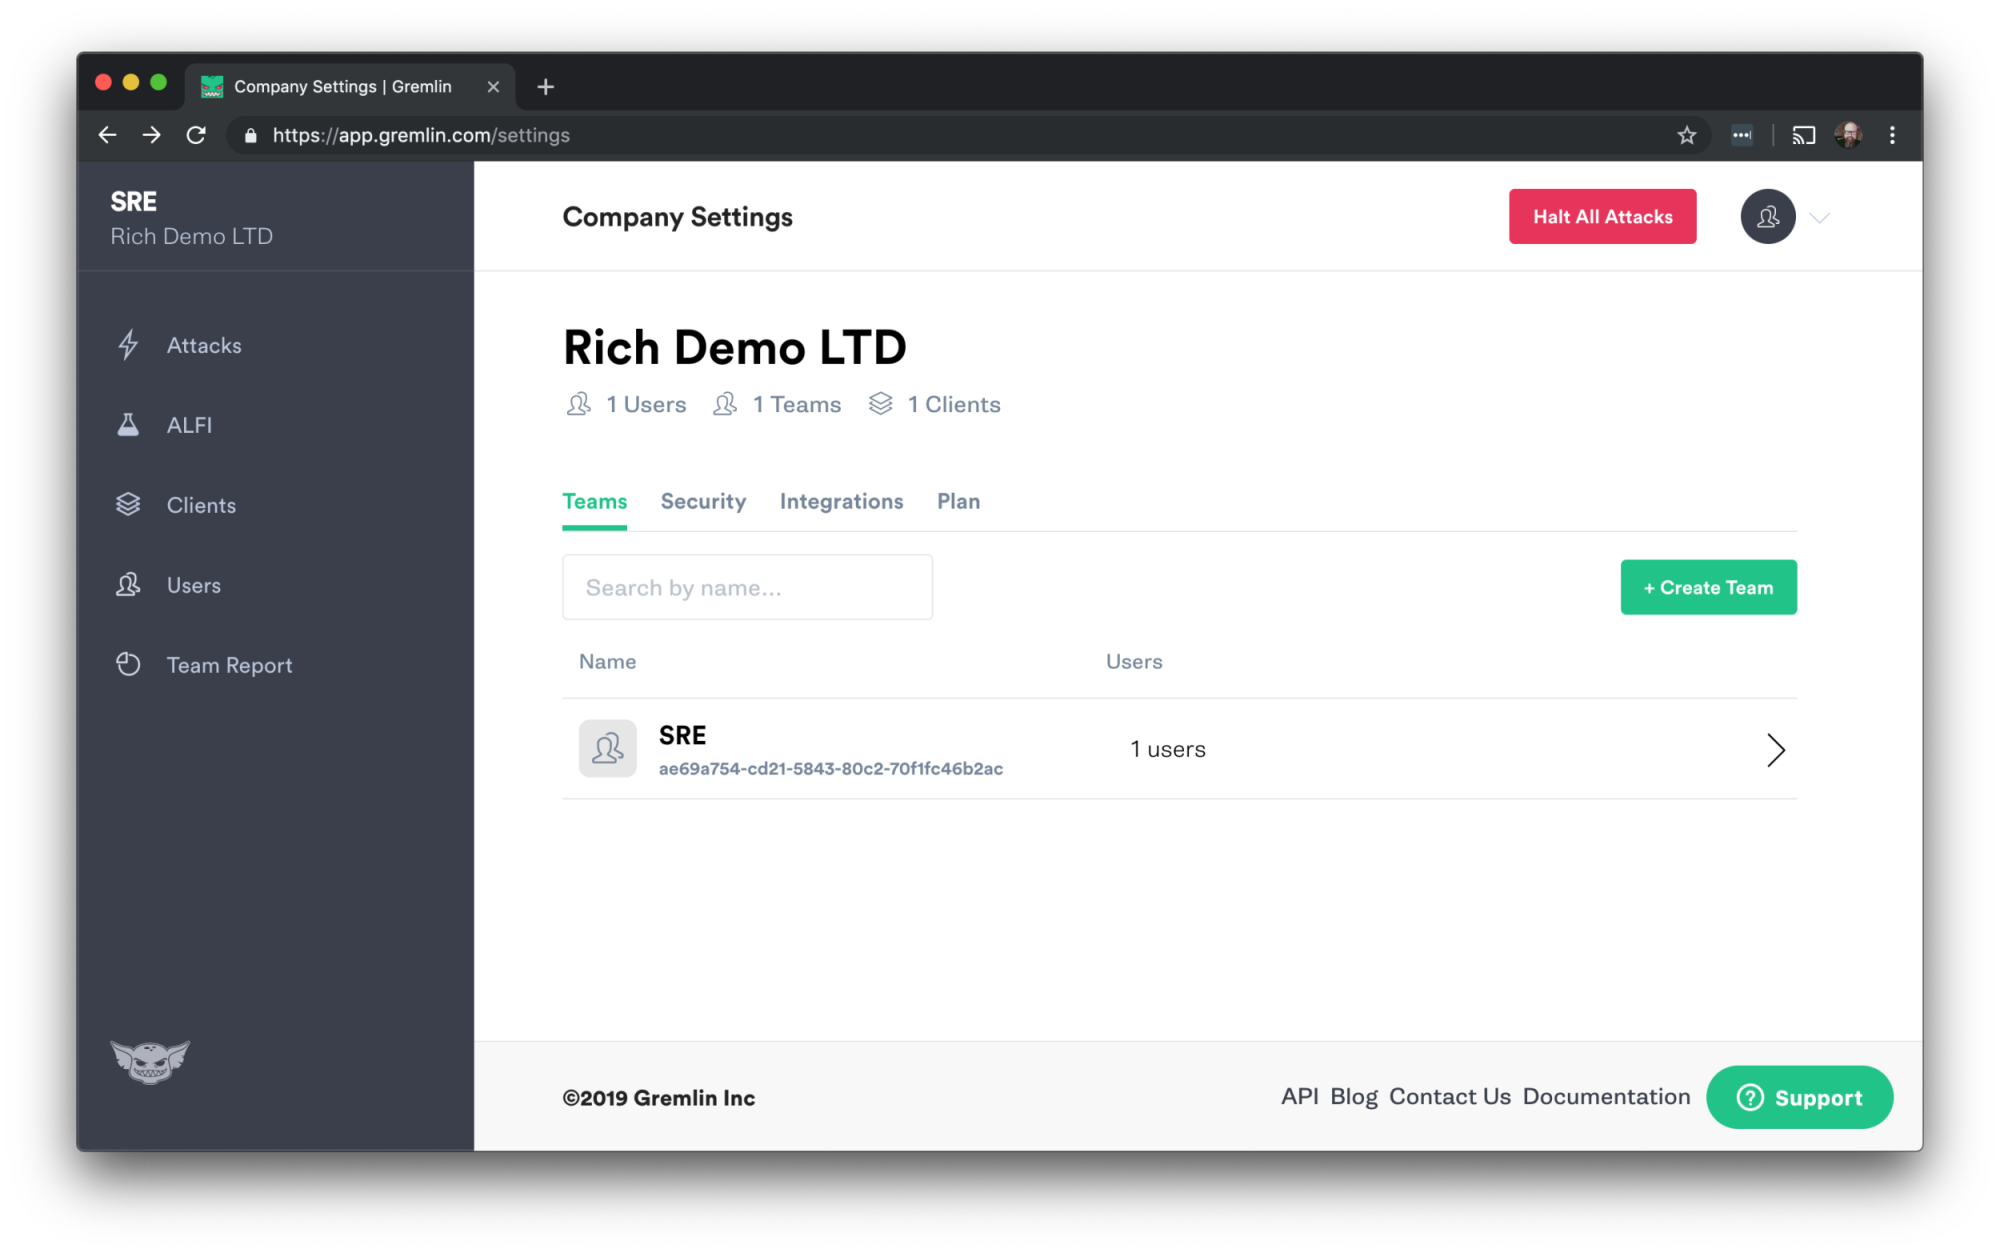
The next step is to set up Datadog to connect to Gremlin using the webhook. To do that, we’ll need a Gremlin API key. Log in to Gremlin and go to Company Settings. It should open to the Teams tab, and you’ll see your team on the list.
Click on your team name. On the next screen click on API Keys.
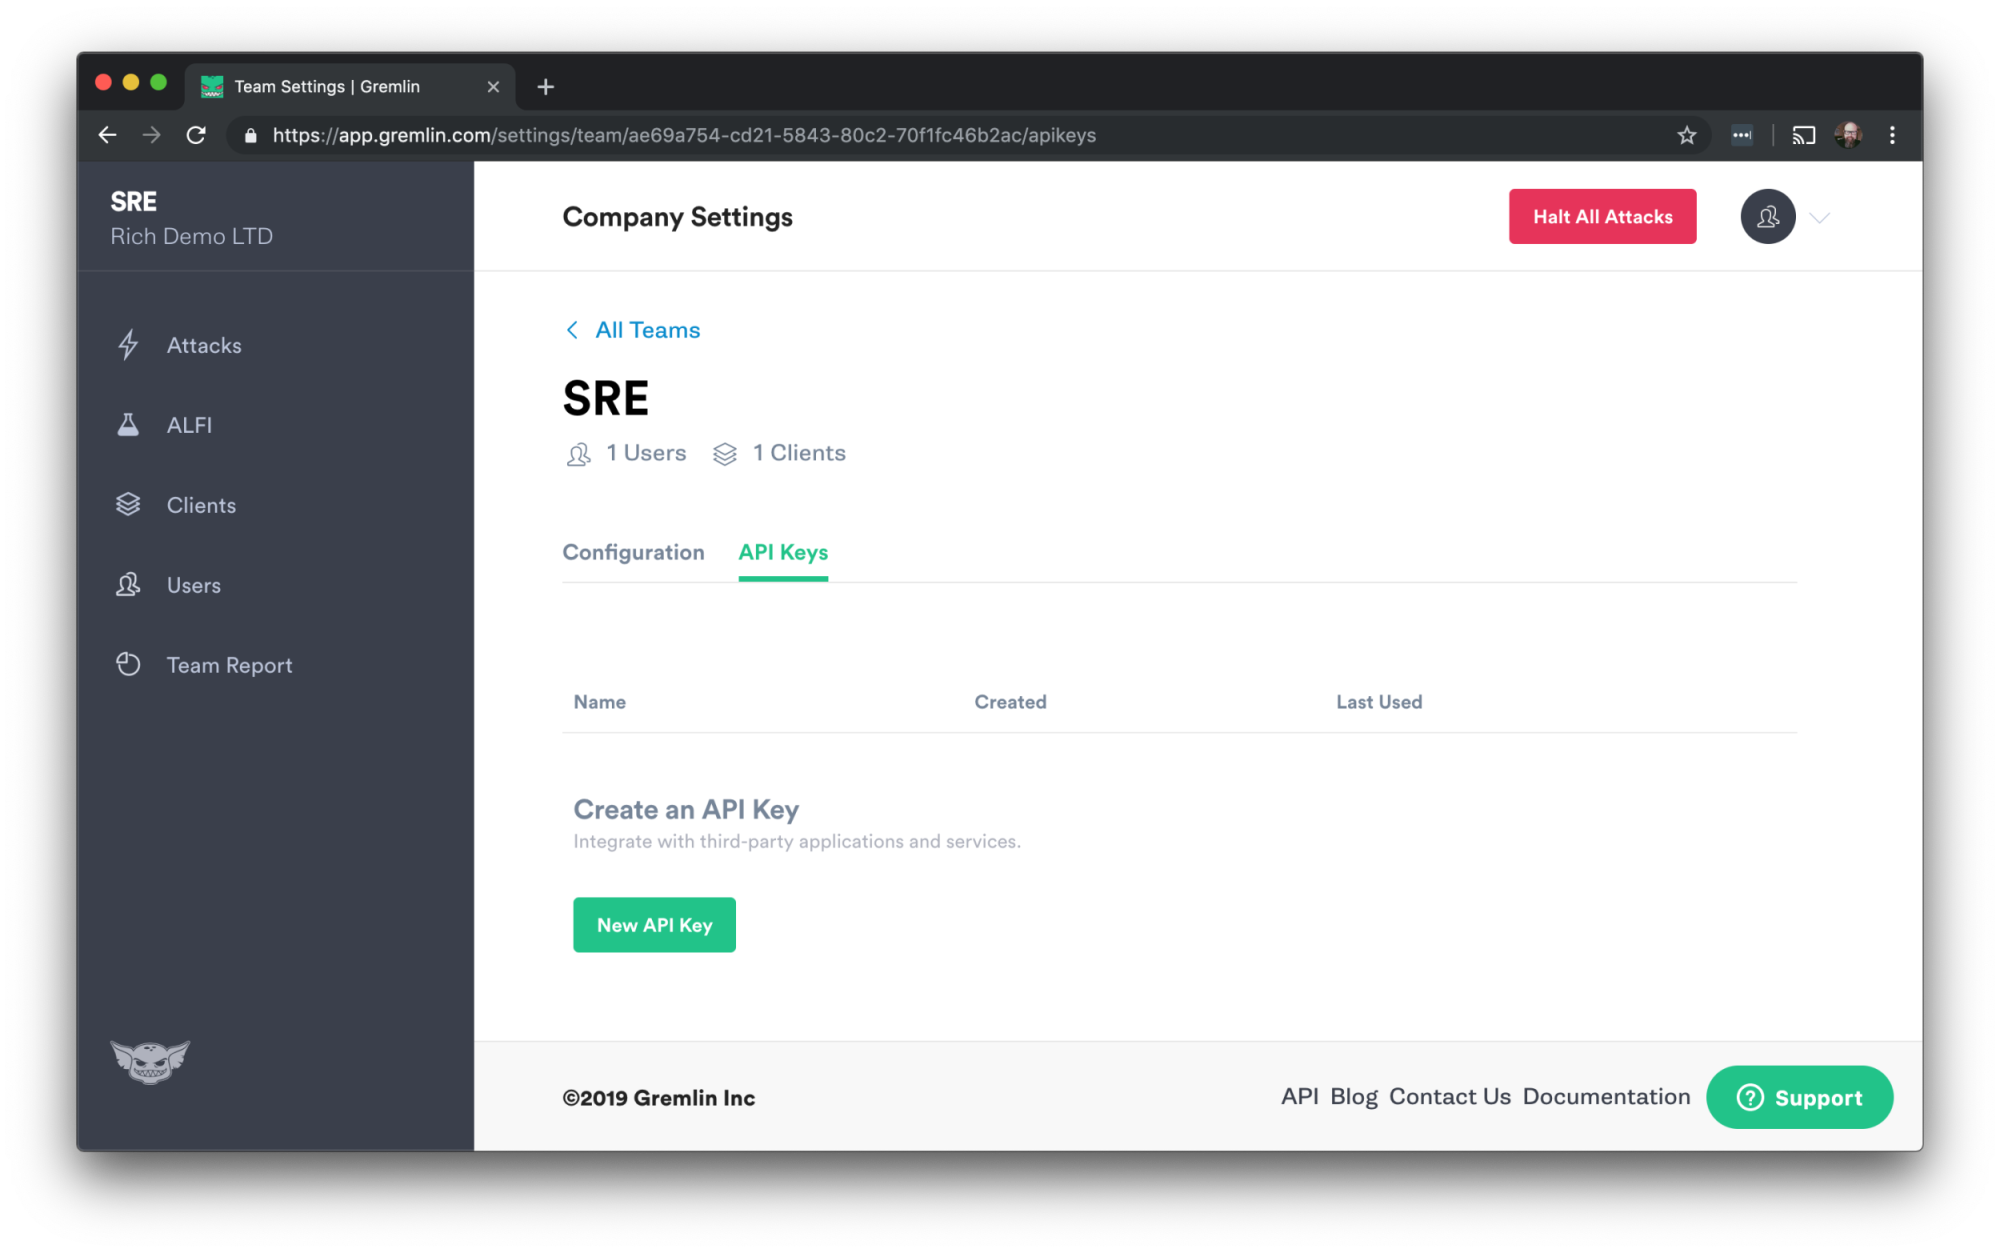
Click the New API Key button. Enter a name and description of the key and hit the Save button.
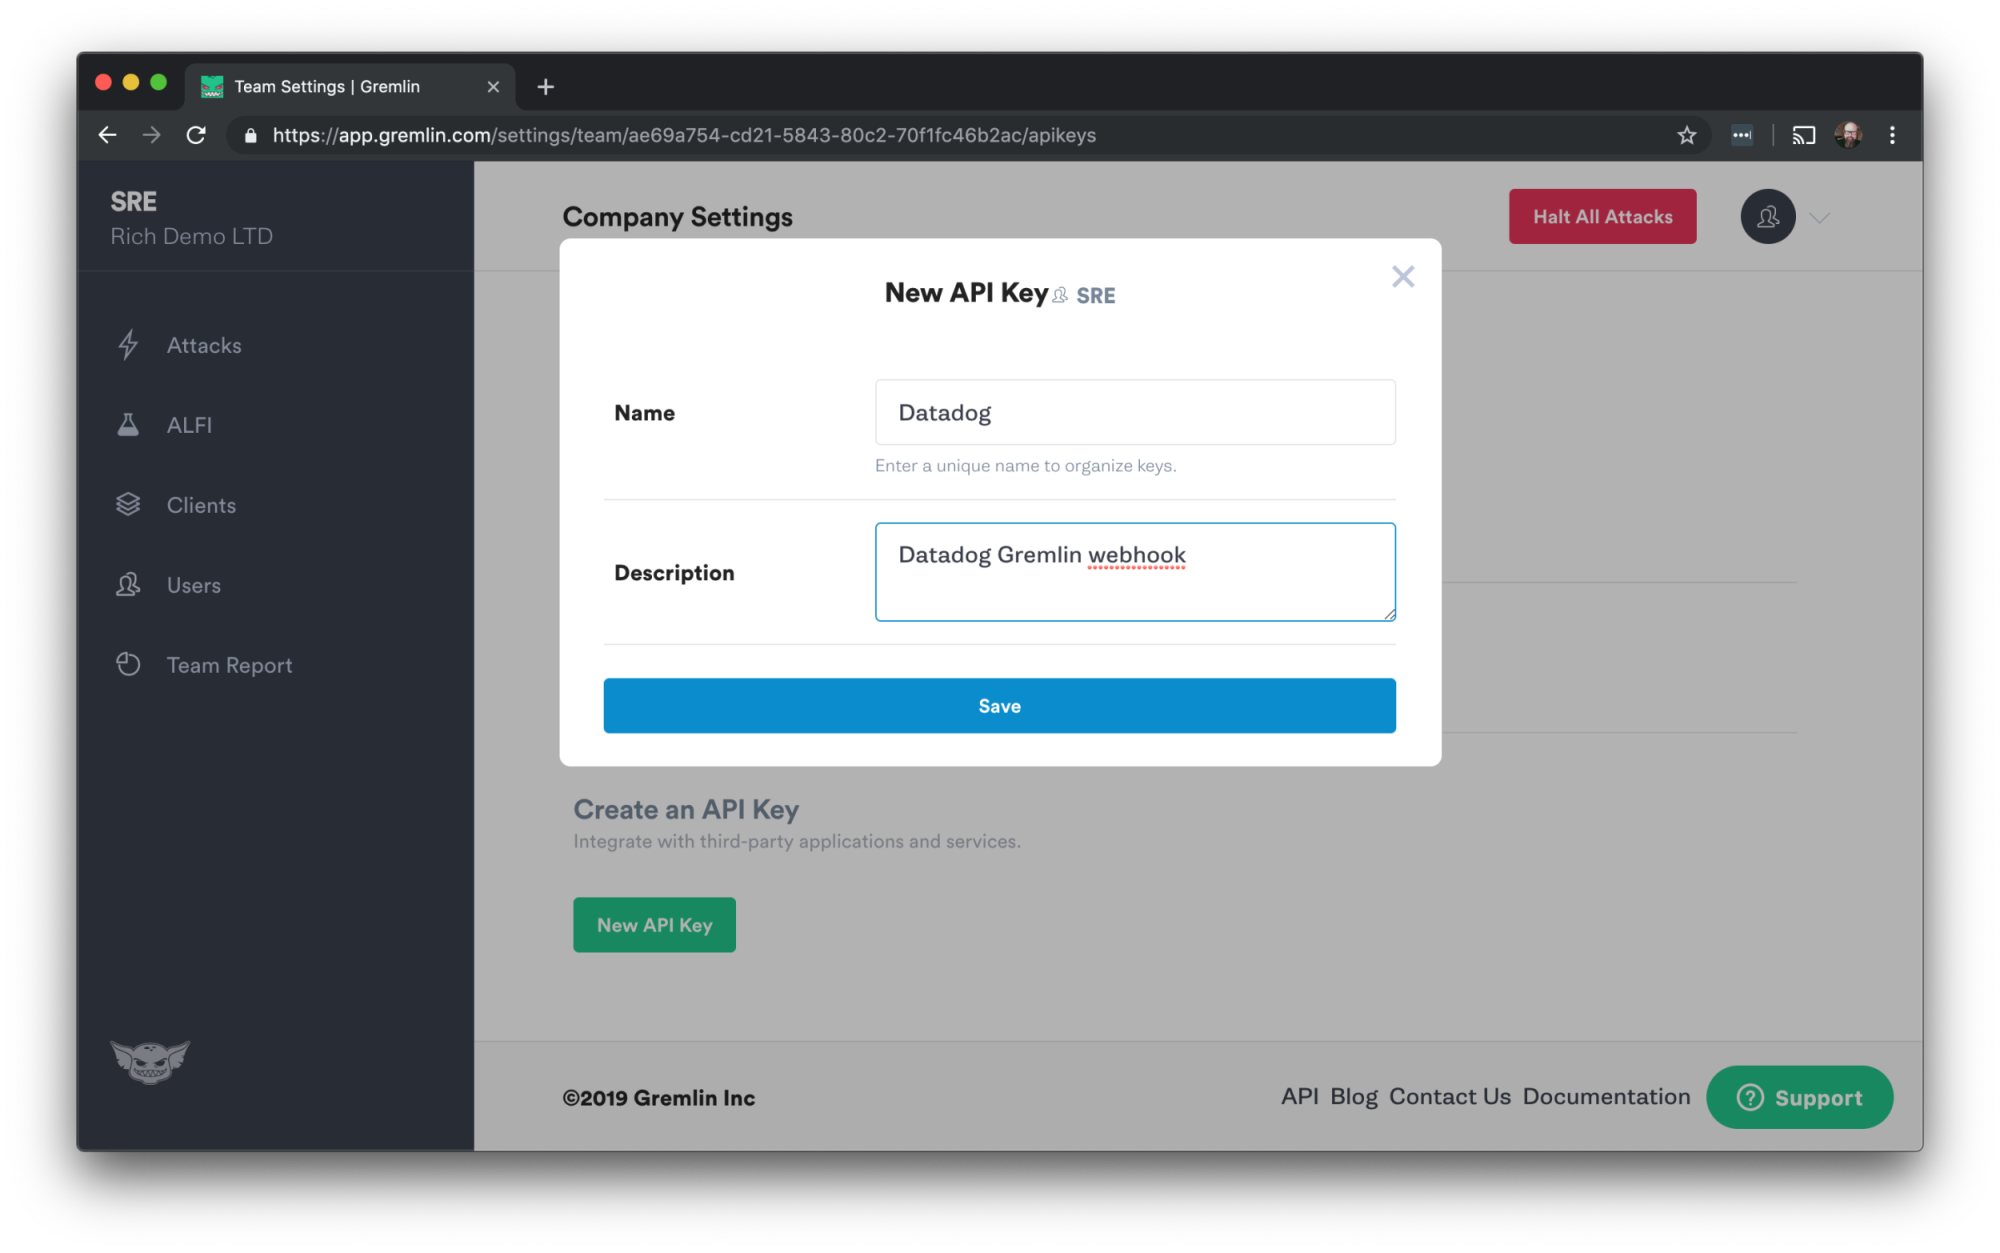
On the next screen you’ll be shown the API key in another popup window. Make a note of it. This is the only time you’ll be able to view the API key in Gremlin. If you ever lose it, you’ll need to generate a new one.
The next step is to go back to Datadog and add the ability to use webhooks. In Datadog, this is considered an integration, just like Gremlin. In the left navigation bar, click Integrations. Scroll down through the available list and find Webhooks.
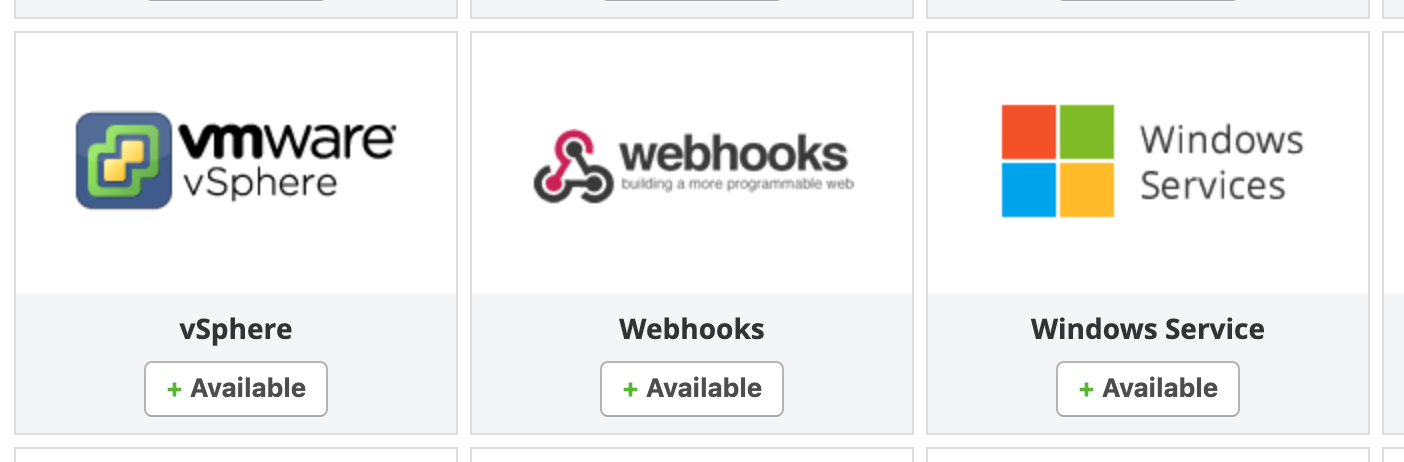
Hover your mouse over it and click Install.
You’ll get a similar popup window to the one we saw when we installed the Gremlin integration. Click on Configuration.

Scroll down to the bottom of the popup window and that’s where we’ll enter the values for the webhook.
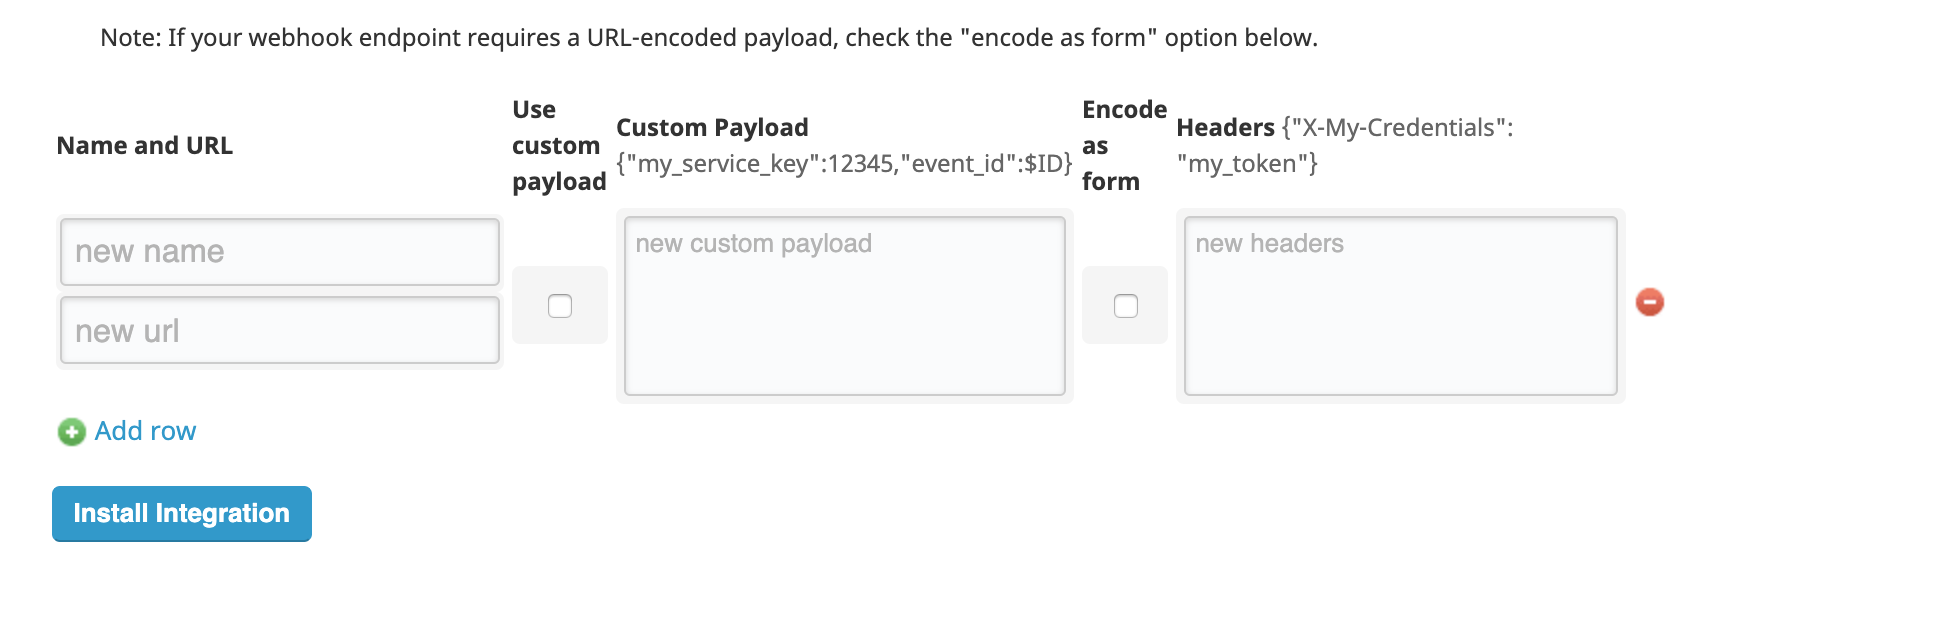
Use these values:
Name: Gremlin-Halt-All
URL: https://api.gremlin.com/v1/attacks/halt
Click the checkbox for “Use custom payload.”
Custom Payload: {"reason": "$ALERT_STATUS", "reference": "$LINK"}
Headers: {"Authorization": "Key your-api-key-here"}
Replace “your-api-key-here” with the API key we generated in Gremlin.
After you’ve entered all that data, the screen should look like this:
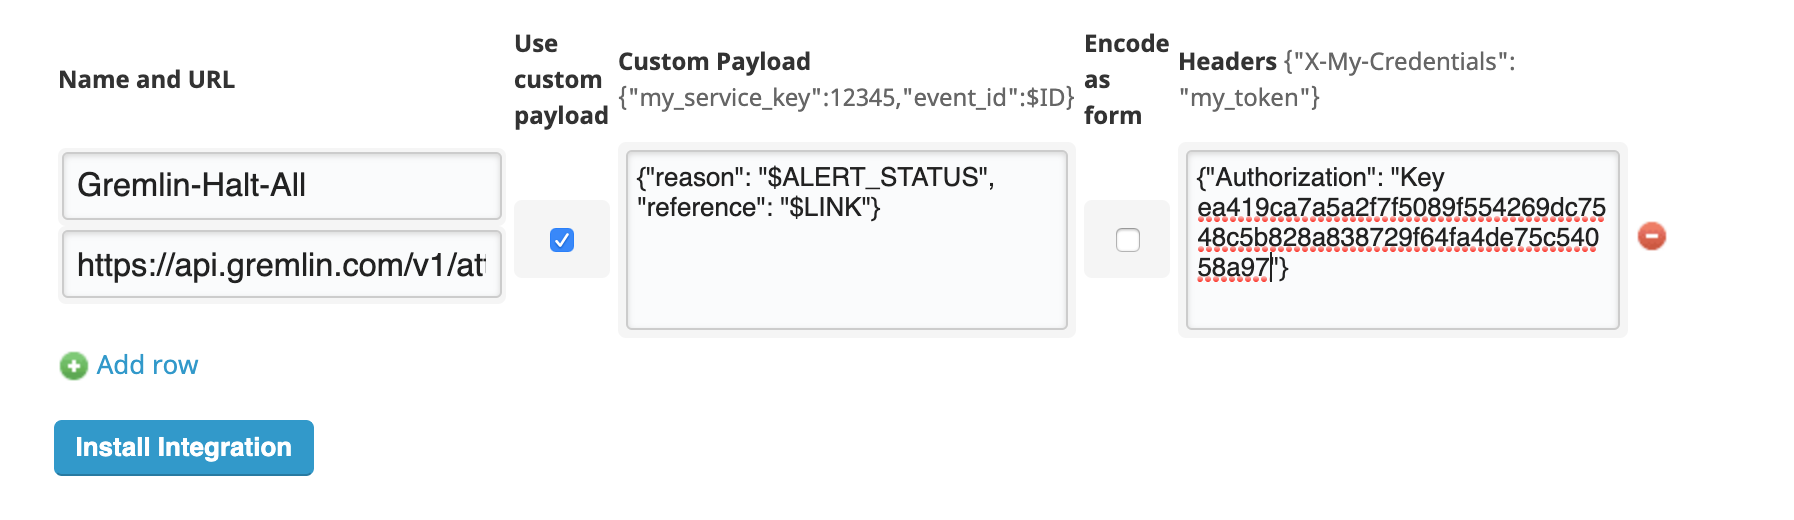
Hit the Install Integration button. The popup window will update and add another row to configure an additional webhook, as some companies may want to use multiple webhooks. We don’t need to do that right now, so you can close the popup window.
So, we’ve configured the Gremlin-Halt-All webhook, and set up our Datadog CPU idle monitor to call the webhook when an alert is triggered. That should result in all Gremlin attacks being halted.
Let’s test that out. Go to Gremlin again and click Attacks and New Attack again, and select your Ubuntu host as the target. Click “Choose a Gremlin.” Select Resource and CPU, and we’ll enter the same parameters as before, 120 seconds and All Cores.
Click Unleash Gremlin.
Once the status of the attack changes to Running, go to Datatog again and click Events in the left navigation bar. In a bit you should start to see some events stream in. There will be one for the CPU attack starting, one for the alert being triggered, and one for the attack ending.
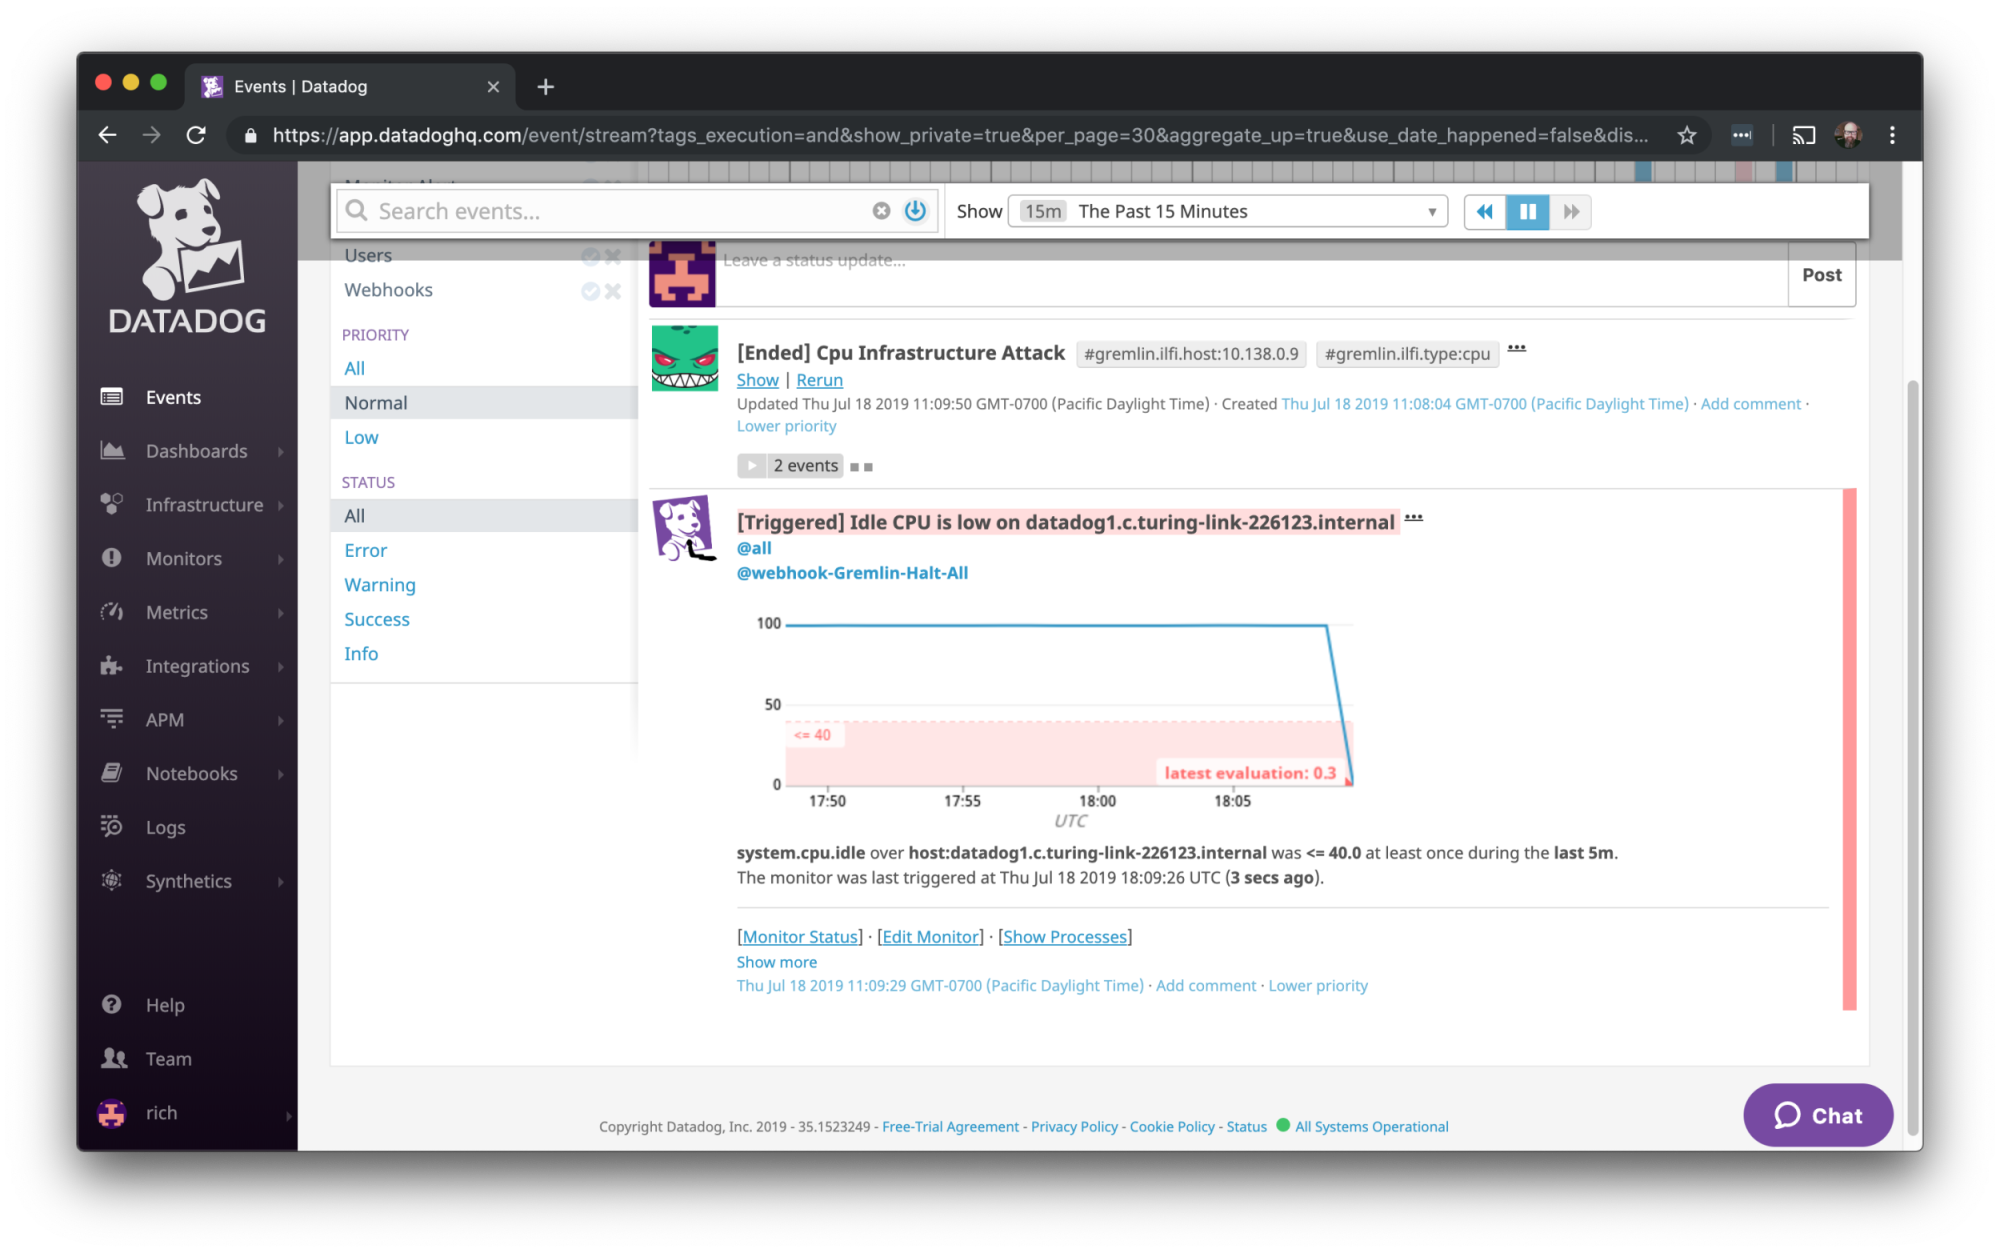
Notice that this time @webhook-Gremlin-Halt-All got a notification for the alert.
Now look back at the attacks page in Gremlin. You should see that the CPU attack is no longer running and is marked as User Halted.
The webhook being triggered would have also halted any other Gremlin attacks that were also running.
Conclusion
We explored how to install Gremlin and Datadog, how to configure the Gremin/Datadog integration, and how to run CPU attacks in Gremlin. We also saw how to configure Datadog to trigger the webhook when an alert fires, which will halt all Gremlin attacks.
An important concept in Chaos Engineering is Abort Conditions. These are the conditions that would make you feel like you would want to halt the Chaos Engineering experiment immediately. Often those are defined as an increase in error rate or latency..
We walked through the example CPU idle monitor to show you how the Datadog integration and webhook work. Abort conditions can vary based on your application and the types of experiments you conduct. You can read our guide called How to Create Chaos Engineering Dashboards in Datadog for some more ideas for metrics you can look at.
You can find out more about the other attacks you can do with Gremlin by reading the documentation. To learn more about Chaos Engineering join our Chaos Engineering Slack, and read more tutorials on our Community page.
Avoid downtime. Use Gremlin to turn failure into resilience.
Gremlin empowers you to proactively root out failure before it causes downtime. See how you can harness chaos to build resilient systems by requesting a demo of Gremlin.

.svg)