Ensuring reliability with Gremlin Status Checks and PagerDuty

.svg)
.svg)

 This is an older tutorial
We often say that Chaos Engineering is a bit of a misnomer—it’s a practice that simulates the chaos of the real world, but the practice itself is methodical and structured in order to learn and to ensure your systems are safe. As you begin every chaos experiment, you need to:
- Ensure your systems are safe to experiment on prior to launching attacks
- Regularly evaluate your abort conditions to confirm that your applications are safe throughout the experiment
Gremlin’s Status Checks feature allows you to automatically do both! You can set up Status Checks to run before a Scenario to ensure your system is ready for experimentation. If your system is healthy, the scenario will run as planned, but if something is amiss the scenario will be unable to run.
In this tutorial we’ll use Status Checks to automatically check for incidents in PagerDuty. We’ll create a Scenario that starts with a Status Check to ensure it’s safe to experiment on our application and includes Status Checks after each attack to validate our reliability.
Step 1: Create a PagerDuty API key
In order to check use the PagerDuty API, we’ll need to create an API key. Log into your PagerDuty account, then from the “Configuration” menu in the top navigation, click the “API Access” menu item.
On the API Access Keys page, click the “Create New API Key” button. Give your new API key a description and check the “Read-only API Key” option. Gremlin Status Checks only require read access. Click “Create Key”.

Step 2: Log in to your Gremlin account
Log in to your Gremlin account. If you don't have an account, request a free trial.
Step 3: A Disk Exhaustion Scenario
There are a number of reasons why servers may run out of disk space, from file storage as part of normal use to errant applications generating excessive amounts of logs. No matter the case, disk exhaustion should be monitored.
Create a Scenario that tests an application by exhausting available disk space by clicking the “Create Scenario” tile on the Gremlin application homepage or the “New Scenario” button on the Scenarios page. Give your Scenario a title, description, and hypothesis.
Step 4: Adding a Status Check
Before adding attacks, we first want to ensure that there are no open incidents. Running a Chaos Experiment when there is an open incident could interfere with efforts to resolve the issue or even make the incident worse.
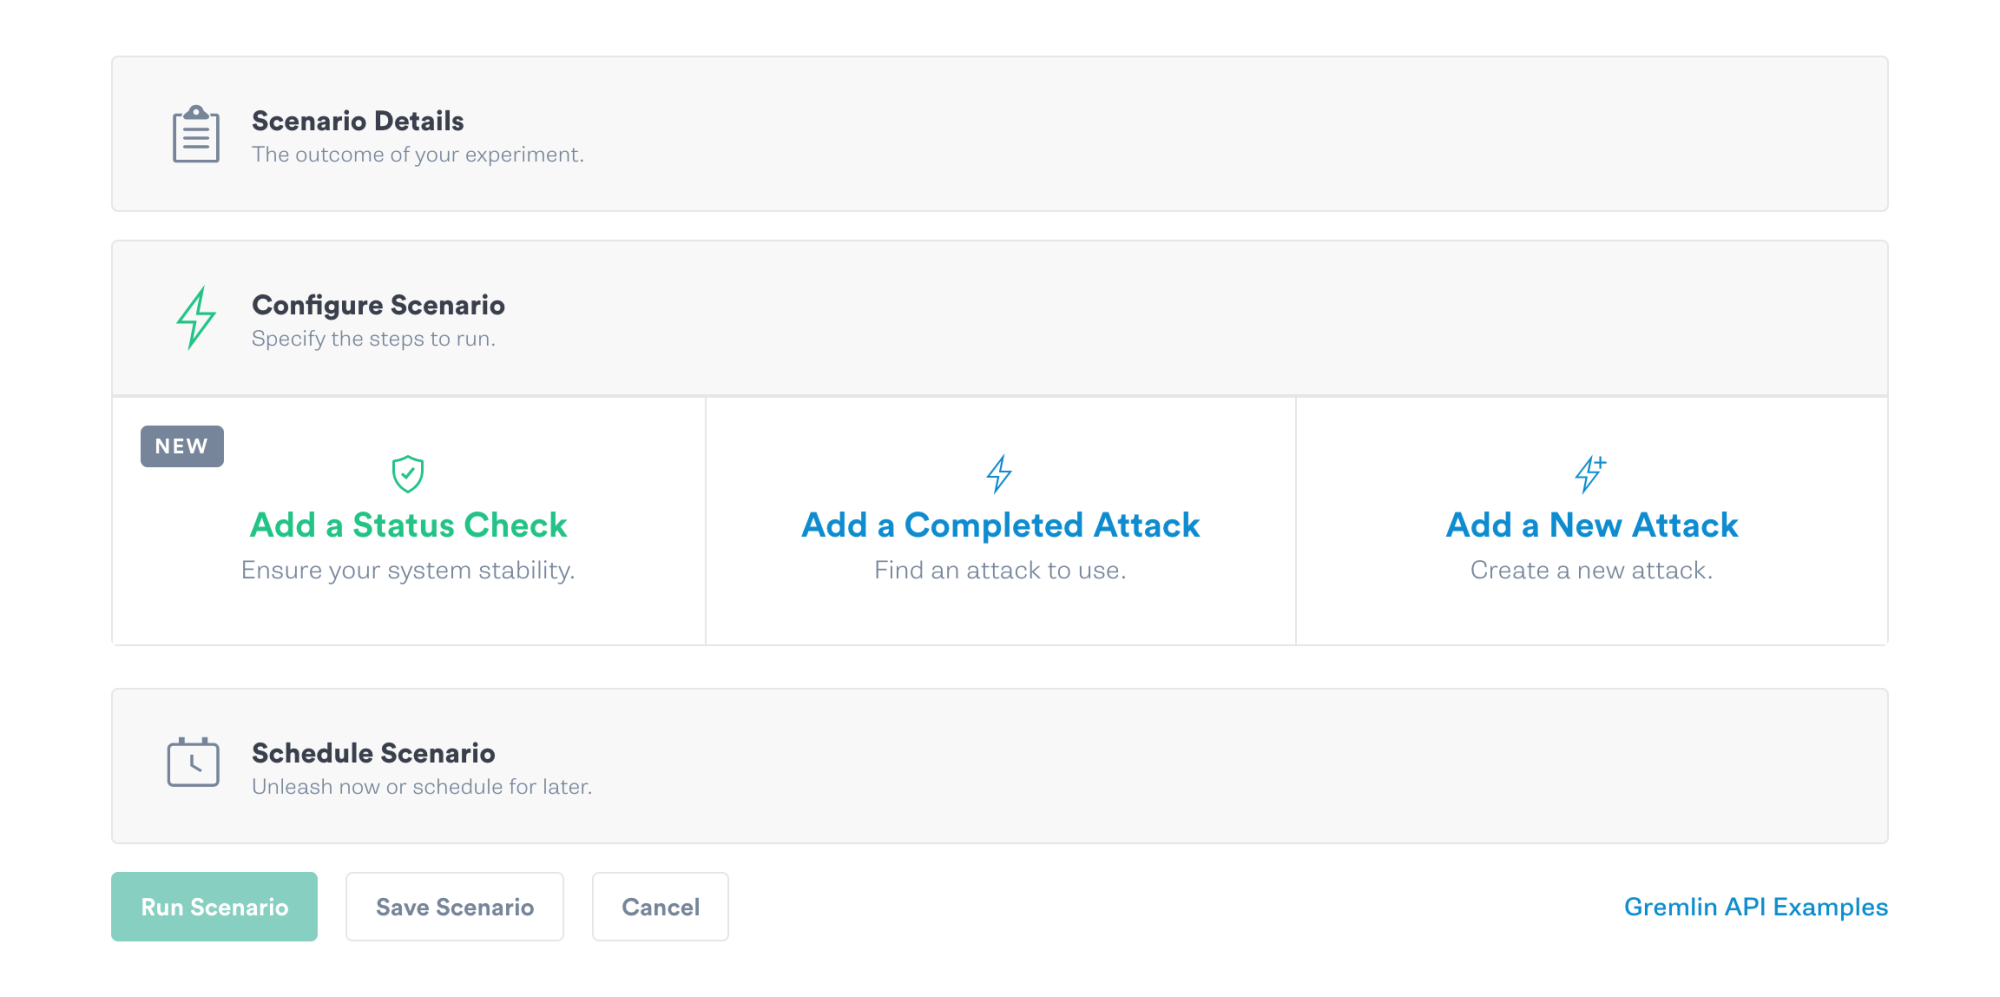
From the Scenario page, click the “Add a Status Check” button.
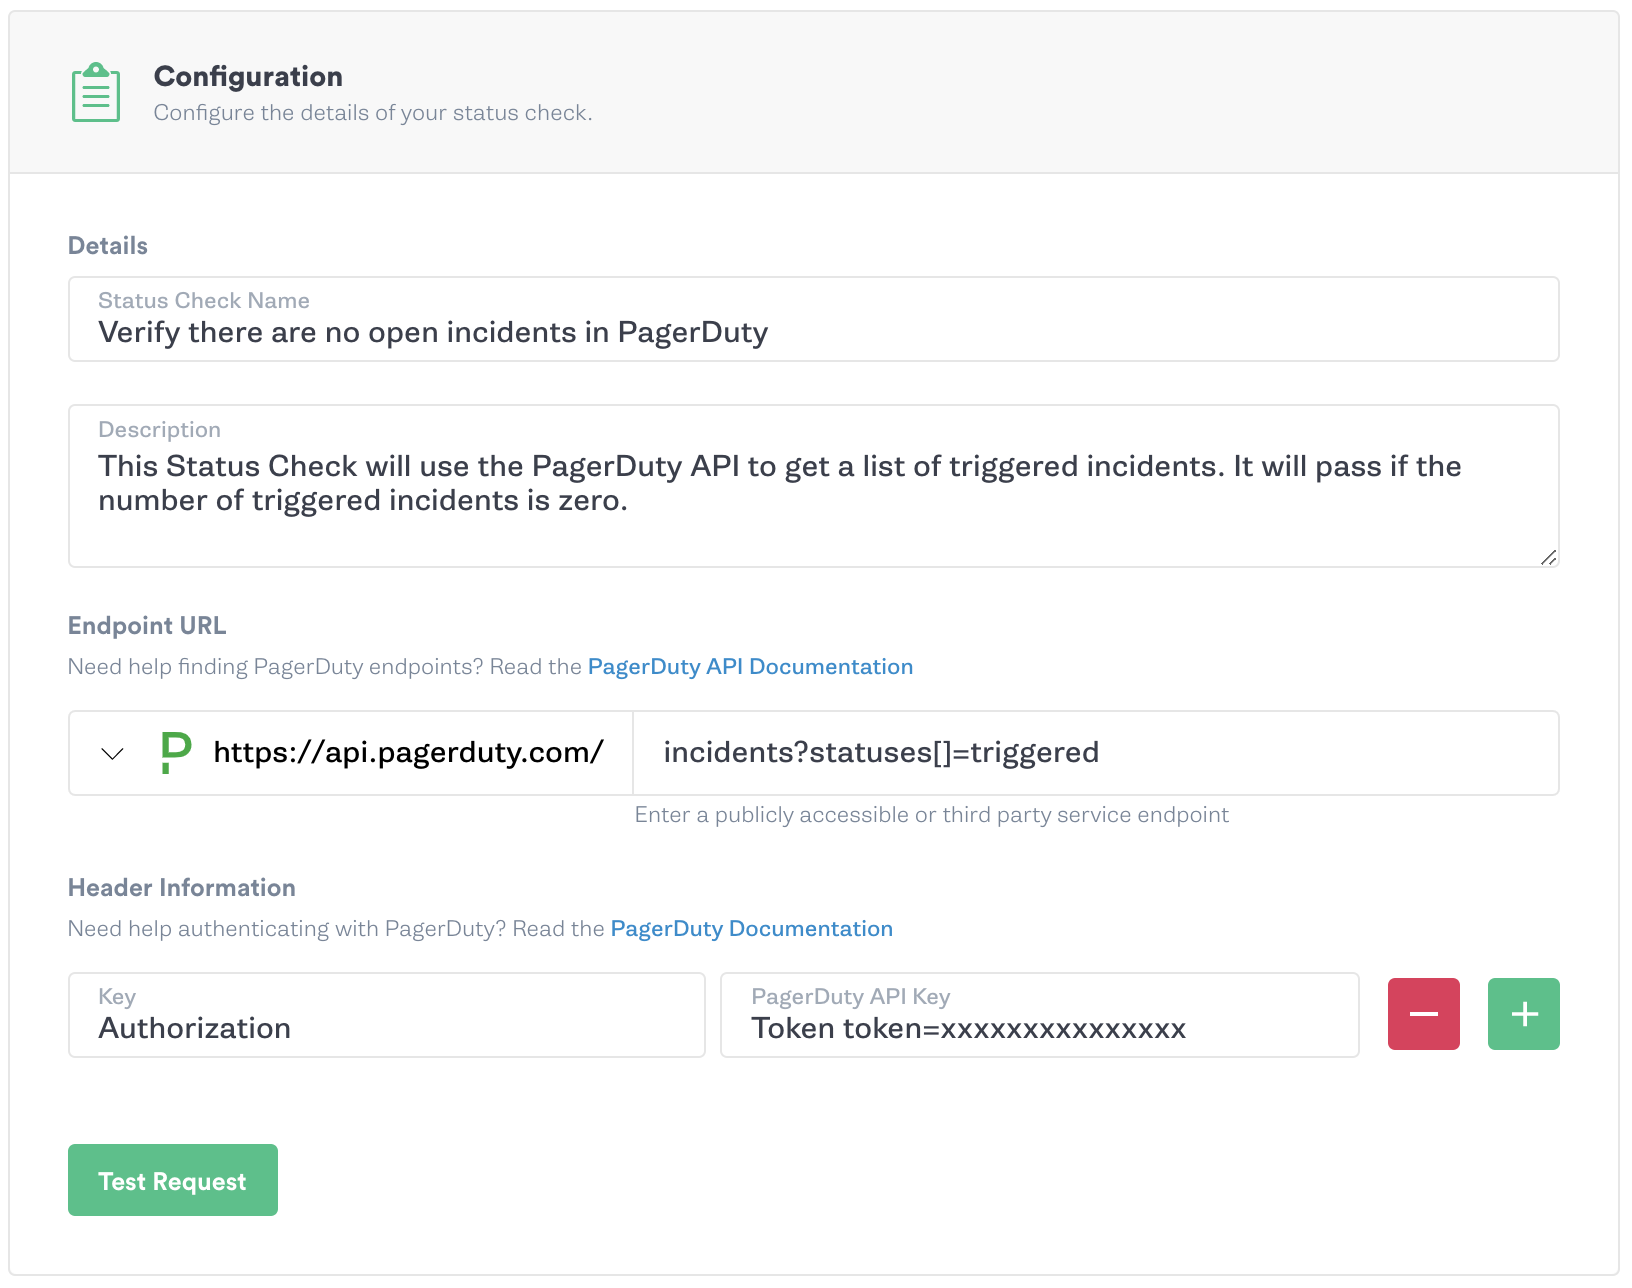
Configuration
In the “Add new Status Check to Scenario” pane, give your Status Check a name and description.
In the “Endpoint URL” field, select PagerDuty from the endpoint dropdown menu and enter <span class="code-class-custom">incidents?statuses[]=triggered</span> as the endpoint. You can find more information about the incidents API endpoint in the PagerDuty documentation.
In the “Header Information” area, enter <span class="code-class-custom">Authorization</span> for the header key and <span class="code-class-custom">Token token=YOUR_API_KEY</span> (substituting the API key you created above in Step 0).
Click the “Test Request” button to validate that your Gremlin Status Check can call the PagerDuty API.
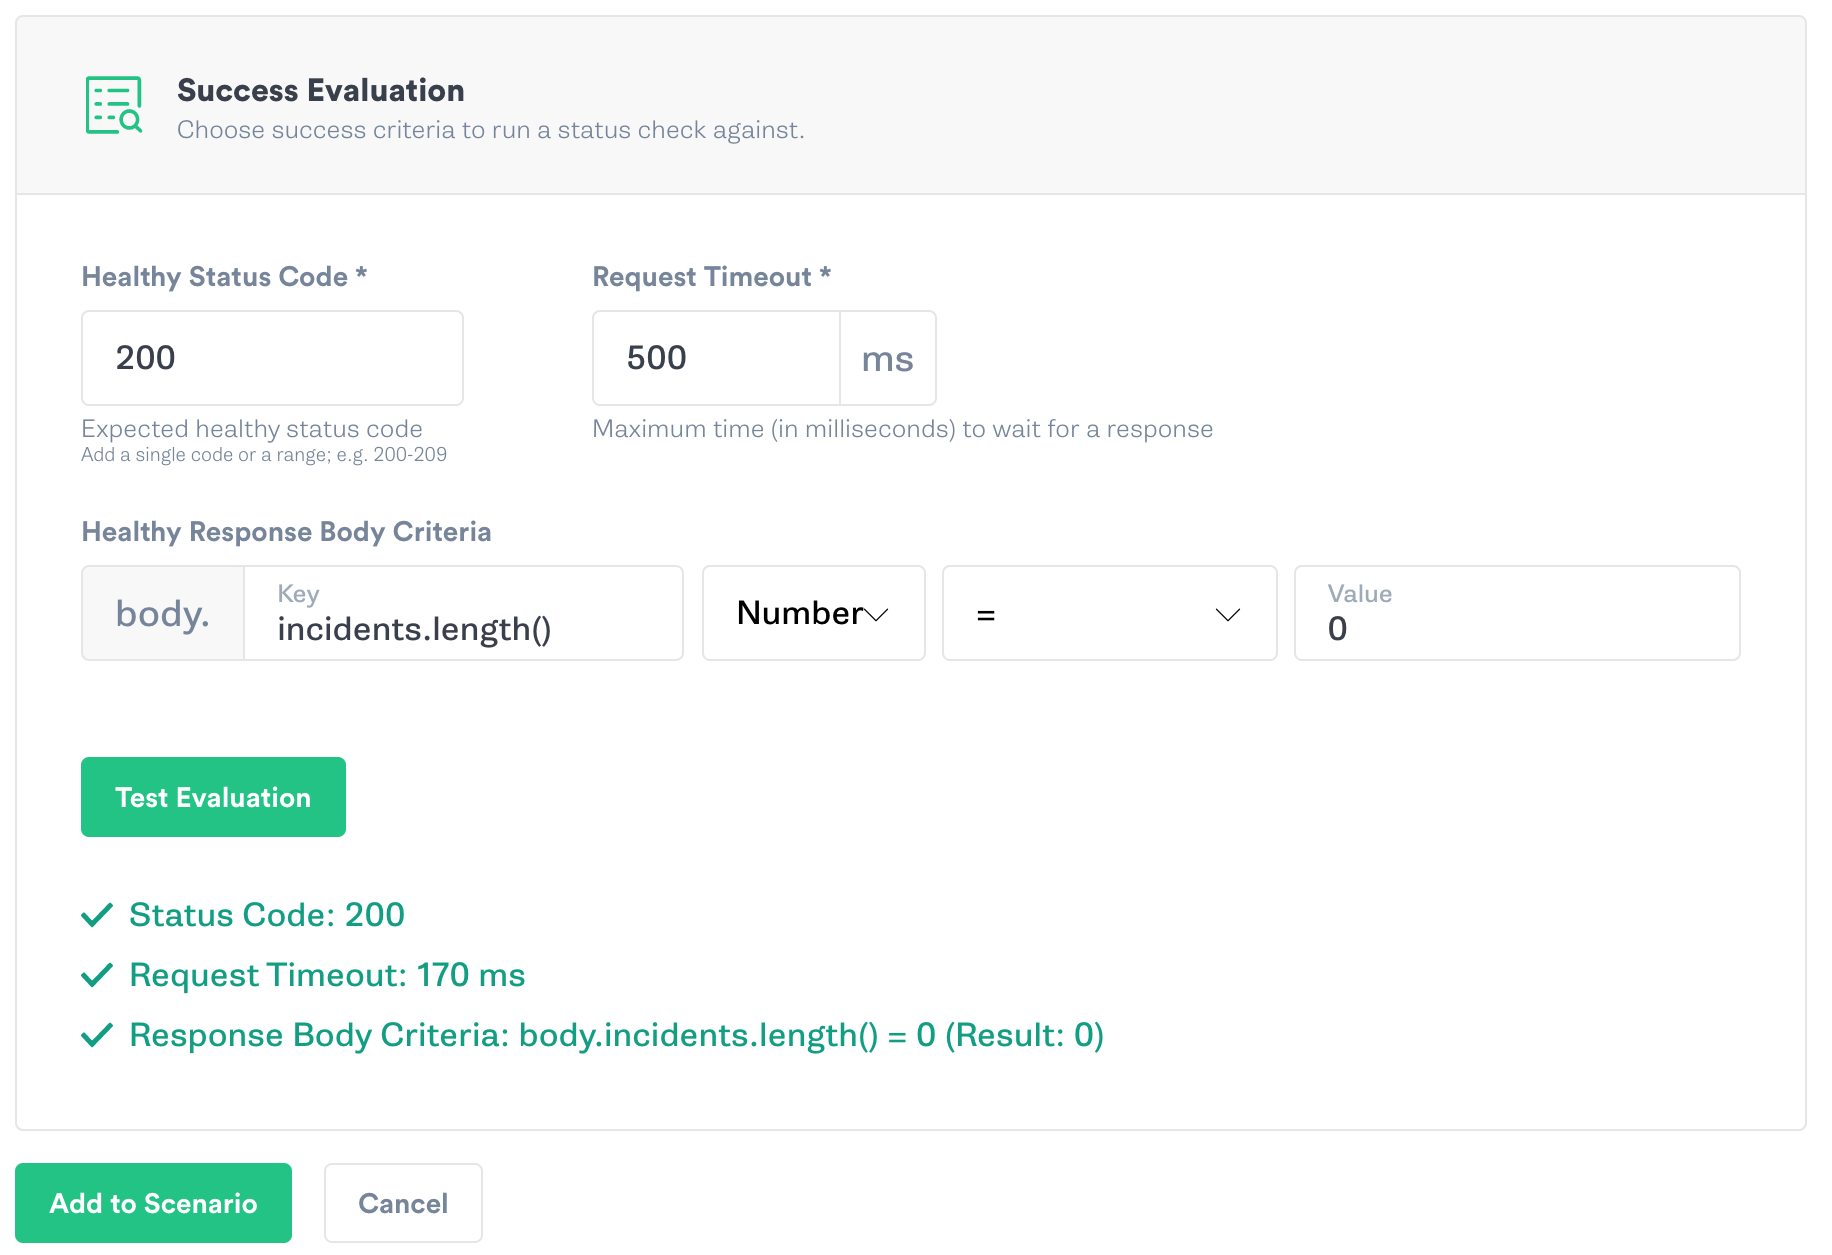
Validation
Under the “Success Evaluation” area, leave the “Healthy Status Code” default of 200 and the “Request Timeout” as 500ms.
The PagerDuty API will return a JSON object with an i<span class="code-class-custom">ncidents</span> property that is a list of any triggered incidents. We can use the length of this list as evaluation criteria. In the “Healthy Response Body Criteria” field enter <span class="code-class-custom">incidents.length()</span>. Set the data type to <span class="code-class-custom">Number</span>, the operator to <span class="code-class-custom">=</span>, and enter <span class="code-class-custom">0</span> in the “Value” field.
Click the “Test Evaluation” button to validate that your Gremlin Status Check properly evaluates the PagerDuty response data.
Finally, click “Add to Scenario” to add your completed Status Check to the Scenario.
Step 5: Adding attacks and additional Status Checks
Next we’ll add attacks to test our system’s response to disk exhaustion. Click the “Add a New Attack” button. Then click the “Hosts” tab and select your host or hosts.
If you’re just starting, we recommend testing a single host. As you become more confident in your system’s reliability, expand the blast radius to include multiple hosts.
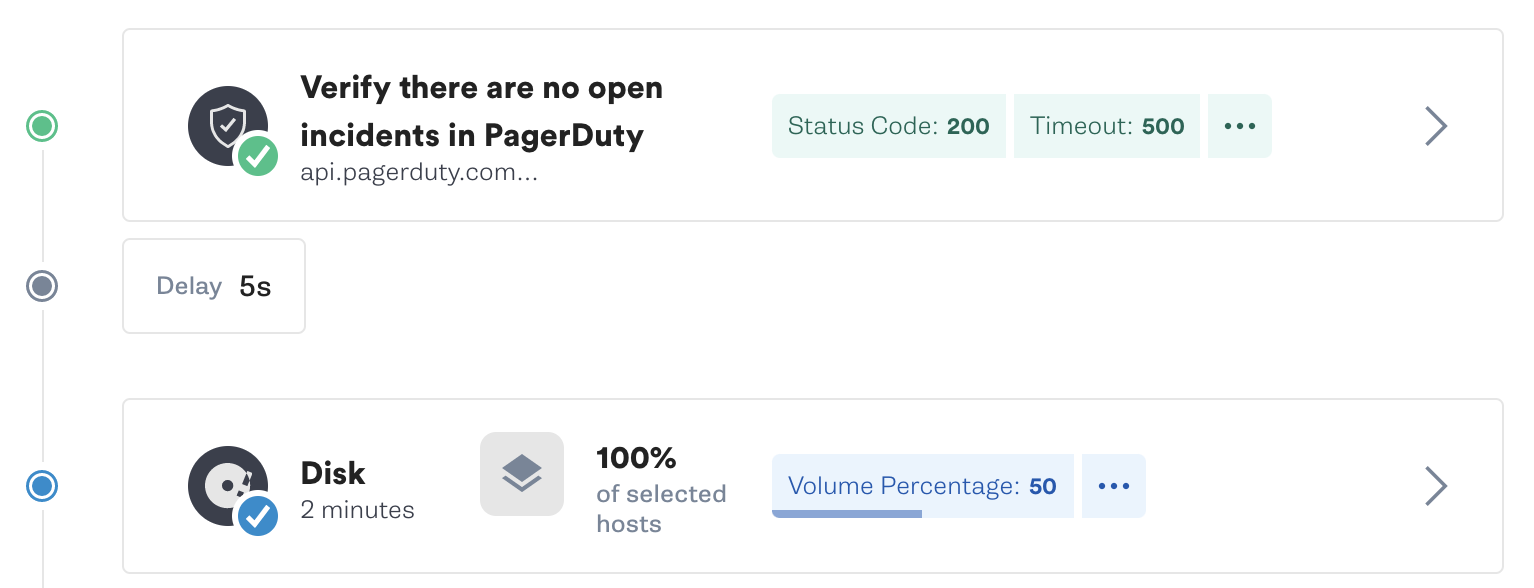
Click “Choose a Gremlin” and select the Disk Attack under the “Resource” category. Set the “Length” to <span class="code-class-custom">120</span> seconds and the “Volume Percentage” to <span class="code-class-custom">50</span> percent. Click “Add to Scenario”.
Add another Status Check to verify your system’s health by repeating the instructions in step 3.
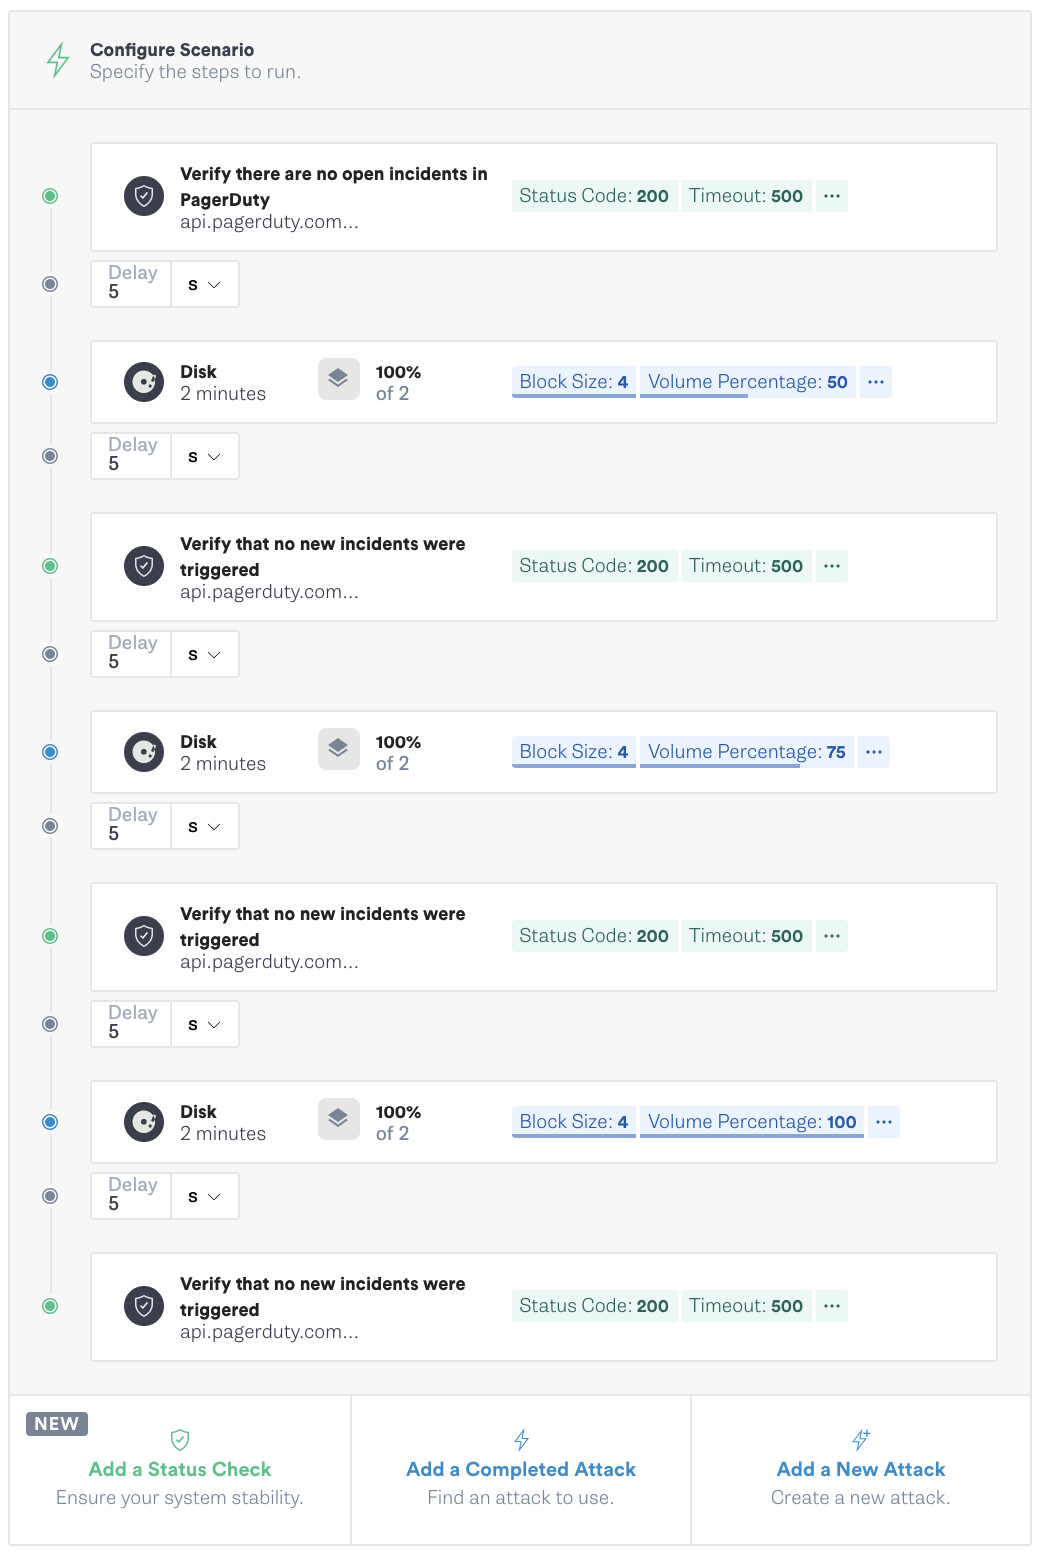
Continue by adding attacks that increase the “Volume Percentage” to <span class="code-class-custom">75</span> percent and <span class="code-class-custom">100</span> percent. Add a Status Check after each attack.
When complete, your scenario should look like the one below.
Step 6: Running the Scenario
Now that your Scenario is complete, run it by clicking the “Run Scenario” button.
Success
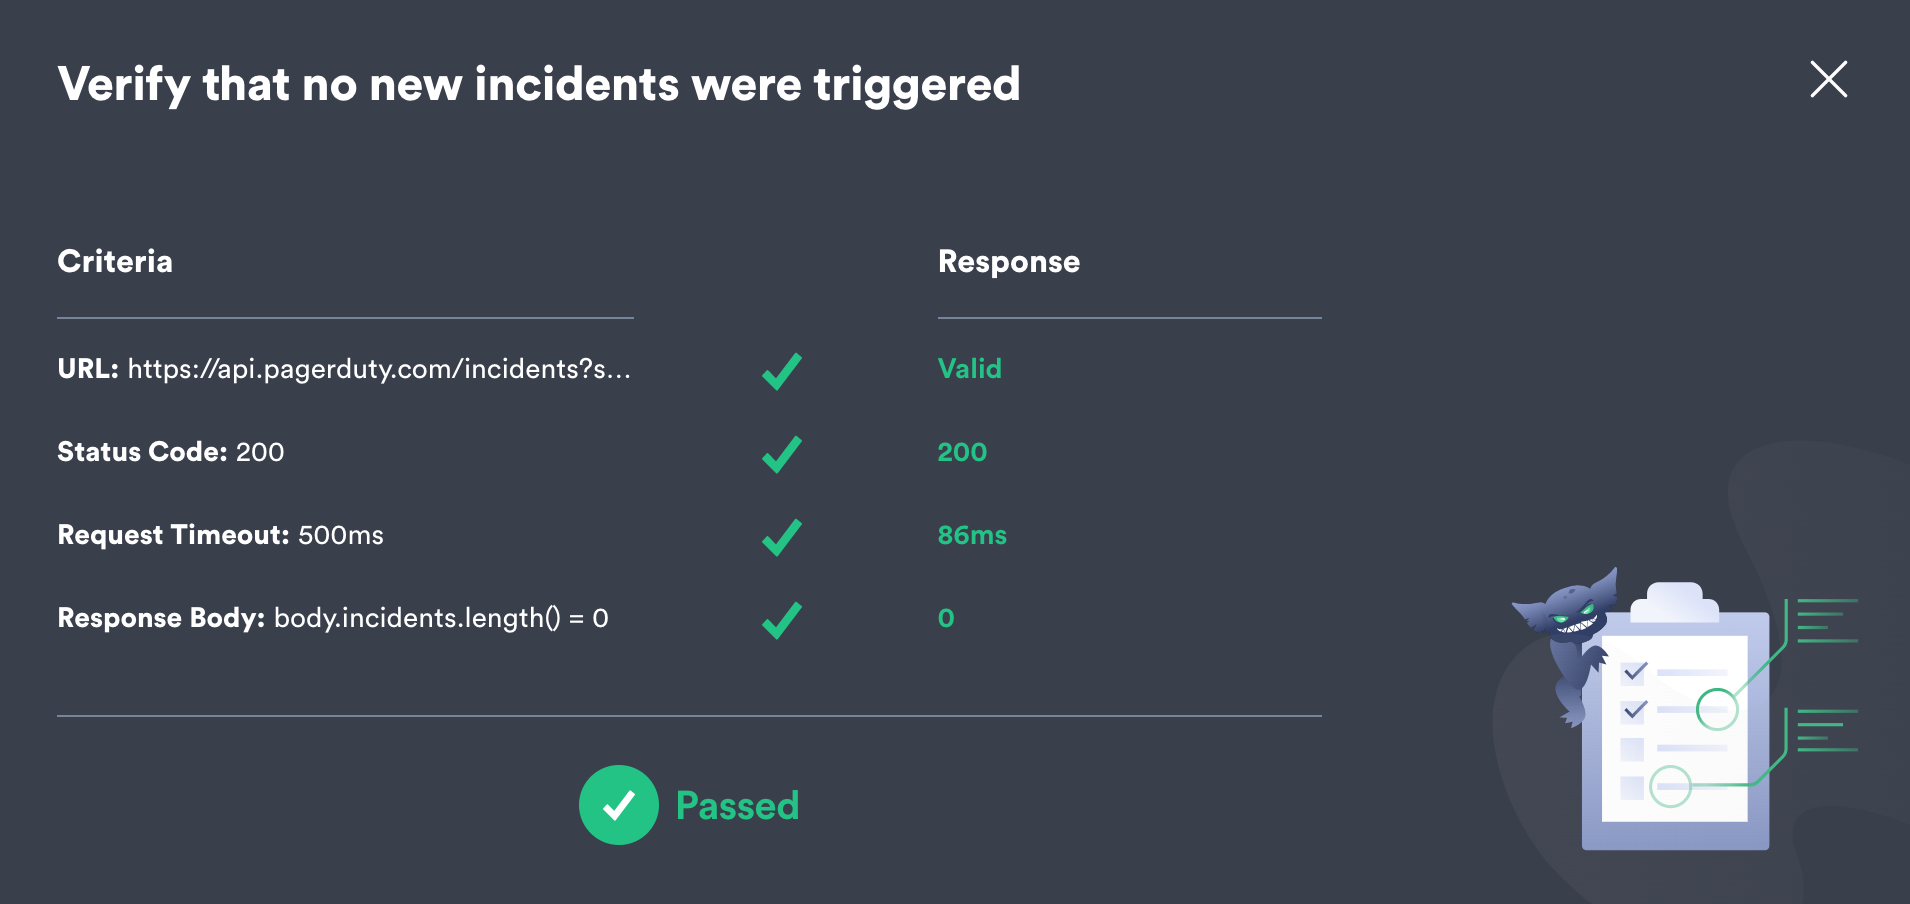
Each attack and Status Check will display the running icon as it is executed. When a Status Check completes successfully it will display a green check icon.
Click on the Status Check to view additional details about the Status Check.
Failure
If a Status Check evaluation fails, it will appear with a red X icon and immediately halt the Scenario.
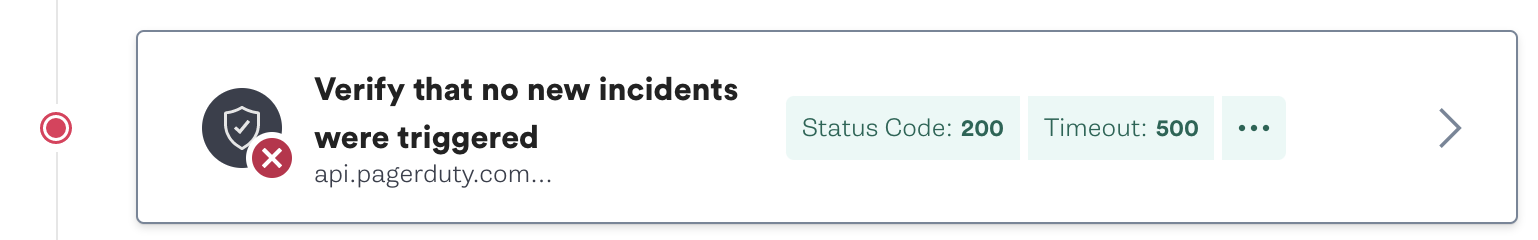
Click on the Status Check to see details about the failure.

Adding your own Status Checks
Gremlin Status Checks are flexible and it’s easy to check more than just incident statuses. You can use endpoints from monitoring tools such as Datadog, New Relic, and SignalFX to check SLO/Error Budget, system performance, and other health indicators. If your application provides metrics directly (e.g. a Prometheus<span class="code-class-custom"> /metrics</span> endpoint) you can query it directly before running Chaos Experiments on your application.
As your applications become more reliable, use scheduled Scenarios with Status Checks to regularly verify your reliability.
Make your Chaos Engineering Scenarios safer by adding Status Checks today!
Avoid downtime. Use Gremlin to turn failure into resilience.
Gremlin empowers you to proactively root out failure before it causes downtime. See how you can harness chaos to build resilient systems by requesting a demo of Gremlin.

.svg)