Chaos Engineering with Memcached and Kubernetes

.svg)
.svg)

 This is an older tutorial
Introduction
Gremlin is a simple, safe and secure service for performing Chaos Engineering experiments through a SaaS-based platform. Memcached is general-purpose distributed memory caching system. Datadog is a monitoring service for cloud-scale applications, providing monitoring of servers, databases, tools, and services, through a SaaS-based data analytics platform. Datadog provides an integration to monitor Memcached.
Chaos Engineering Hypothesis
For the purposes of this tutorial we will run Chaos Engineering experiments for Memcached on Kubernetes. We will use Gremlin to run Chaos Engineering experiments on our cluster where run an IO attack to increase the number of reads. This will give us confidence in the reliability and resiliency of our memcached cluster. Additional experiments that are recommended to run include shutting down Memcached instances and pods and insuring this does not take down your database/storage layer.
Prerequisites
To complete this tutorial you will need the following:
- 4 cloud infrastructure hosts running Ubuntu 16.04 with 4GM RAM and private networking enabled
- A Datadog account (sign up here)
- A Gremlin account (request a free trial)
You will need to install the following on each of your 4 cloud infrastructure hosts. This will enable you to run your Chaos Engineering experiments.
- Memcached
- Kubernetes
- Helm
- Docker
- Gremlin
- Datadog
Overview
This tutorial will walk you through the required steps to run the Memcached IO Chaos Engineering experiment.
- Step 1 - Creating a Kubernetes cluster with 3 nodes
- Step 2 - Installing Memcached
- Step 3 - Installing Helm
- Step 4 - Installing Gremlin
- Step 5 - Installing Datadog
- Step 6 - Performing Chaos Engineering experiments on Memcached
- Step 7 - Installing mcrouter
- Step 8 - Performing Chaos Engineering experiments on mcrouter
Step 1 - Creating a Kubernetes cluster with 3 nodes
We will start with creating three Ubuntu 16.04 servers. This will give you four servers to configure.Create 4 hosts and call them kube-01, kube-02, kube-03 and kube-04. You need to be running hosts with a minimum of 4GB RAM.
Set your hostnames for your servers as follows:
- Server 1 - Hostname: k8-01
- Server 2 - Hostname: k8-02
- Server 3 - Hostname: k8-03
- Server 4 - Hostname: k8-04
Kubernetes will need to assign specialized roles to each server. We will setup one server to act as the master:
- k8-01 - role: master
- k8-02 - role: node
- k8-03 - role: node
- k8-04 - role: node
Set up each server in the cluster to run Kubernetes
On each of the three Ubuntu 16.04 servers run the following commands as root:
Setup the Kubernetes Master
On the kube-01 node run the following command:
To start using your cluster, you need to run the following as a regular user:
Your Kubernetes master has initialized successfully!
Join your nodes to your Kubernetes cluster
You can now join any number of machines by running the kubeadm join command on each node as root. This command will be created for you as displayed in your terminal for you to copy and run.An example of what this looks like is below:
When you join your kube-02 and kube-01 nodes you will see the following on the node:
To check that all nodes are now joined to the master run the following command on the Kubernetes master kube-01:
Setup a Kubernetes Add-On For Networking Features And Policy
Kubernetes Add-Ons are pods and services that implement cluster features. Pods extend the functionality of Kubernetes. You can install addons for a range of cluster features including Networking and Visualization.
We are going to install the Weave Net Add-On on the kube-01 master which provides networking and network policy. It will continue working on both sides of a network partition and does not require an external database.
Next, you will deploy a pod network to the cluster. The options are listed at: https://kubernetes.io/docs/concepts/cluster-administration/addons/
Installing the Weave Net Add-On
Get the Weave Net yaml:
Inspect the yaml contents:
On the kube-01 Kubernetes master node run the following commands:
The result will look like this:
It may take a minute or two for DNS to be ready. Continue to check for DNS to be ready before moving on by running the following command:
The successful result will look like this, every container should be running:
Congratulations, now your Kubernetes cluster running on Ubuntu 16.04 is up and ready for you to deploy a microservices application.
Step 2 - Deploying Memcached
First download the helm binary on your Kubernetes master, kube-01:
Create a helm directory and unzip the helm binary to your local system:
Add the helm binary's directory to your PATH environment variable:
Create a service account with the cluster admin role for Tiller, the Helm server:
Initialize Tiller in your cluster, and update information of available charts:
You will need to wait until the tiller deploy pod is ready before proceeding. Use the following command to check for when the tiller deploy pod is ready:
You will see the following output:
Check the logs for the tiller pod, run the following command replacing _tiller-deploy-9cfccbbcf-kflph _with your pod name:
You will see the following output:
Install a new Memcached Helm chart release with three replicas, one for each node:
You will see the folllowing output:
Execute the following command to see the running pods:
You should see the following:
Discovering Memcached service endpoints
First, run the following command to retrieve the endpoints' IP addresses:
The output should be similar to the following:
Test the deployment by opening a telnet session with one of the running Memcached servers on port 11211:
At the telnet prompt, run these commands using the Memcached ASCII protocol:
The resulting output is shown here in bold:
Implementing the service discovery logic
Next we will implement service discovery logic with Python. Run the following command to create a python pod in your Kubernetes cluster:
Install the pymemcached library:
You will see the following output
Start a Python interactive console by running the following command:
In the Python console, run these commands:
You will see the following output:
Exit the Python console:
Exit the pod's shell session by pressing Control+D.You will see the following:
Step 4 - Installing Gremlin for Chaos Engineering experiments
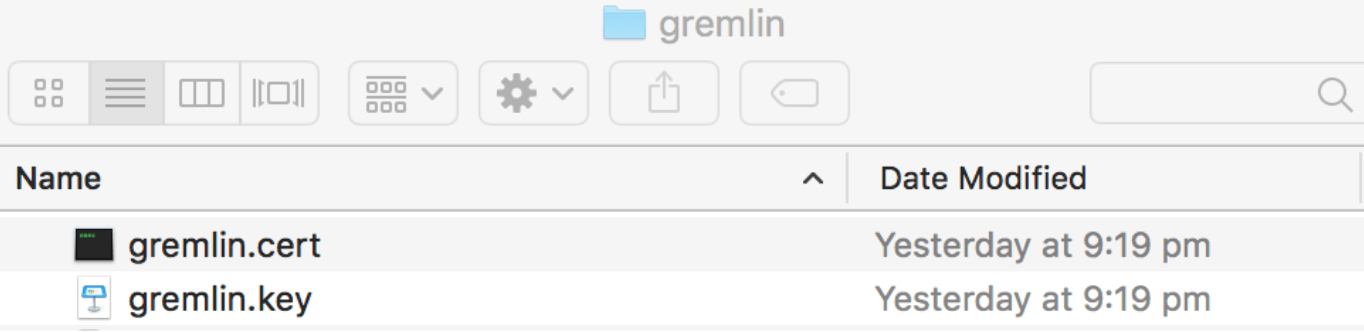
After you have created your Gremlin account you will need to find your Gremlin Daemon credentials. Login to the Gremlin App using your Company name and sign-on credentials. These were emailed to you when you signed up to start using Gremlin. Navigate to Company Teams Settings and click on your Team. Click the blue Download button to get your Team Certificate. The downloaded certificate.zip contains both a public-key certificate and a matching private key.
Unzip the certificate.zip and save it to your gremlin folder on your desktop. Rename your certificate and key files to gremlin.cert and gremlin.key.
Next create your secret as follows:
Installation with Helm
The simplest way to install the Gremlin agent on your Kubernetes cluster is to use Helm. If you do not already have Helm installed, go here to get started. Once Helm is installed and configured, the next steps are to add the Gremlin repo and install the agent.
To run the Helm install, you will need your Gremlin Team ID. It can be found in the Gremlin app on the Team Settings page, where you downloaded your certs earlier. Click on the name of your team in the list. The ID you’re looking for is found under Configuration as Team ID.
Export your Team ID as an environment variable:
Replace <span class="code-class-custom">YOUR_TEAM_ID</span> with the Team ID you obtained from the Gremlin UI.
Next, export your cluster ID, which is just a friendly name for your Kubernetes cluster. It can be whatever you want.
Now add the Gremlin Helm repo, and install Gremlin:
For Helm 3
For Helm 2
For more information on the Gremlin Helm chart, including more configuration options, check out the chart on Github.
Step 5 - Installing the Datadog agent using a Kubernetes Daemonset
To install Datadog in a Kubernetes pod you can use the Datadog Kubernetes easy one-step install. It will take a few minutes for Datadog to spin up the Datadog container, collect metrics on your existing containers and display them in the Datadog App.
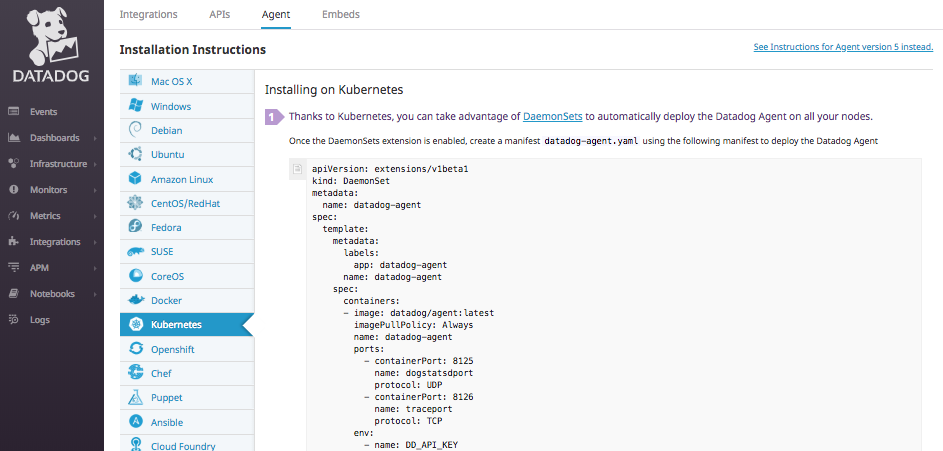
You will simple copy the Kubernetes DaemonSet, save it as datadog-agent.yaml and then run the following command:
Next install the Memcached Datadog Integration by clicking Install Integration:
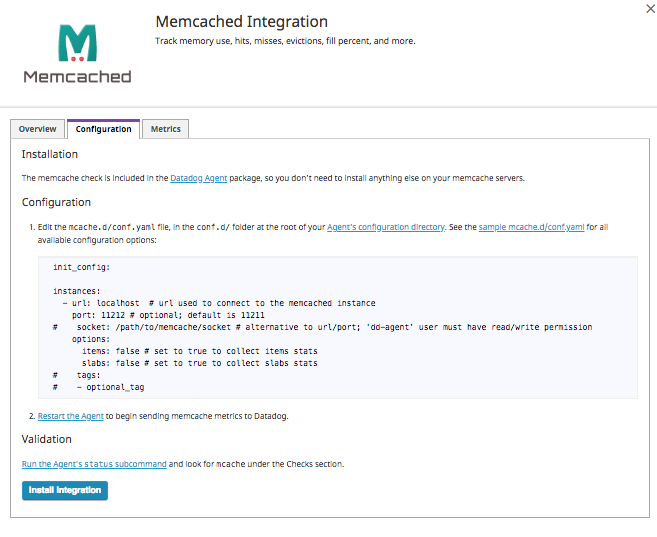
You will see that following notification in your event stream:

You can read more about setting up Memcached monitoring in Datadog.
Step 5 - Chaos Engineering experiments for Memcached with Gremlin
We will use the Gremlin Web App to create an IO attack on the memcached pods. The purpose of this experiment will be to ensure that we are able to identify an increase in IO for our memcached cluster. We will also use this attack to understand how the pod and server handles an increase in IO.
First click Attacks in the left navigation bar and then New Attack. Then click the Kubernetes tab to view all the available Kubernetes objects that you can run Chaos Engineering experiments on.
Scroll down and expand the StatefulSets section, and select memcached.
Next, select the Resource Gremlin and then choose IO. Scroll down and click the Unleash Gremlin button.
You can now monitor your IO attack using Datadog.

Step 9 - Additional Chaos Engineering experiments to run on Memcached
There are many Chaos Engineering experiments you could possibly run on your Memcached infrastructure:
- Shutdown Gremlin - will shutting down a memcached node cause unexpected issues?
- Latency & Packet Loss Gremlins - will they impact the ability to use the Memcache API endpoints?
- Disk Gremlin - will filling up the disk crash the host?
Conclusion
This tutorial has explored how to install Memcached and Gremlin with Kubernetes for your Chaos Engineering experiments. We then ran a CPU Chaos Engineering experiment on the Memcached using the Gremlin CPU attack.
Share your results and swap best practices with 5,000+ engineers practicing Chaos Engineering in the Chaos Engineering Slack.
Join the Chaos Engineering Slack
Connect with 5,000+ engineers who are building more reliable systems with Chaos Engineering.
Join the Chaos Engineering Slack
Connect with 5,000+ engineers who are building more reliable systems with Chaos Engineering.
Avoid downtime. Use Gremlin to turn failure into resilience.
Gremlin empowers you to proactively root out failure before it causes downtime. See how you can harness chaos to build resilient systems by requesting a demo of Gremlin.

.svg)