Chaos Engineering with Cassandra


.svg)
.svg)

 This is an older tutorial
Introduction
Gremlin is a simple, safe and secure service for performing Chaos Engineering experiments through a SaaS-based platform. Cassandra is Apache’s database that is scalable and high availability without compromising performance. It’s open source, distributed and decentralized/distributed storage system.
This tutorial will teach you how to do Chaos Engineering on Cassandra Using Gremlin.
Overview
This tutorial will show you how to use Gremlin and Cassandra
- Step 1 - Install Gremlin
- Step 2 - Install Cassandra
- Step 3 - Add data to Cassandra using cqlsh
- Step 4 - Install iostat
- Step 5 - Run a Disk Resource Chaos Engineering Experiment
- Step 6 - Run a IO Chaos Engineering Experiment
- Step 7 - Expanding the BlastRadius of an IO Chaos Engineering Experiment
Prerequisites
Before you begin this tutorial, you’ll need the following:
- A Gremlin account (request a free trial here)
- Ubuntu 18.04 host
Step 1 - Install Gremlin
First, ssh into your host and add the gremlin repo:
Import the GPG key:
Install the Gremlin agent:
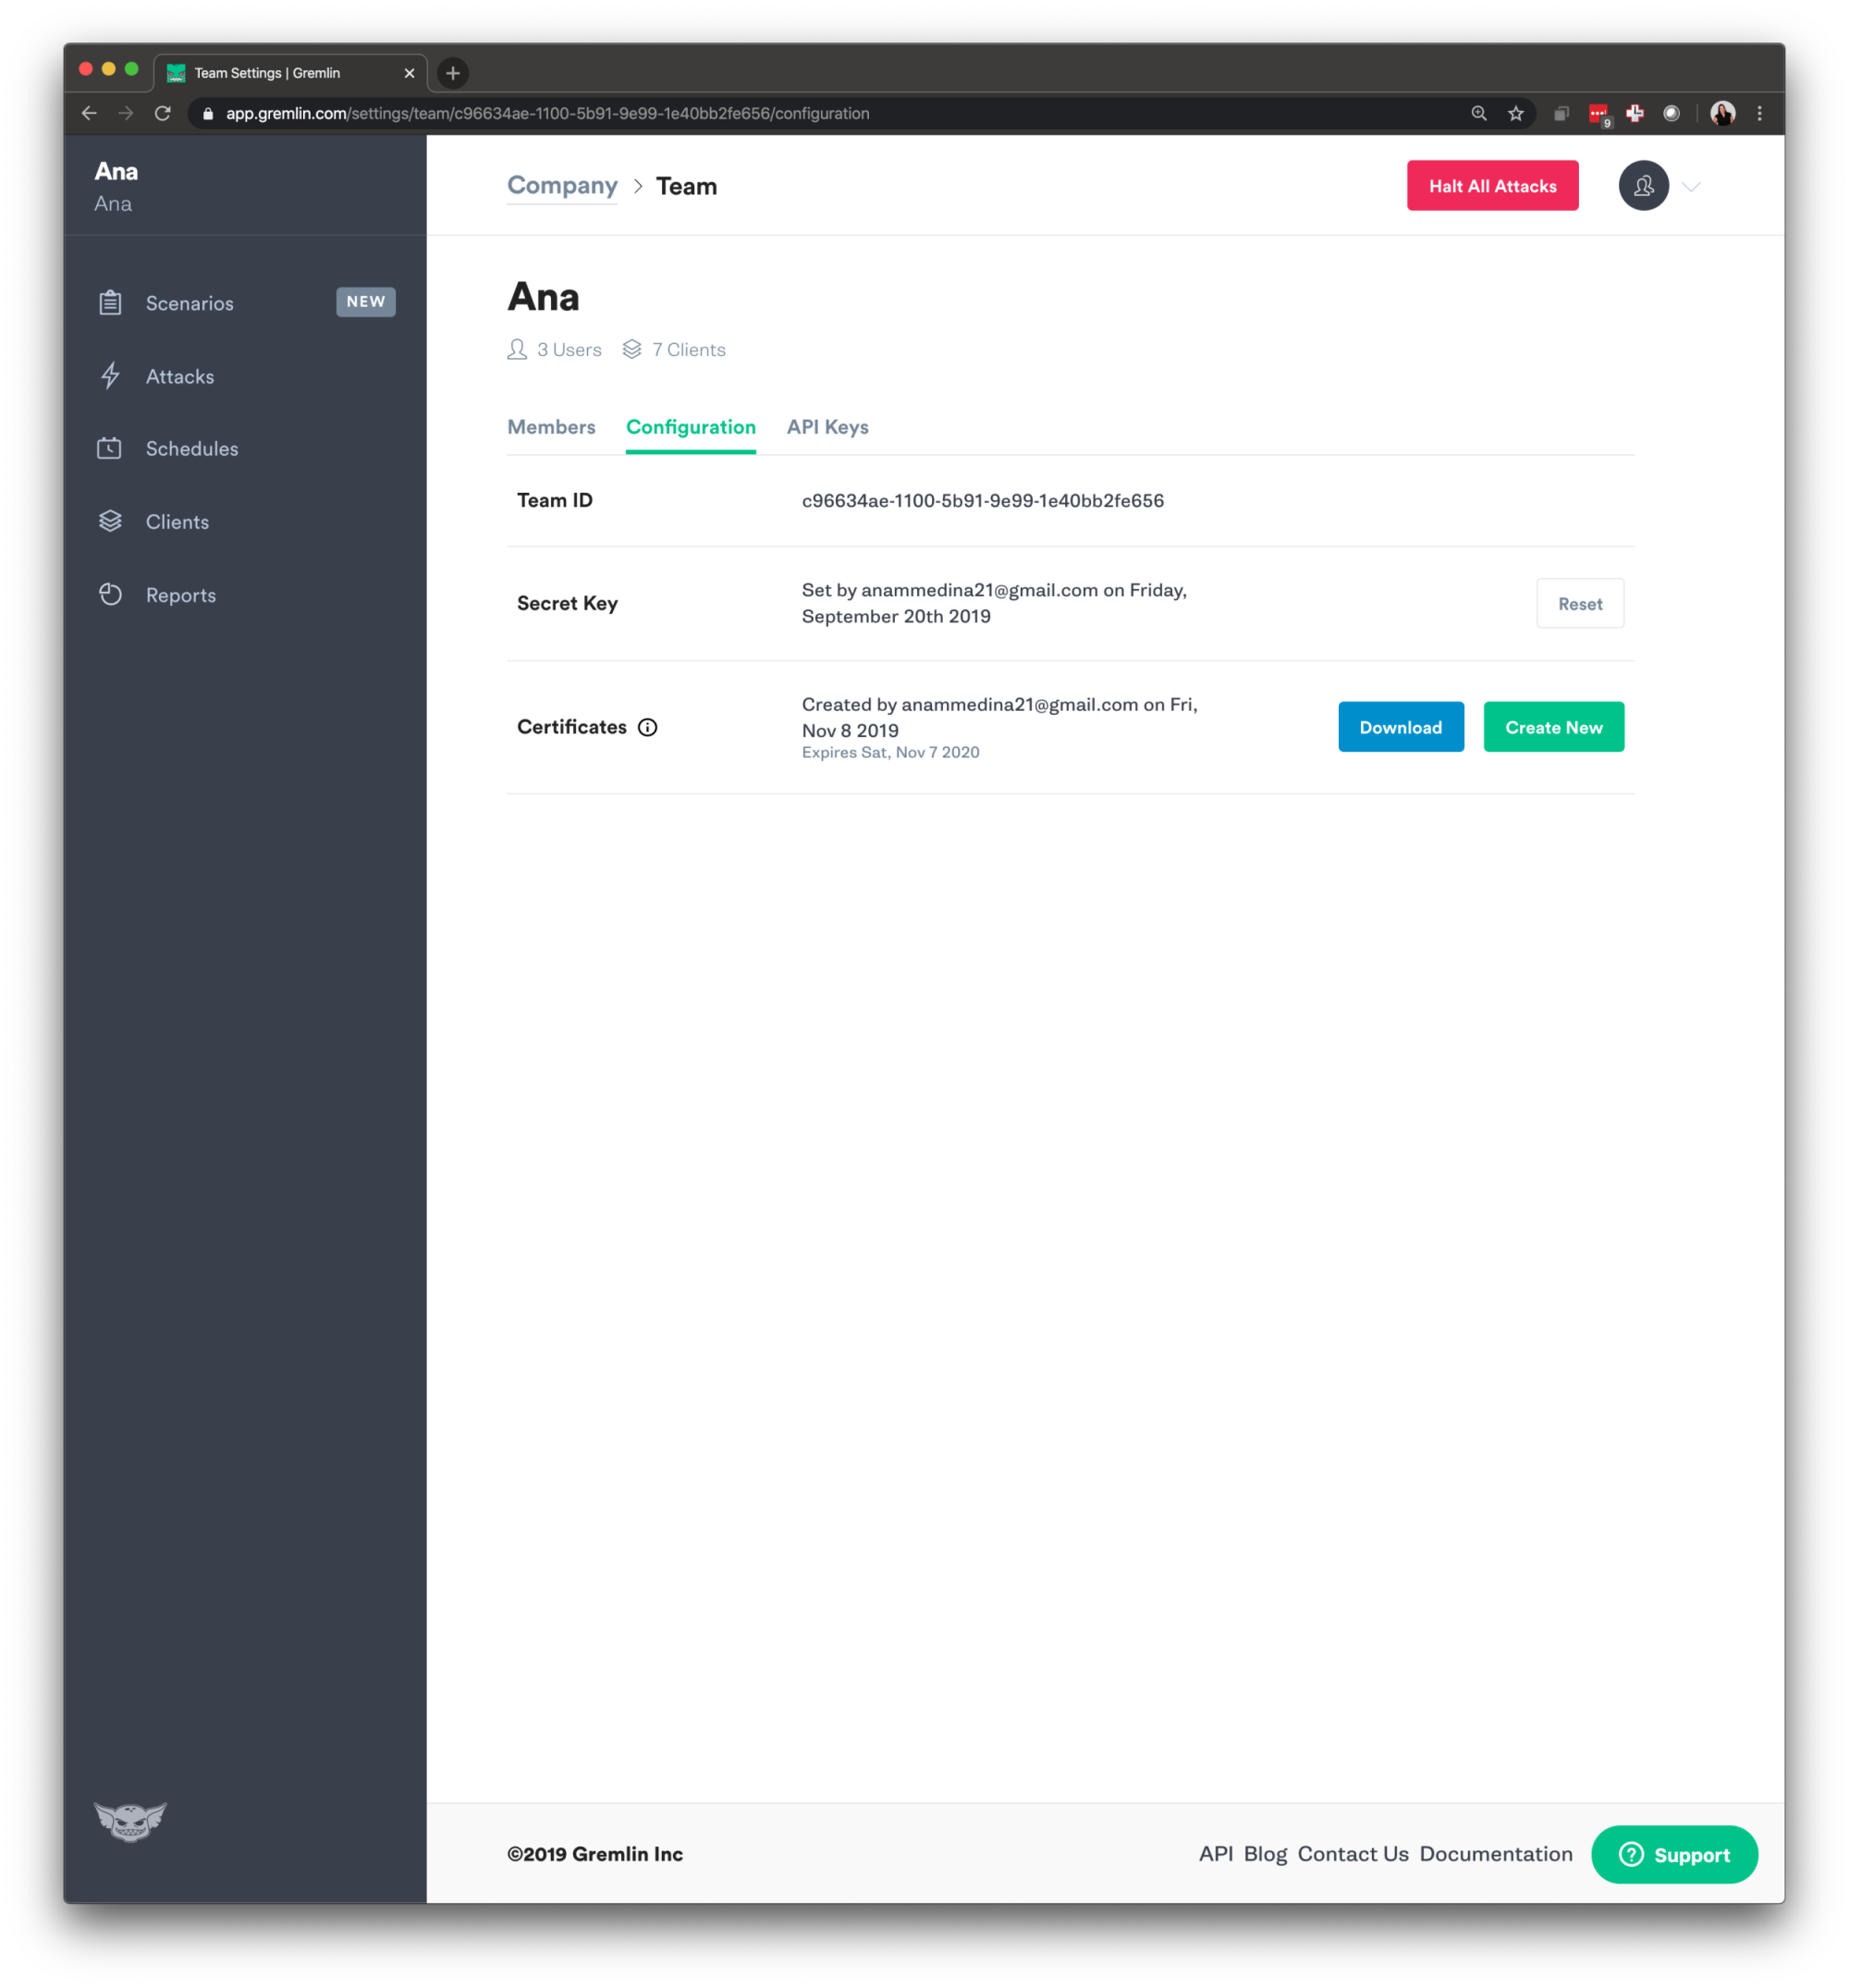
First, make sure you have a Gremlin account (sign up here). Then, we will grab the credentials needed to authenticate the agent we just installed. Log in to the Gremlin App using your Company name and sign-on credentials. (These were emailed to you when you signed up to start using Gremlin.) Click on the right corner circular avatar, selecting “Company Settings”.

Then, select the team you need. The ID you’re looking for is found under Configuration as “Team ID” click on your Team. Make a note of your Gremlin Secret and Gremlin Team ID.
Now, on your host, we will initialize Gremlin and follow the prompts.
Use the credentials you have saved from the last step.
Step 2 - Install Cassandra
In this step, you’ll be installing Cassandra onto your host. First, Install add the Apache repository of Cassandra:
Add the Apache Cassandra repository keys:
Update the repositories:
Install Cassandra:
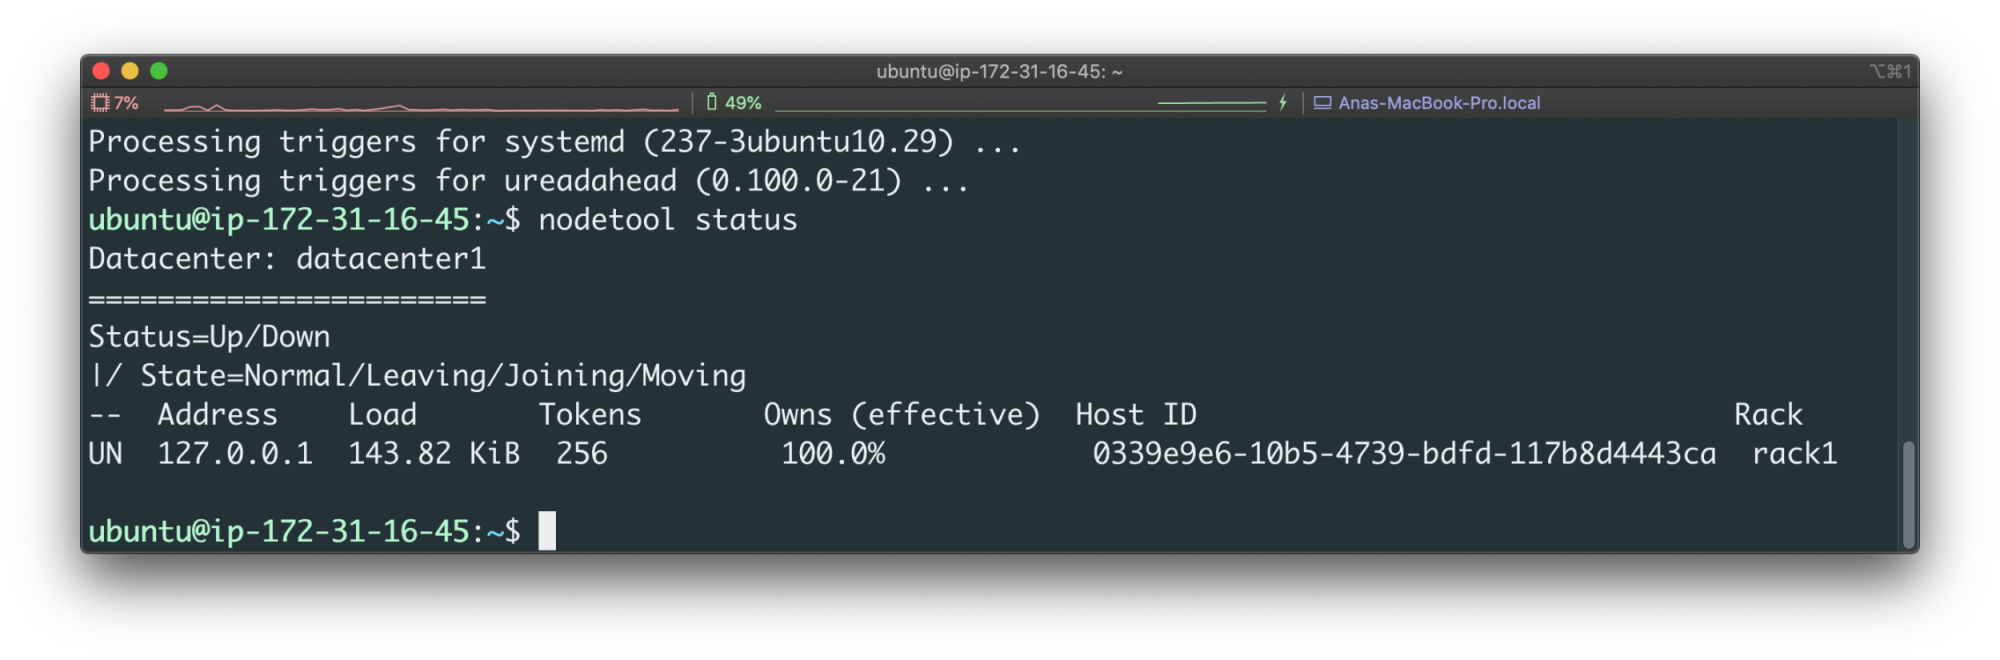
Verify it has been setup properly and has been started:
Your output should look similar to this:
Step 3 - Add data to Cassandra using cqlsh
In this step, you’ll add some data to Cassandra using Cassandra Query Language. For this tutorial we are going to be the cli tool, <span class="code-class-custom">cqlsh</span>. By default, Cassandra sets up a “Test Cluster” for us.
Start the cli:
You can learn about the default configuration via:
We are going to create our first Keyspace. In Cassandra a Keyspace is a namespace that defines data replication on nodes. We are going to be using SimpleStrategy for replication. Read more about it and other options here.
Verify the creation:
Select the newly created keyspace:
Create a table called user:
Verify the table has been created:
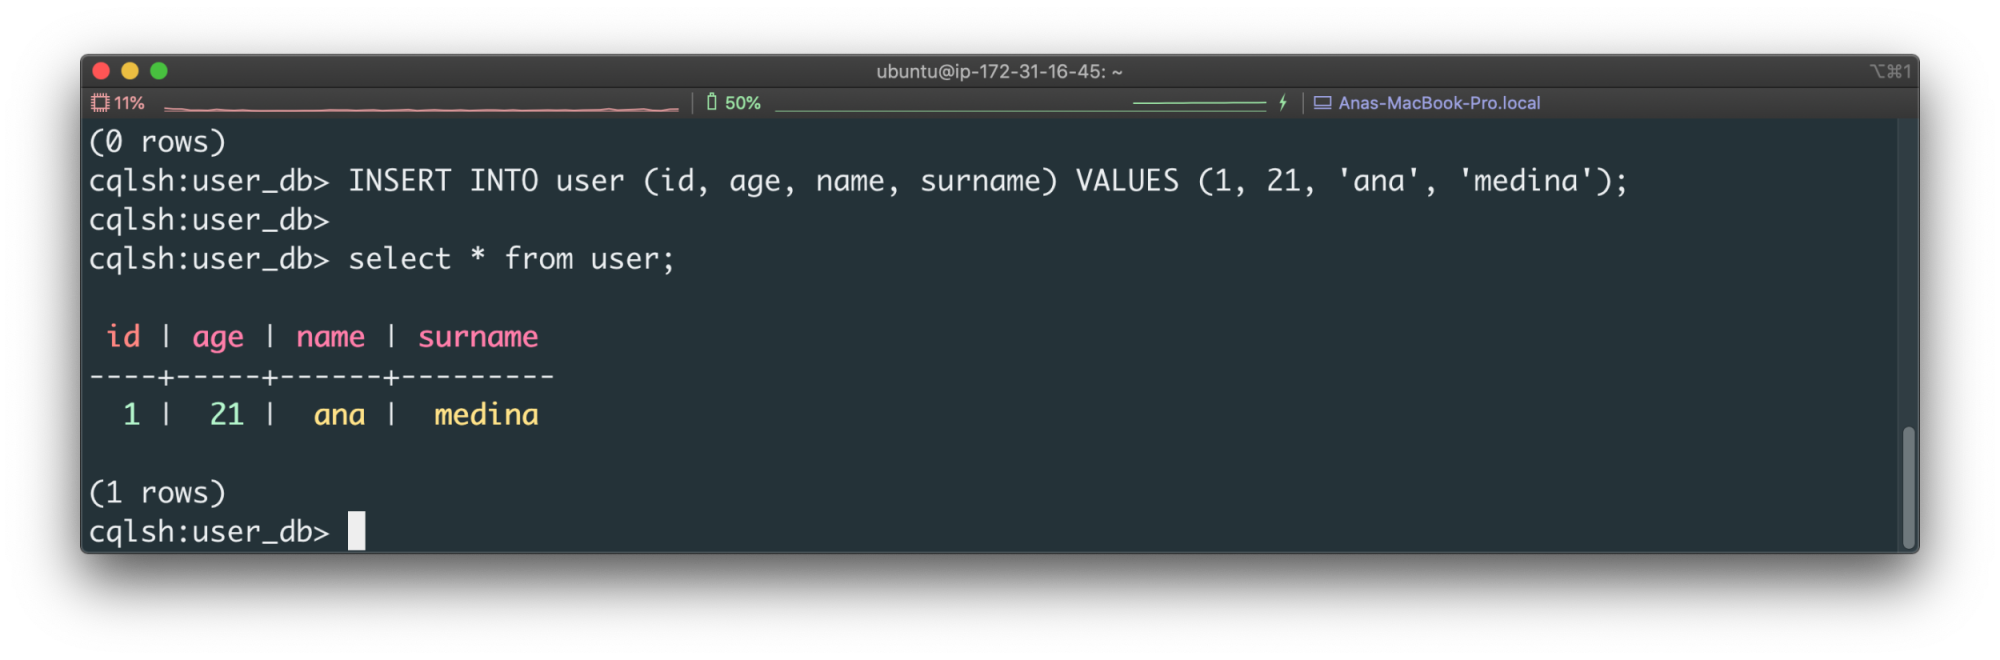
Now let’s add some data into this table:
Verify the information table has been created:
We should see a table that looks like this:
Step 4 - Install iostat
To exit from <span class="code-class-custom">cqlsh</span>, just type <span class="code-class-custom">exit</span>. We will be now set up <span class="code-class-custom">iostat</span>, this is a linux command used for monitoring system I/O device loading, this is included when you install systat, a performance monitoring tool for Linux. On your host install systat:
Step 5- Run a Disk Resource Chaos Engineering Experiment
For our first Chaos Engineering experiment we are going to be running a Disk Chaos Engineering experiment. This will be consuming disk space. Our hypothesis is, “When we consume 100% of our disk, we won’t be able to add entries to Cassandra.”
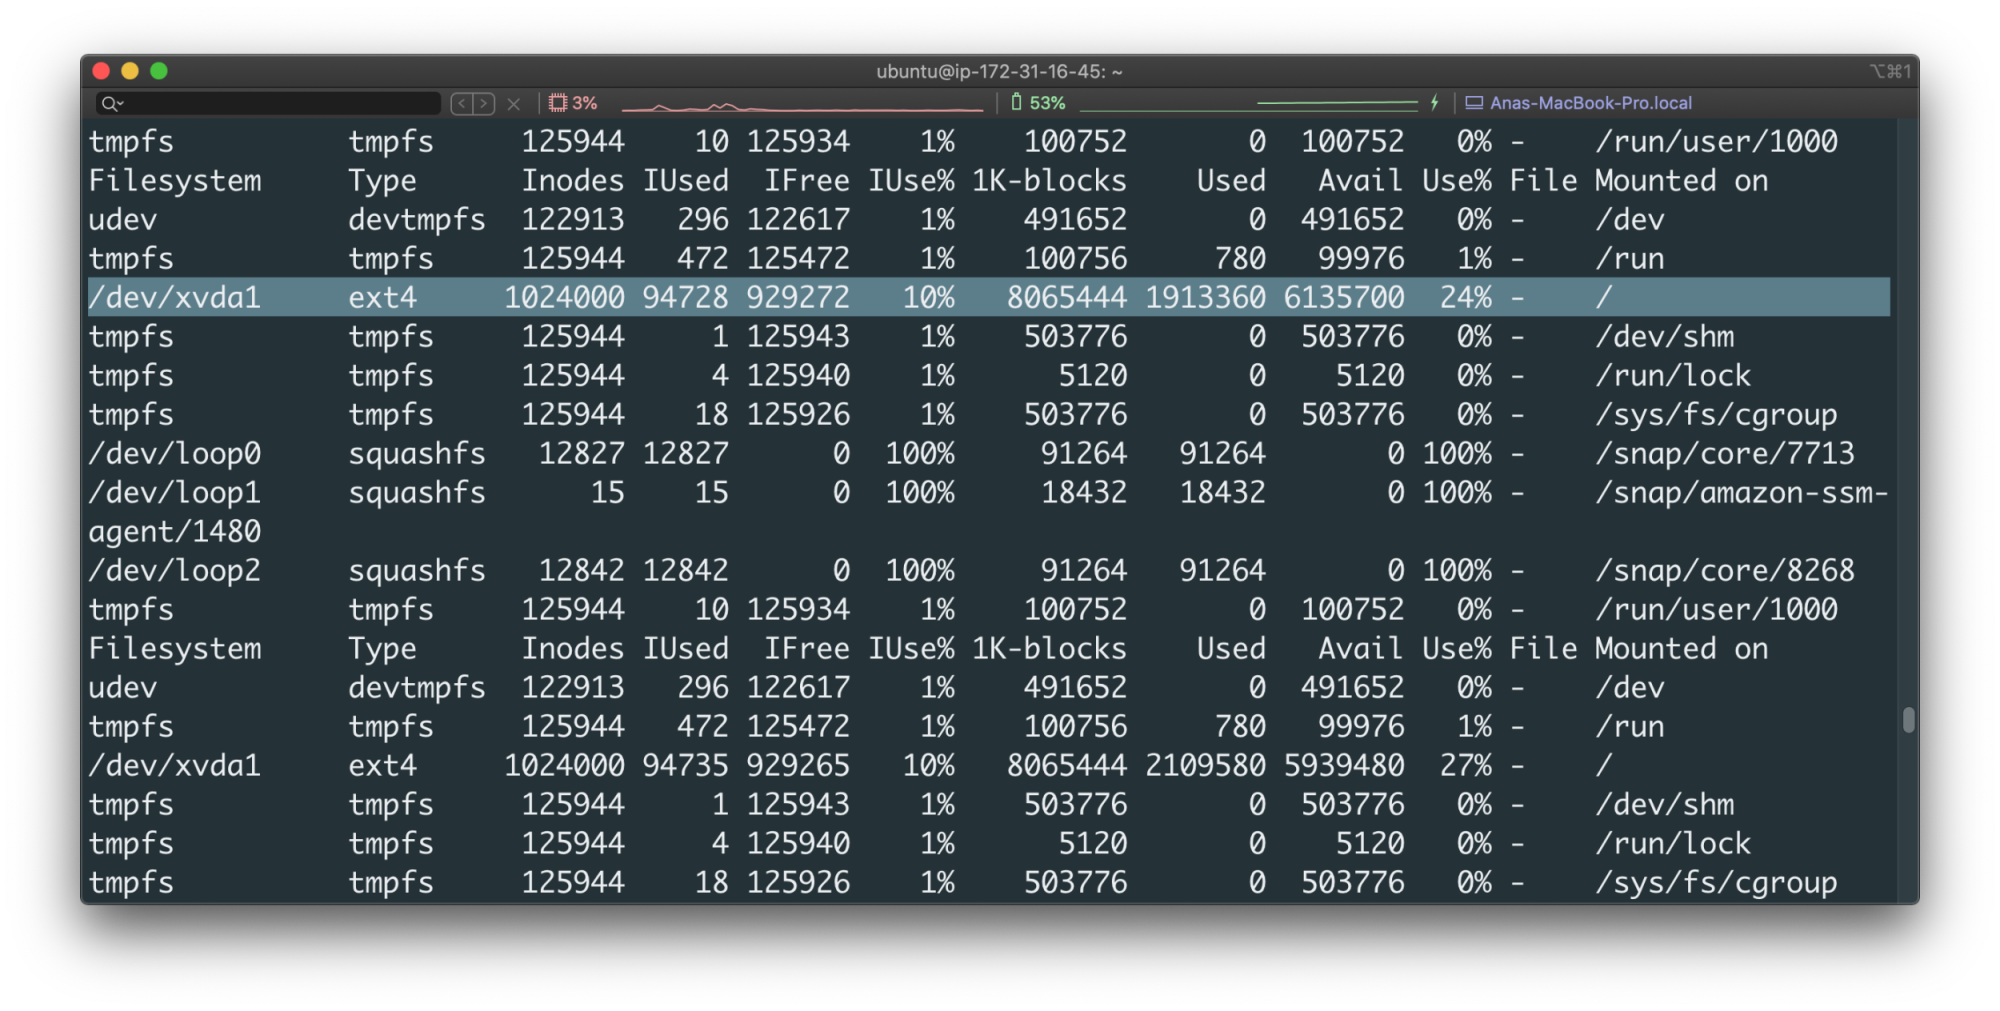
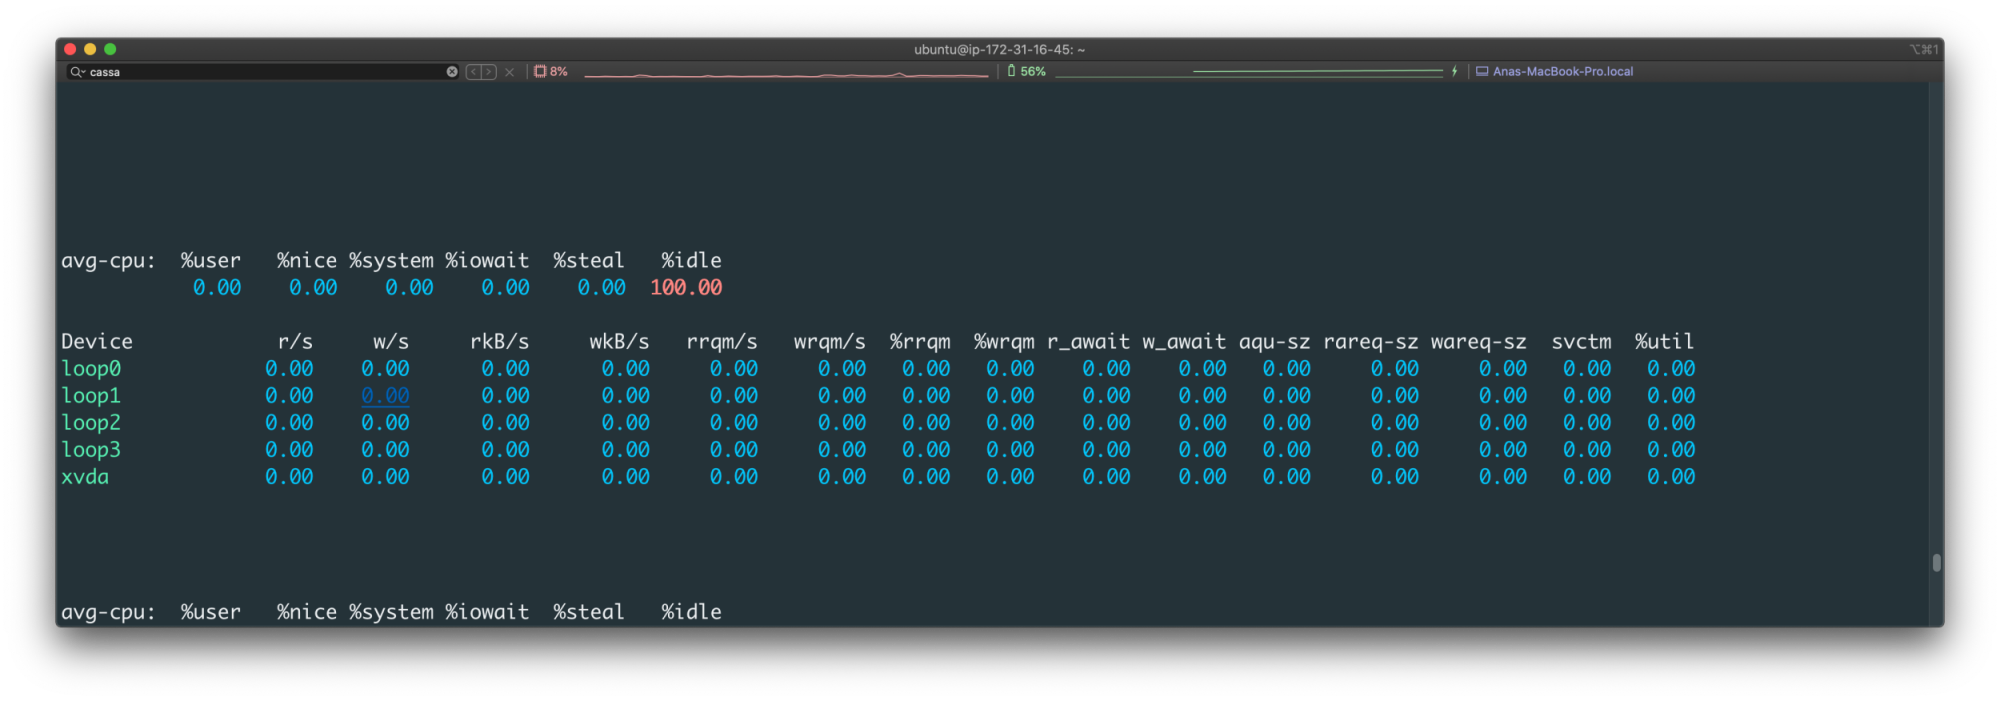
For monitoring this experiment we are going to run:
What we see below is the steady state of the application:
Going back to the Gremlin UI, select Attacks from the menu on the left and press the green “New Attack” button. We will be choosing the host we installed Gremlin on:
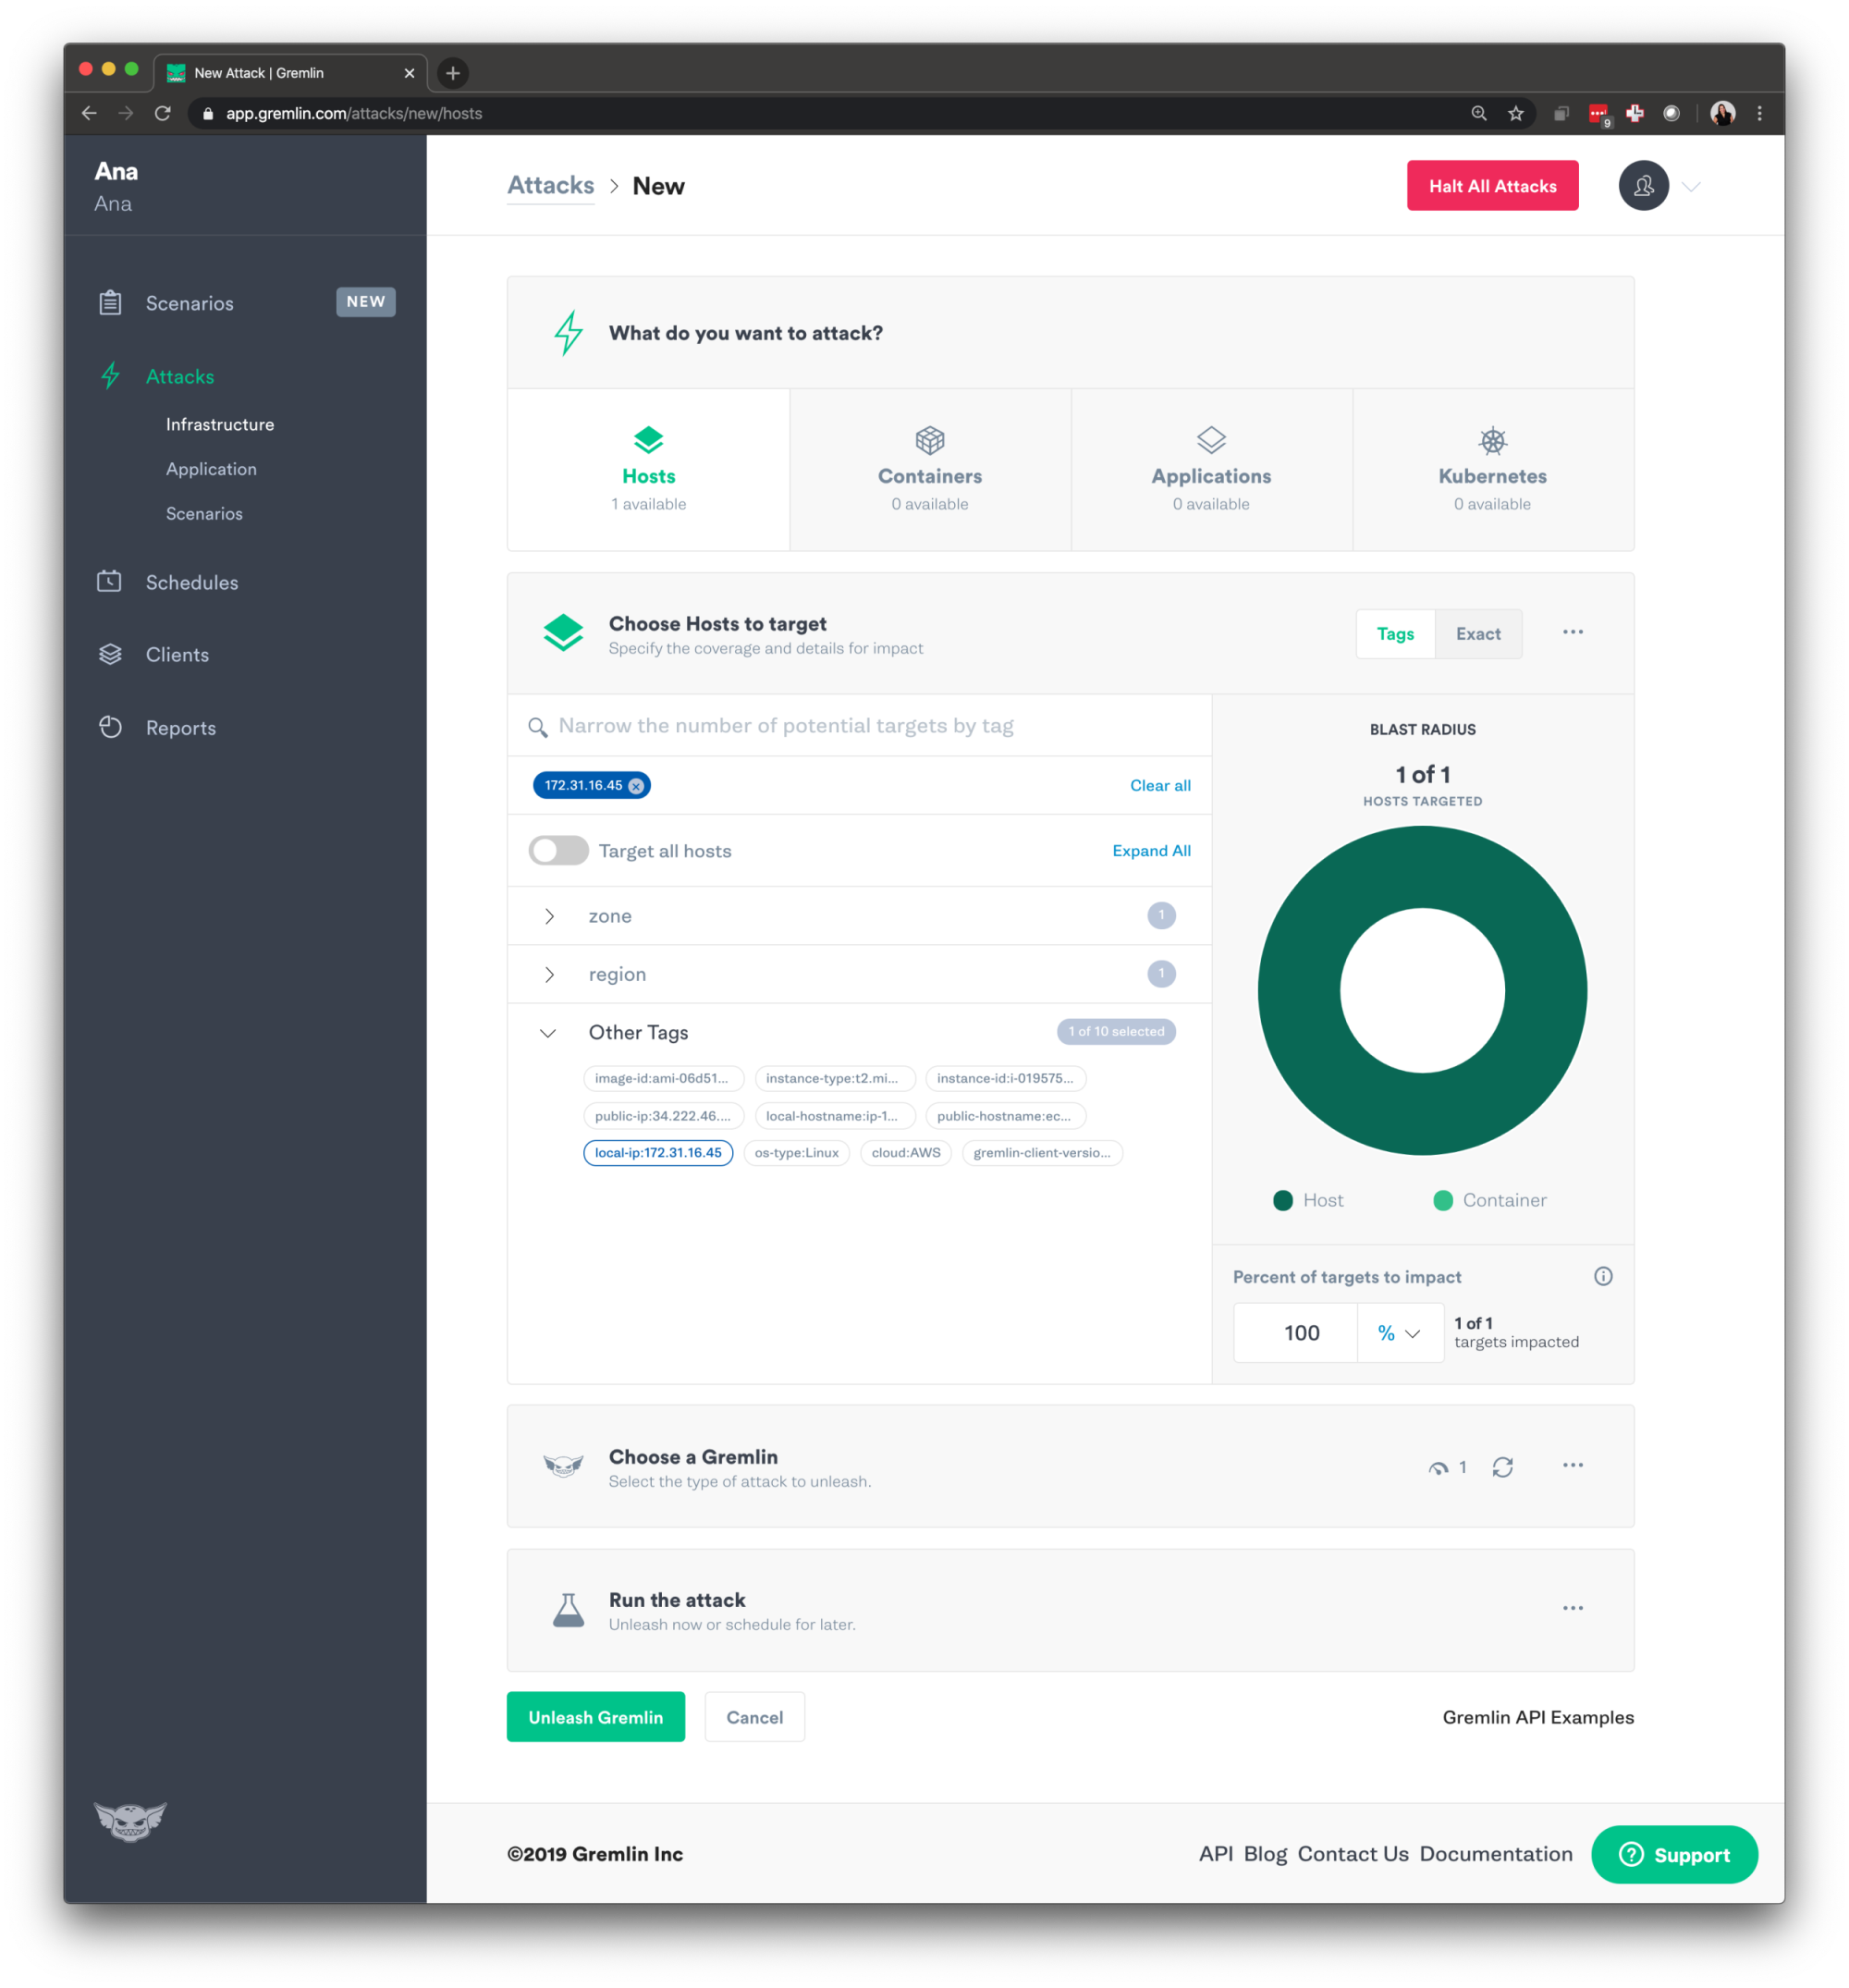
We will now go over to choosing the Gremlin. We will run a resource Chaos Engineering Attack, select “Resource” and choose “Disk” from the options. We will make the length 200 seconds, ask it to consume the Volume at 100 percent. We are then going to press “Show Advanced Options” and change the value of workers to 4 and make the block size 10000KB. Then press the green button to unleash the Gremlin.
Experiment Results
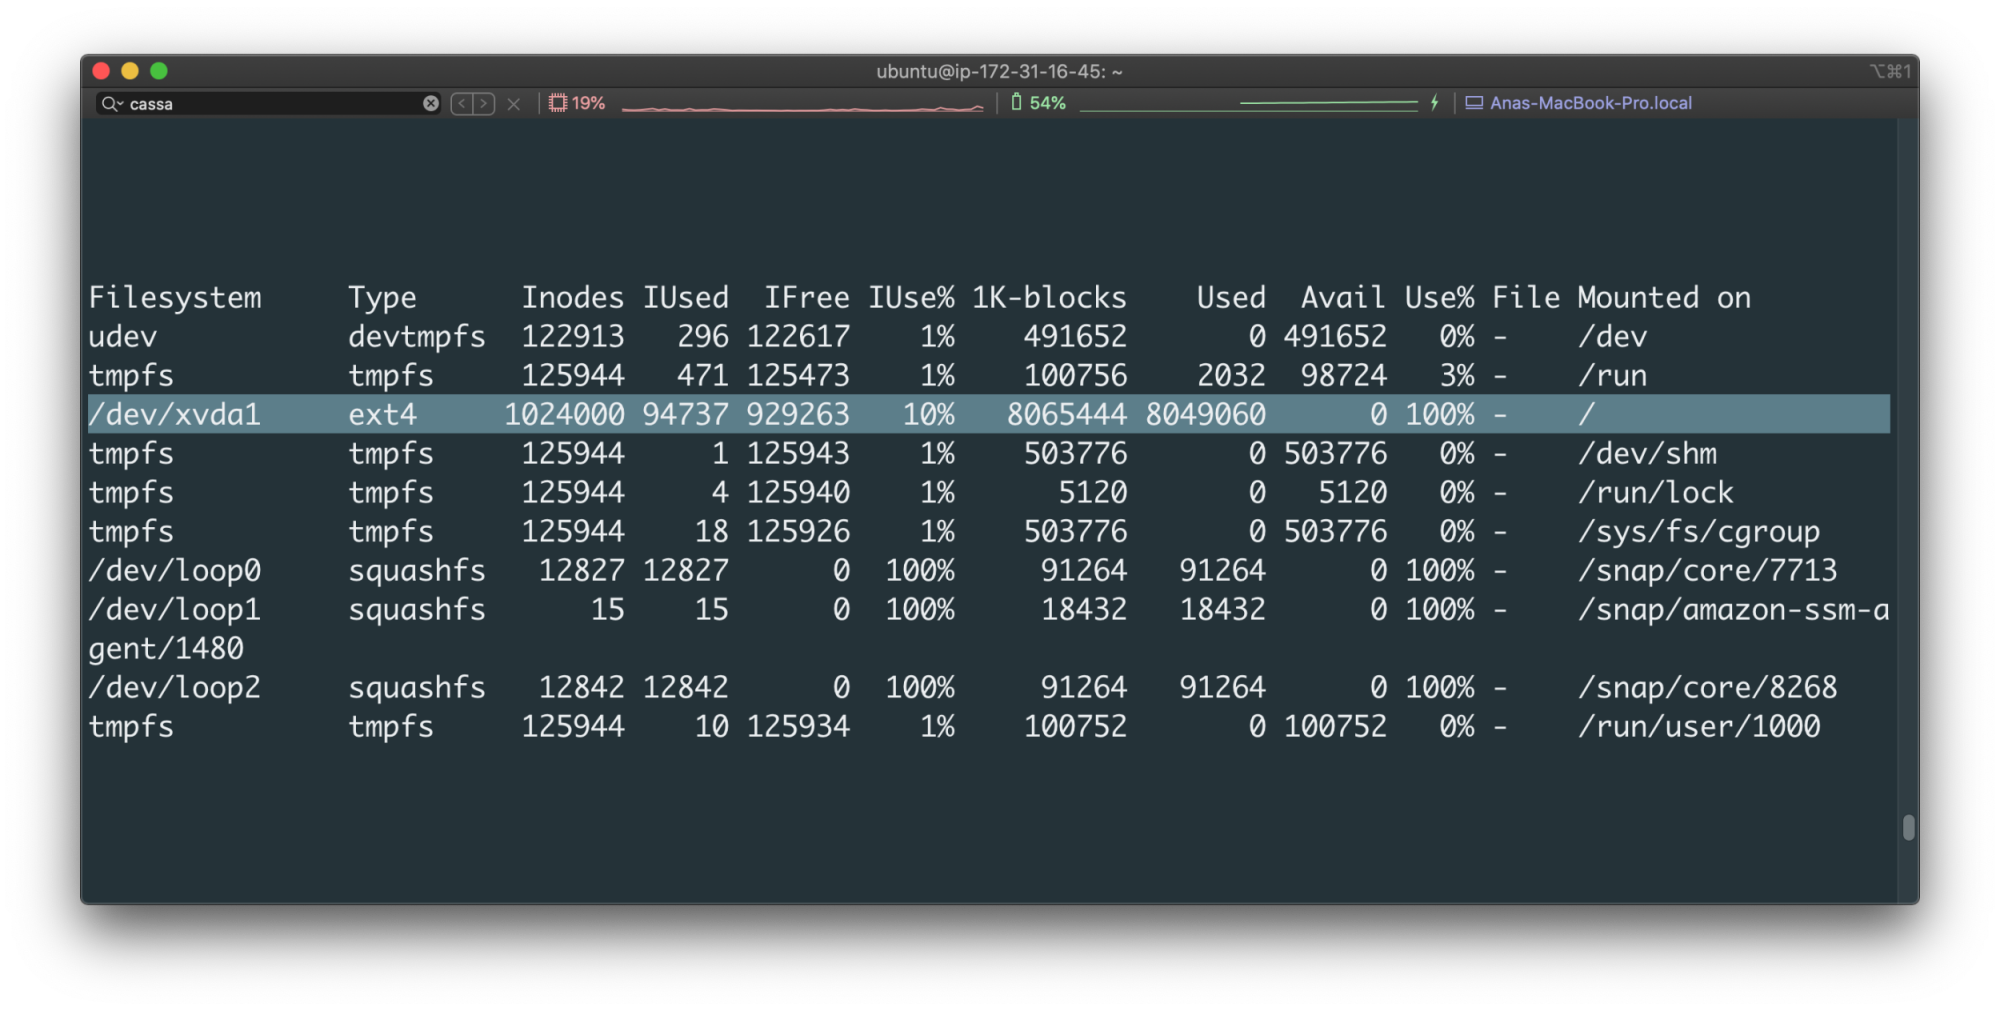
We can see on our monitoring that dev/xvda1 is running at 100% consumption.
Were you able to add entries into Cassandra?
Can you browse all of them?
Step 6 - Run a IO Chaos Engineering Experiment
We are going to create our second Chaos Engineering experiment. Performance is something we constantly need to keep in mind when using tools like Cassandra. We are going to run a Chaos Engineering experiment to learn more about how this host and implementation of Cassandra holds up to various disk/writes. Our hypothesis is, “When we consume I/O resources, Cassandra will still be usable and we will monitor this with i<span class="code-class-custom">ostat</span> too.”
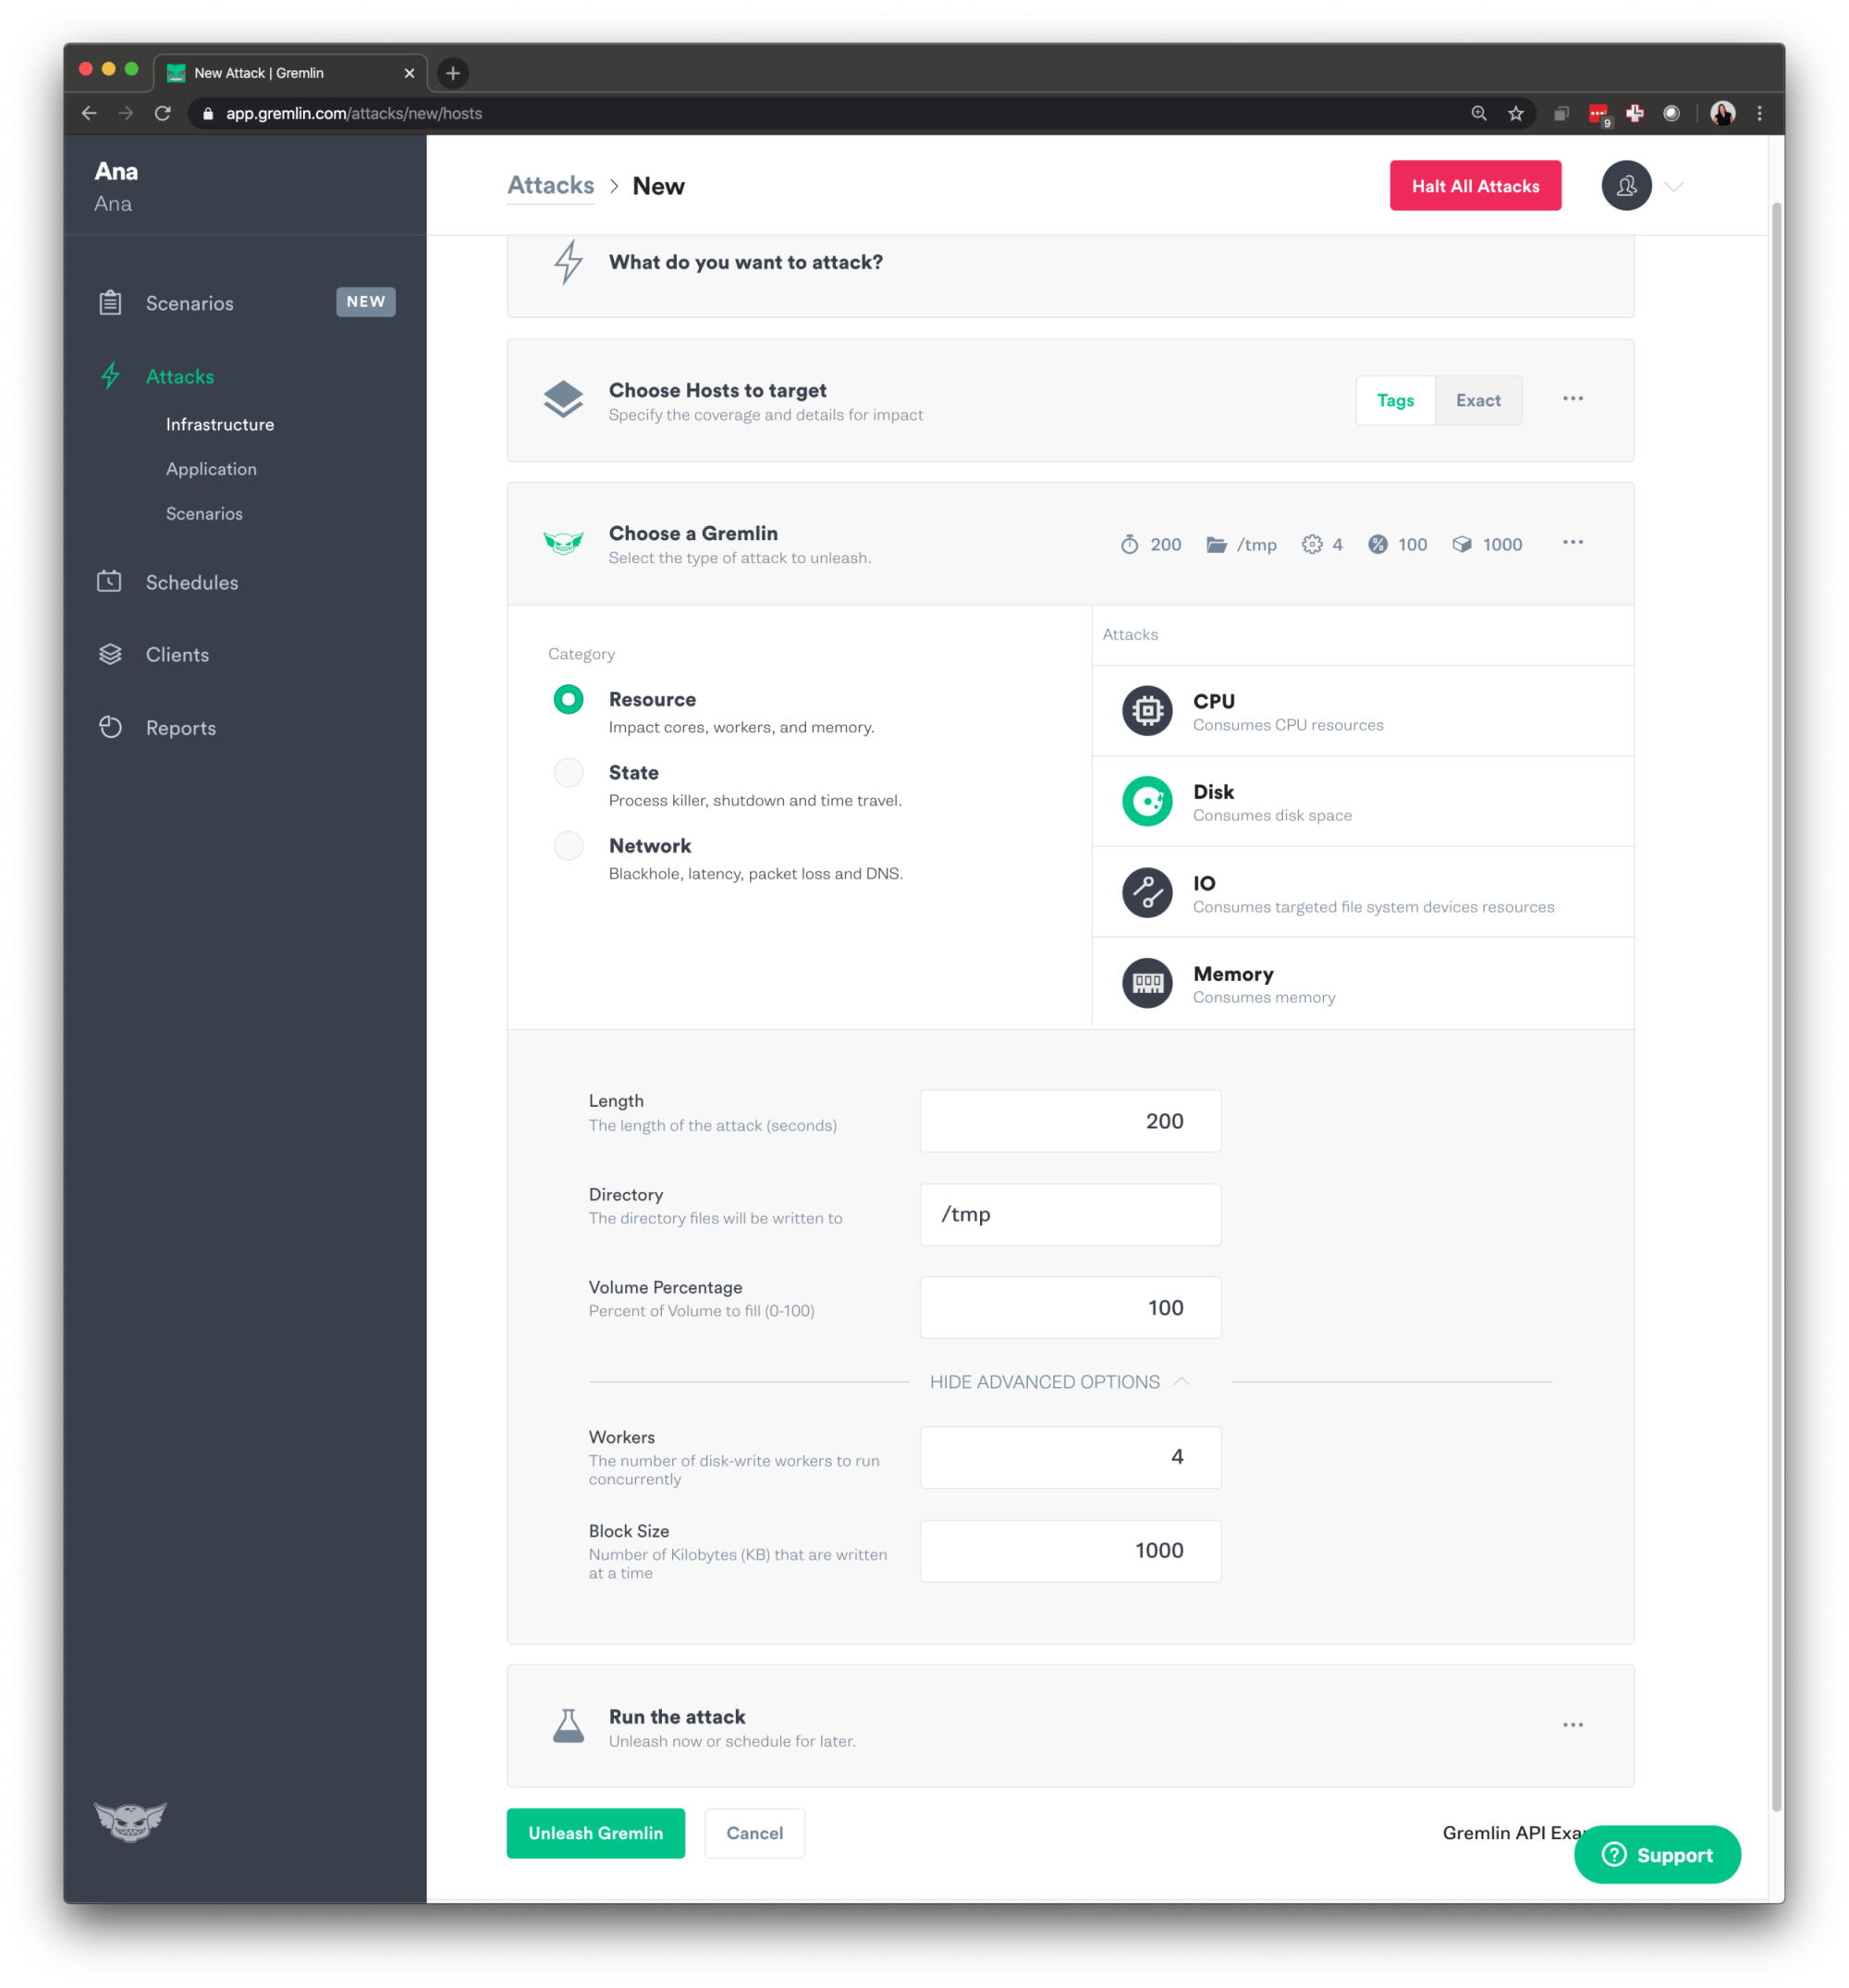
Going back to the Gremlin UI, select Attacks from the menu on the left and press the green “New Attack” button. We will be choosing the host from the list.

We will now go over to choosing the Gremlin. We will run a resource Chaos Engineering attack, select “Resource” and choose “IO” from the options. We will make the length 300 seconds, keep the default Root Directory of /tmp and Mode of rw (read and writes). We are going to select “Show Advanced Options” and set it to run 100 Workers (The number of IO workers to run concurrently), with a Block Size (Number of Kilobytes (KB) that are read/written at a time) of 8000KB and a Block Count (The number of blocks read/written by workers) of 20. Then press the green button to Unleash the Gremlin.
As the experiment start running <span class="code-class-custom">iostat</span> and have it refresh every 1 seconds, on your host run:
Experiment Results
As the experiment is running along with <span class="code-class-custom">iostat</span>, we have also tried a few more entries, we see that they have been added without any problems.

We also want to make sure to look at our monitoring of our IO consumption on the host using <span class="code-class-custom">iostat</span>:

Since we saw that this Cassandra setup handled this IO experiment very well, we will run a third Chaos Engineering experiment.
Step 7 - Expanding the BlastRadius of an IO Chaos Engineering Experiment
We are going to expand its Blast Radius. What does that mean? Blast radius is the subset of a system that can be impacted by an attack. We saw what would happen when using a Block Size of <span class="code-class-custom">8000KB</span>, but what if we made the Block Size larger, following the real-world example of uploading files to a file sharing service? We are going to simulate files of <span class="code-class-custom">50MB</span>. Our hypothesis is, “When we consume more I/O resources, Cassandra will still be usable and we will monitor this with <span class="code-class-custom">iostat</span> too.”
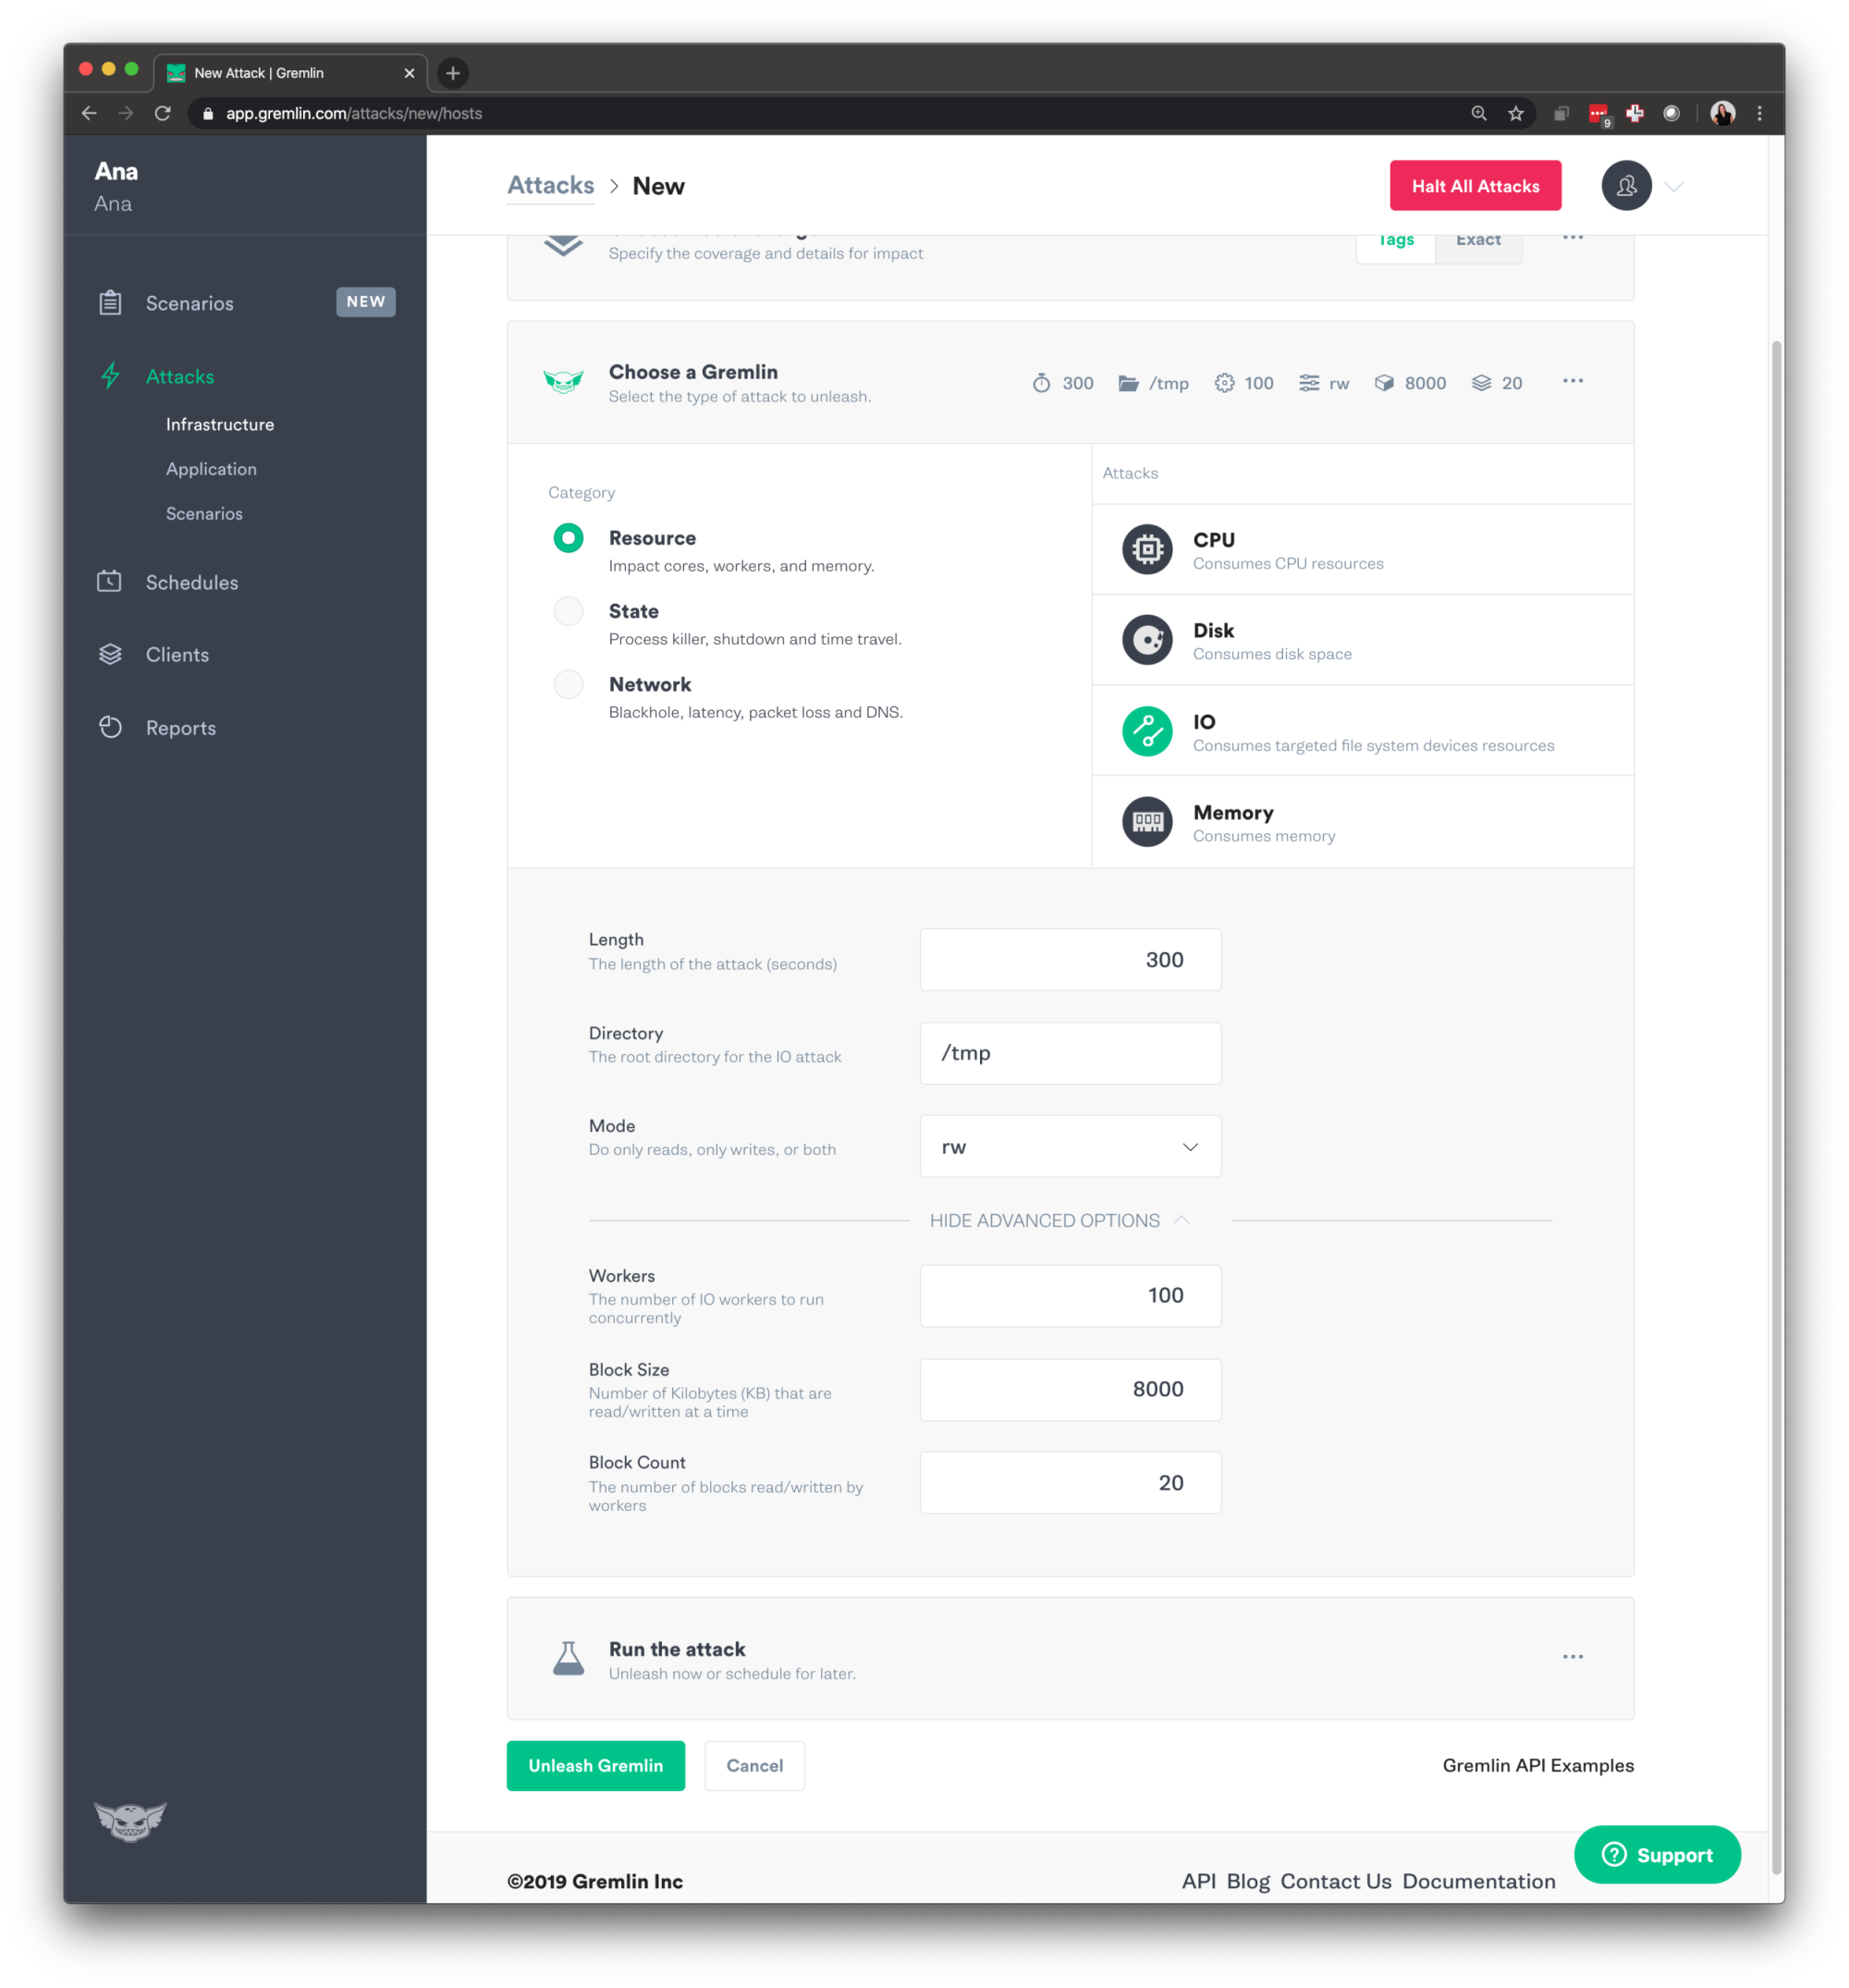
Going back to the Gremlin UI, select Attacks from the menu on the left and press the green “New Attack” button. We will be choosing the host from the list.
We will now go over to choosing the Gremlin. We will run a resource Chaos Engineering attack, select “Resource” and choose “IO” from the options. We will make the length 300 seconds, keep the default Root Directory of /tmp and Mode of <span class="code-class-custom">rw</span> (read and writes). We are going to select “Show Advanced Options” and set it to run <span class="code-class-custom">100</span> Workers (The number of IO workers to run concurrently), with a Block Size (Number of Kilobytes (KB) that are read/written at a time) of <span class="code-class-custom">50000KB</span> and a Block Count (The number of blocks read/written by workers) of <span class="code-class-custom">20</span>. Then press the green button to Unleash the Gremlin.
Experiment Results
Just like the last experiment, we want to make sure to go back and look at the monitoring we are doing with iostat:
We also want to test how Cassandra is handling this Chaos Engineering experiment, we see that we are able to add new entries but it’s 2 seconds slower than last experiment. Chaos Engineering experiments like this allow you to make sure you can handle a high load of users trying to use your application and for them to have great experience. For the example of a file file-sharing service, you want to make your user is able to upload files at a timely speed as well as be able to view and delete the file as quickly as possible.
Conclusion
Congrats! You’ve now run a few Chaos Engineering experiments for Cassandra. Where you able to learn something new about your Cassandra configuration? There are many other Chaos Engineering experiment you can run to focus on Cassandra resiliency. One we see folks not run as often is we’re treating our hosts as kettle and not pets to verifying your Auto Scaling Groups groups. We have seen that some folks get scared on shutting down hosts, especially when dealing with data, but you want to make sure you’re constantly ready for all sorts of failure to occur. If you have any questions at all or are wondering what else you can do with this demo environment, feel free to DM me on the Chaos Slack: @anamedina (join here!).
Avoid downtime. Use Gremlin to turn failure into resilience.
Gremlin empowers you to proactively root out failure before it causes downtime. See how you can harness chaos to build resilient systems by requesting a demo of Gremlin.

.svg)