Chaos Engineering Guide: DynamoDB


.svg)
.svg)

 This is an older tutorial
The first few lines of the DynamoDB website offer up a tantalizing description of DynamoDB, depicting the technology:
as a key-value and document database that delivers single-digit millisecond performance at any scale. It's a fully managed, multiregion, multimaster, durable database with built-in security, backup and restore, and in-memory caching for internet-scale applications.
Sounds perfect right? Of course it does.
No matter what type of company you work at you likely have some sort of database that is squarely in the critical path to providing a good customer experience. Though there are many flavors and incarnations of databases, there is no silver bullet solution that is capable of uncompromised resilience out of the box, despite what they may claim. So how do we prepare for that fateful day when our persistence store slows down to a crawl, or worse, becomes unresponsive altogether? We proactively identify the areas in which the technology is most susceptible to failure and we start poking and prodding.
Deconstructing DynamoDB
Most engineers end up developing with the best case scenario in mind. But what happens when things don’t go according to plan and we stray off the happy path? In order to better understand how to create a well-architected DynamoDB implementation let’s deconstruct a bit of what is actually being advertised here.
Single-Digit Millisecond Performance at any Scale
Anyone that has ever spent hours constructing queries and tuning databases knows that “single-digit millisecond performance at any scale” is the holy grail of data access. While DynamoDB is 100% capable of delivering on this promise, it’s most definitely not the norm. It requires an adept mind that is able to architect use of technology in such a way that it leverages the technology’s strengths. In the case of DynamoDB, that means ensuring tables aren’t subject to rapid growth, keys are constructed in such a way that data is uniformly distributed across partitions, among a plethora of other conditions.
The good news is most DynamoDB clients offer a ton of configurable timeout options. The bad news is the default values are much longer than the response times demanded by modern day applications. This means a poorly constructed data model can hang your application by chewing up the connection thread pool while your DynamoDB client requests data ad infinitum. Let’s take a look at the default client configurations for Java defined in ClientConfiguration.java:
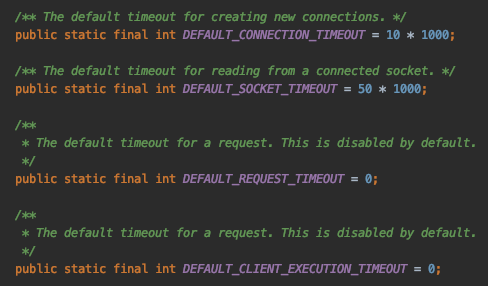
What the above default configuration translates to is a client that:
- Waits up to 10 seconds to acquire a connection
- Has no timeouts for an individual request
- Has no timeouts over multiple retried requests
- Will retry the request 3 times
A little fast math quickly reveals that the default DynamoDB client is prepared to wait 30s for data from a technology that boasts “single-digit millisecond performance at any scale.” That’s a 10,000x disparity between the expected behavior and the allowed behavior.
In order to protect against the possibility of long running queries it’s important to set an upper bound on the length of time an application will wait for a response from DynamoDB.
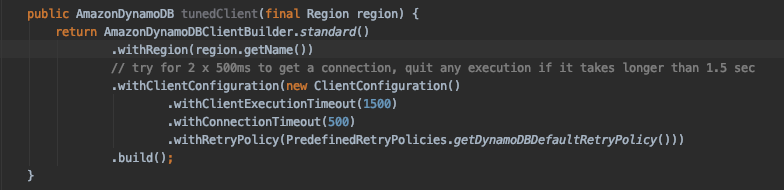
The above configuration modifies the default configuration such that the client:
- Will wait 500ms to acquire a connection
- Will timeout after 1.5s over multiple retried requests
- Will retry the request 3 times, timing out at the above maximum of 1.5s
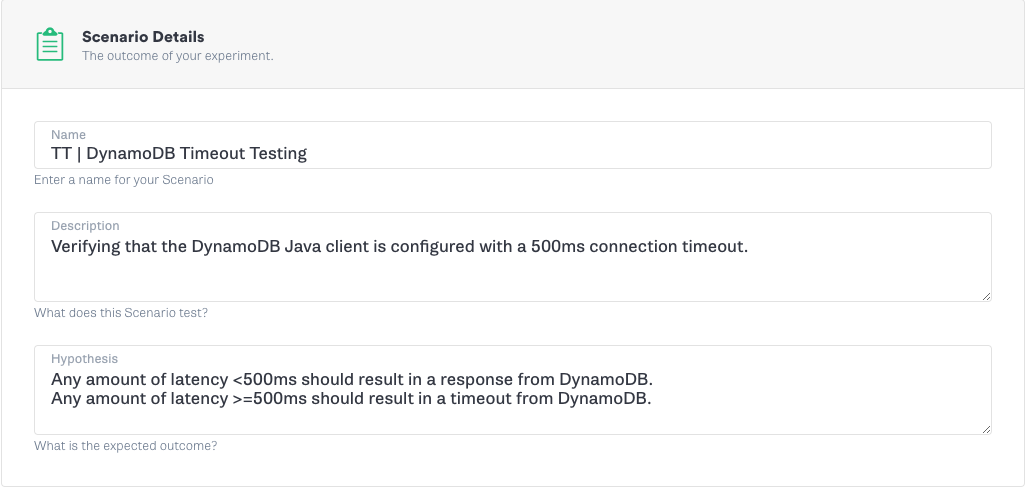
With a few changes to the configuration, the maximum timeout has been reduced from 30 seconds to 1.5 seconds, allowing us to fail fast in the event DynamoDB becomes unhealthy. Now it’s time to verify the effects of our configuration changes and validate that the client behaves as expected. Verification can be achieved by introducing latency between the application and DynamoDB and observing the results.
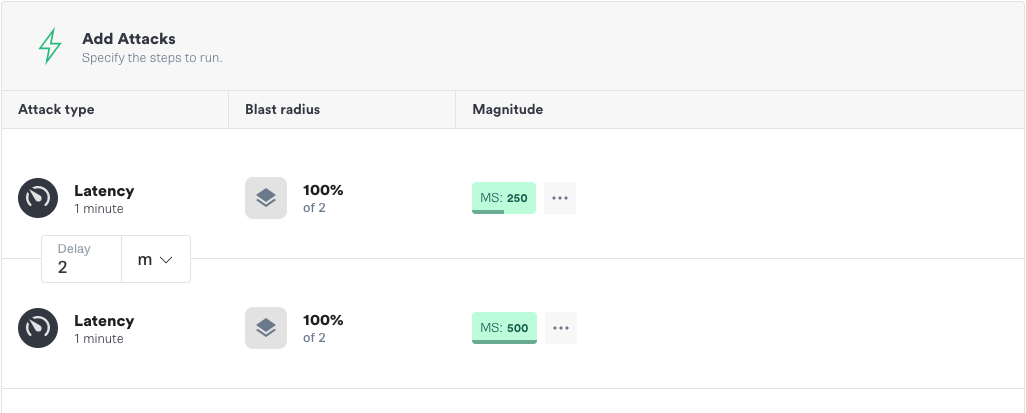
Any amount of latency under 500ms should be fine, but everything 500ms and over should now result in an error. We can run this experiment easily using the Gremlin app, as we will demonstrate. Using Gremlin’s Scenarios feature in the app, we first run an attack with 250ms of latency, during which everything should continue to work normally. We follow this with a second attack using 500ms of latency, which should result in an error. Here is how we set up the experiment to test our hypothesis.
Multiregion, Multimaster, Durable Database
One of the biggest benefits of DynamoDB is the seamless linear scalability, which allows tables to grow unbounded without engineers really needing to consider resource constraints. This is achieved via a combination of auto sharding and load balancing. What linear scalability doesn’t provide is multiregion, multimaster replication. In fact, there’s quite a bit of configuration that is necessary in order to get DynamoDB to function in a low-latency, durable fashion. Specifically you must configure a technology called global tables.
Why use global tables? If you want the reliability of a multiregion database you have to solve the issue of data replication. While you could spend engineering cycles solving this issue, AWS has a solution that leverages their private, global, high-bandwidth network infrastructure, backed by redundant 100 gigabit ethernet links. In other words, global tables is an out-of-the-box multiregion, multimaster data replication solution that’s blazing fast and backed by some of the industry’s brightest minds. It just makes sense.
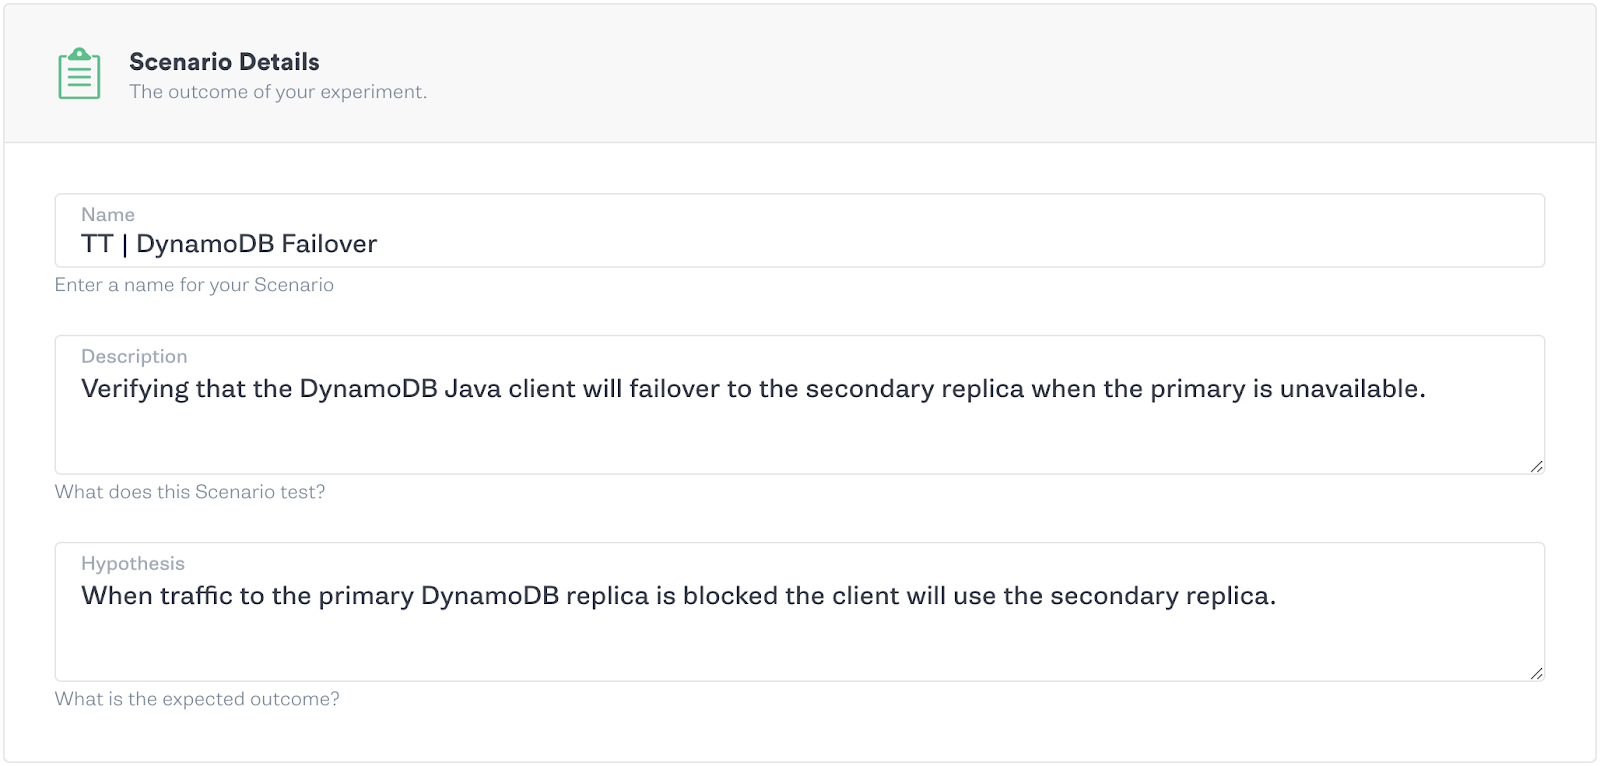
So let’s assume you’re convinced that global tables are the answer to building a more reliable system and you’ve gone through the steps of configuring Global Tables for your DynamoDB database (see Adrian Hornsby's guide to global tables). Congratulations, you’ve now got multiregion, low-latency data replication in place and are ready to failover traffic in the event of a regional DynamoDB outage ... in theory.
Now comes the true test, verifying everything is configured correctly and will behave as expected when called upon. After all, reliability is all about tradeoffs and in this case we have to justify the cost we’re incurring for constant data replication by proving that we have a backup that will step in to take the load if and when our primary replica is unreachable.
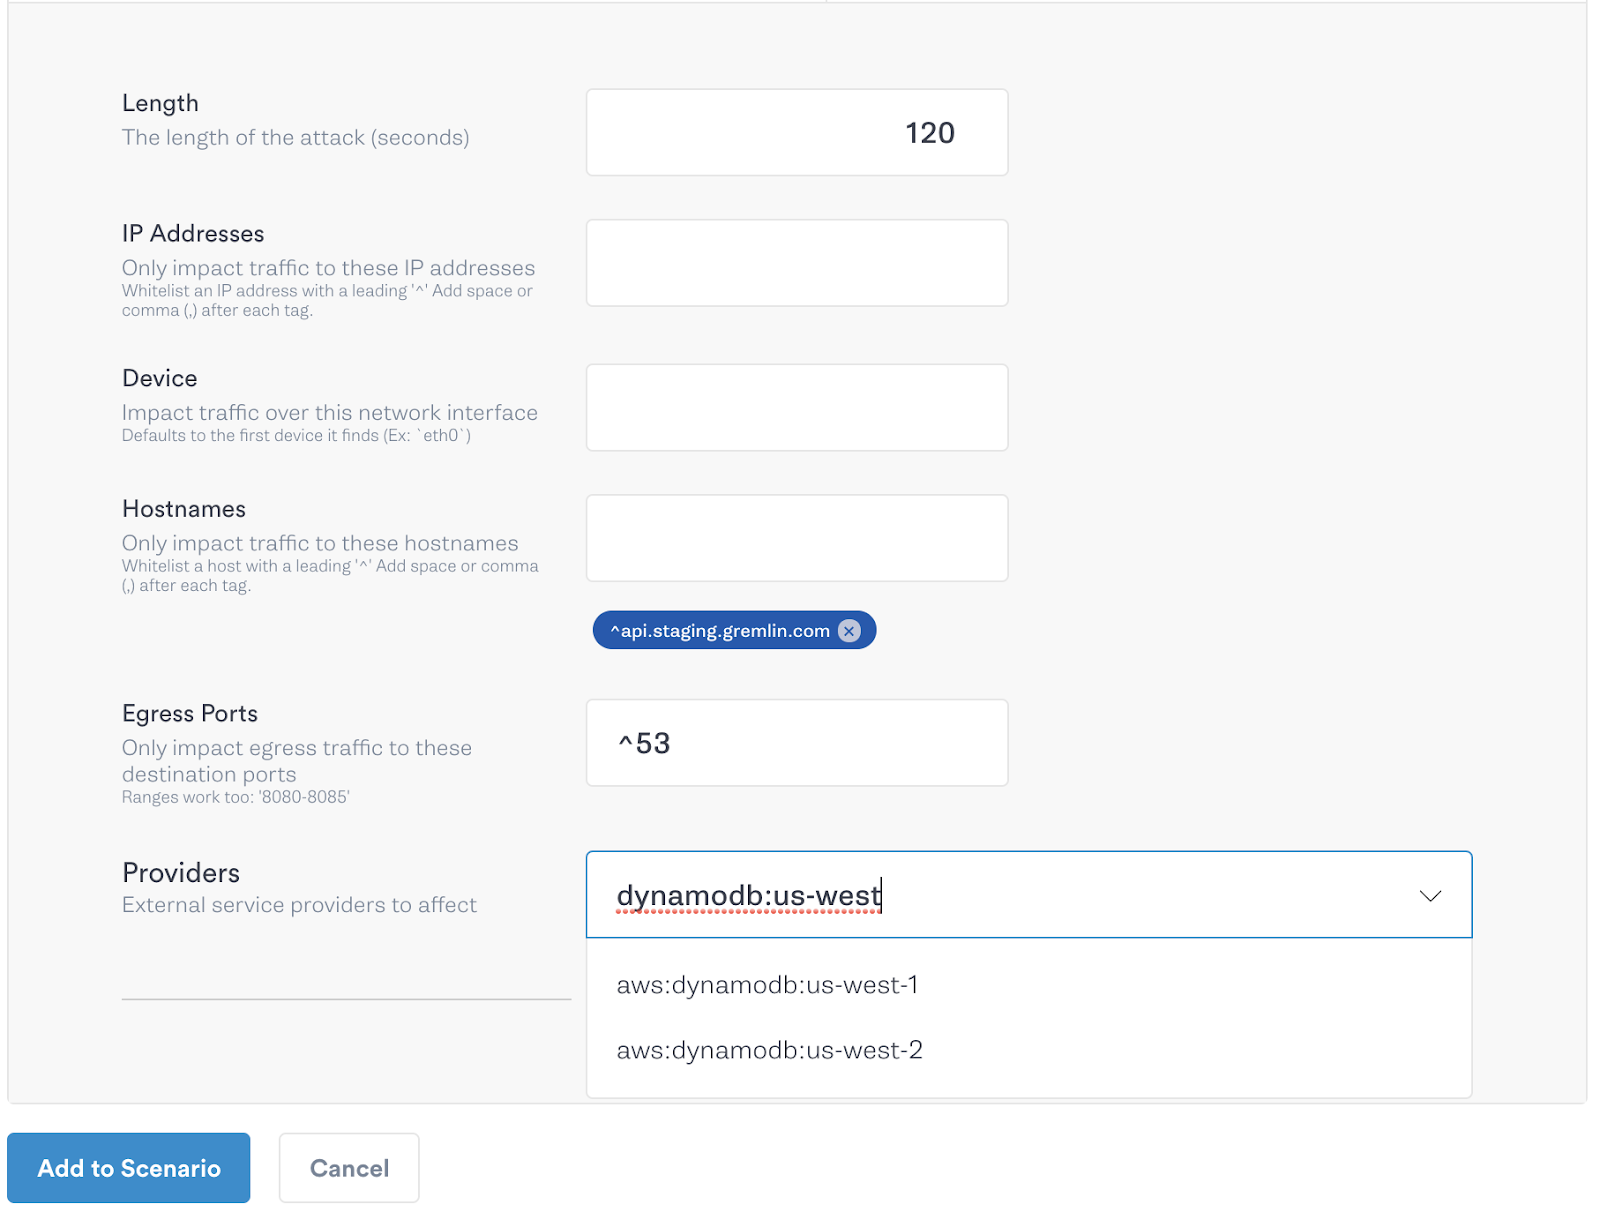
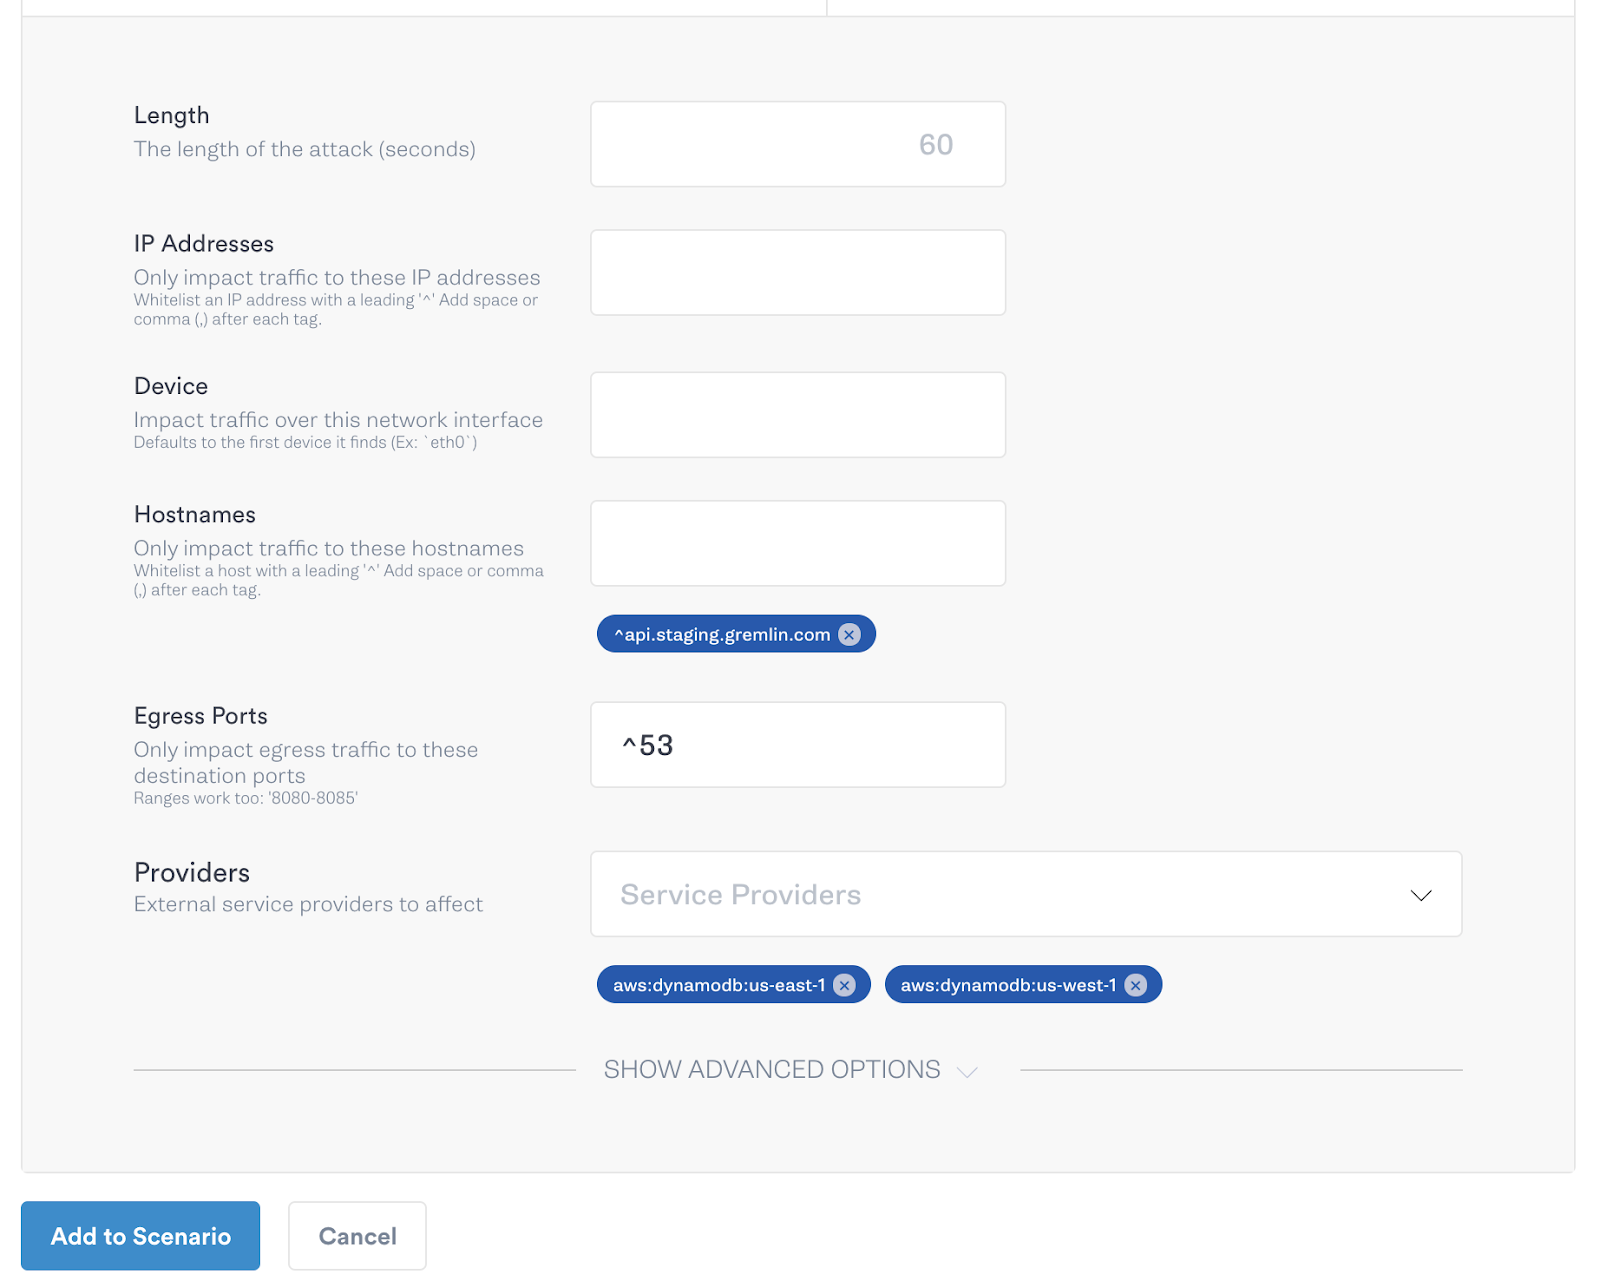
As before, we can create experiments to test our system and our hypotheses using the Gremlin app and the Scenarios feature. Since AWS services don’t utilize static IP addresses it can be difficult to craft repeatable scenarios. Gremlin remedies this issue by exposing the ‘provider’ functionality in all network attacks, which allows for users to identify AWS services by name, instead of IP address or IP range, and then performs the lookup under the covers. So all you need to do to test your new failover functionality is create a Scenario that blackholes traffic to your primary DynamoDB replica and then sit back and watch to make sure your application continues to serve traffic uninterrupted.
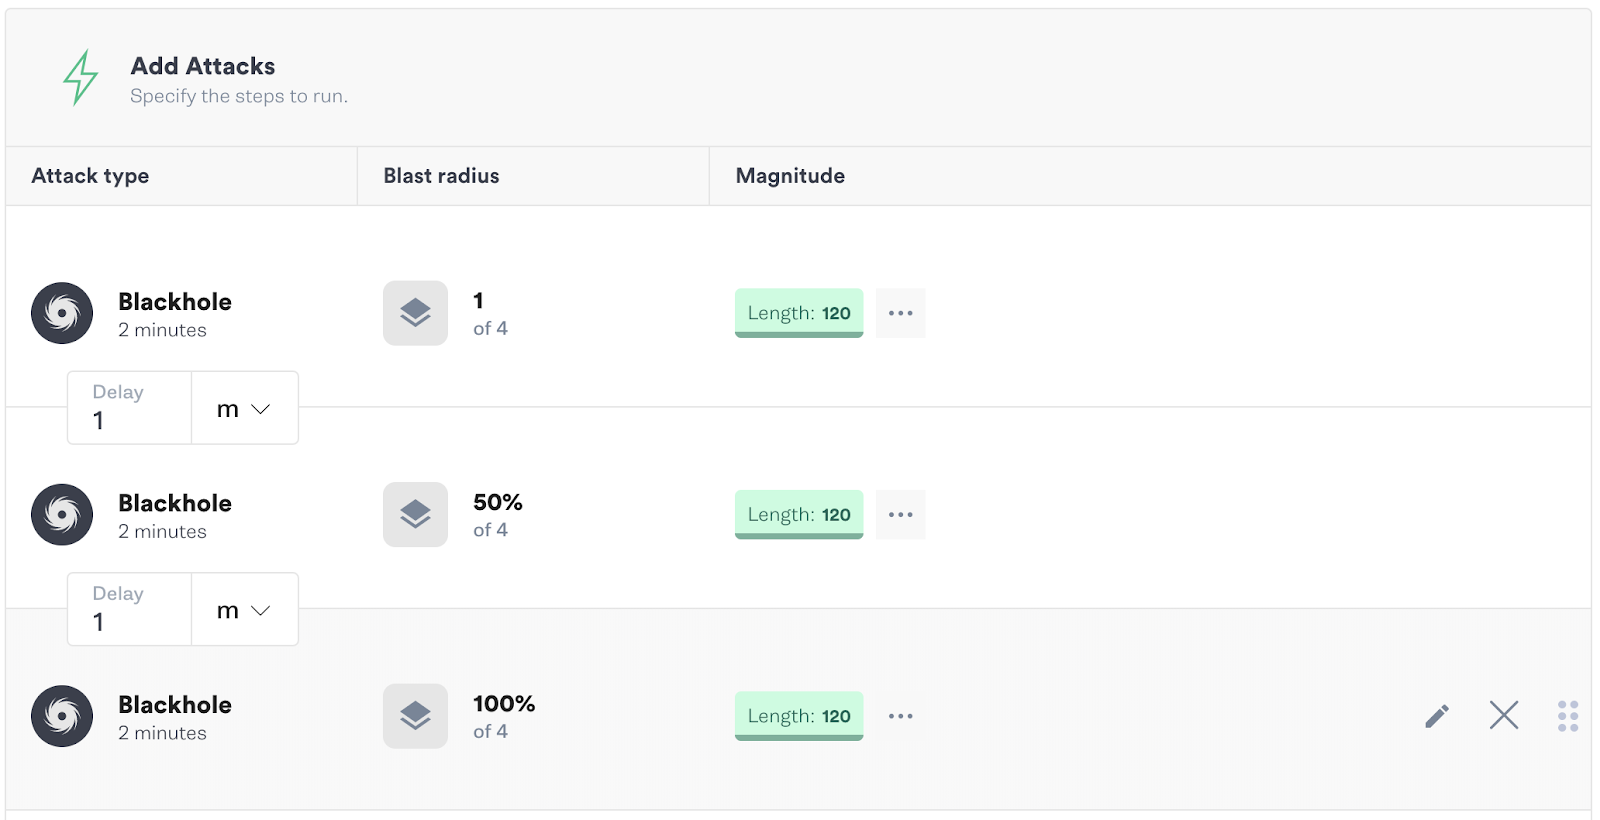
Of course, when running a Scenario with such potentially destructive results, it’s best to start off with a smaller blast radius and ramp the blast radius over successive steps. In the example below, we start by only affecting one host, then 50% and then the whole fleet. By slowly ramping the blast radius we can identify if there are any possible issues with our hypothesis before we’re testing across our entire fleet.
With a few easy steps we’re able to either validate or reject the hypothesis we’ve made in setting up global tables and prove beyond the shadow of a doubt that the reliability mechanisms we’ve put in place will respond when called upon.
In-memory Caching for Internet-Scale
Last but not least, let’s talk in-memory caching for Internet-scale. It comes for free with DynamoDB right? Not quite, but as you probably guessed AWS has an offering for that, and it’s called DynamoDB Accelerator, or DAX for short.
DAX is a fully-managed, caching layer that abstracts the nitty-gritty of cache invalidation, data population and operating at scale. It’s also incredibly flexible, allowing you to mix and match caching clusters with your underlying tables, all from the console, or CLI. Essentially it’s a point and click caching layer that allows you to speed up queries by up to 10x, or as they state on the marketing page “from milliseconds to microseconds.”
The real kicker though is that DAX is fully API-compliant with DynamoDB so the claim is all you have to do is update your code to use a new client. This makes adapting your code to use DAX as simple as changing code, like this, from the example used above.
This original code
becomes
And supposedly you’re good to go. But how do you actually ensure that the caching layer you just set up is actually working as expected? The data is showing up in our application, and the query times look to be faster, but we want to be sure that we’re no longer dependent on a direct connection to DynamoDB, but rather utilizing that globally distributed cache that we’re paying good money for.
Any time we want to be sure we have to figure out how to test our work. We can’t just implement something and hope it works; not if we want any sense of confidence in our system and application when the unexpected happens.
For this change, testing with Gremlin is as simple as blackholing traffic to the DynamoDB endpoint that used to be a critical dependency for your application. If that communication is broken, the cache should kick in and continue to serve our data.
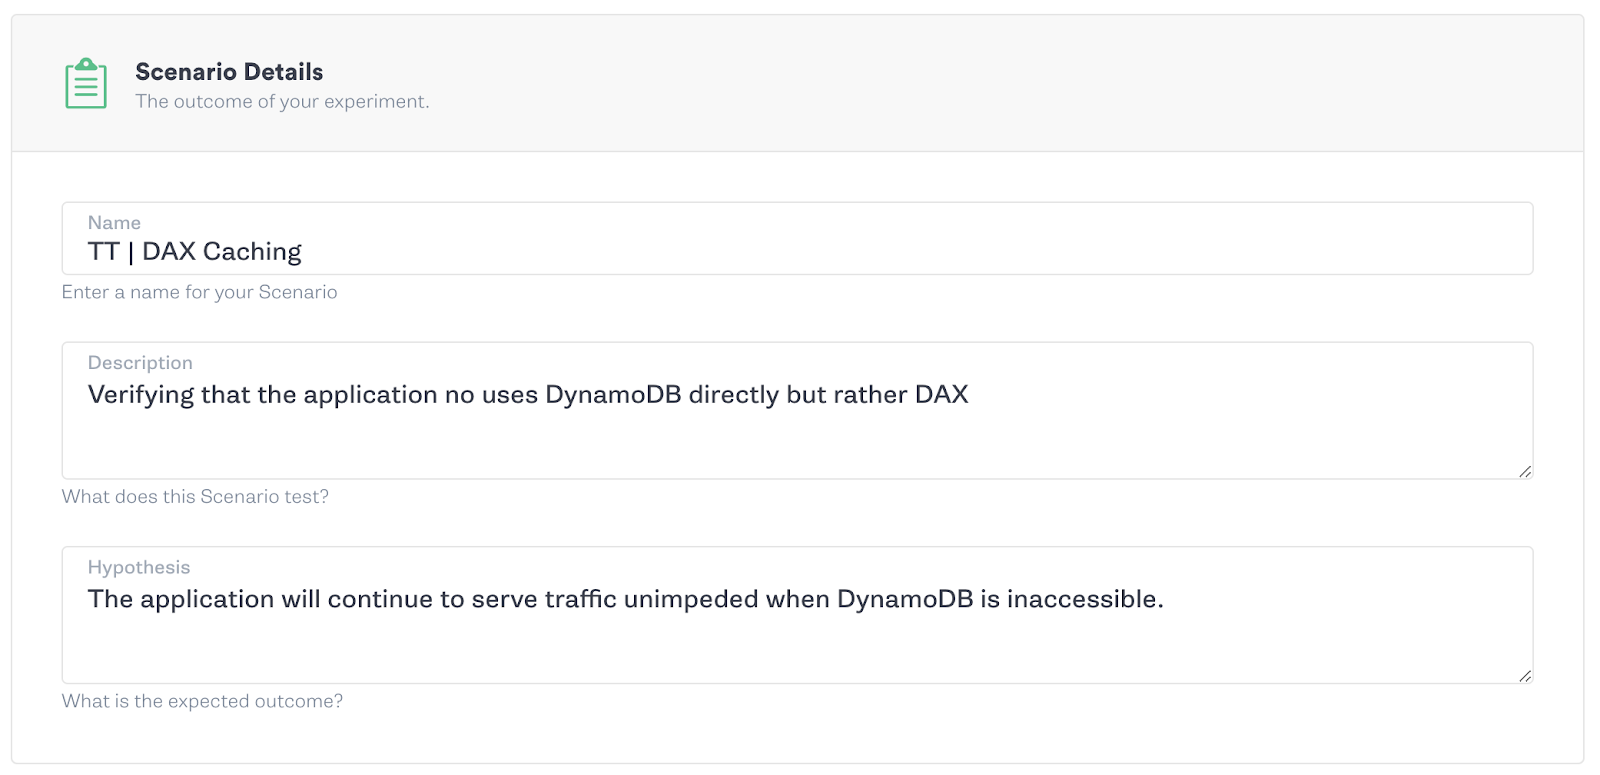
If your application continues to serve data and work as expected, congratulations you’re caching. If not, something needs a bit more configuration before you can close the book on this chapter of reliability improvements.
Conclusion
DynamoDB is fast, powerful, and intended for high availability. These are all valuable attributes in a data storage solution, but to be useful as advertised, it must be configured thoughtfully. That gets you to a good starting point with a useful database that appears to be working as intended. To achieve any level of certainty or trust in the application, you must also test whether it is performing as designed and expected. Specifically, you must test whether it actually uses the configuration options you have set. You must also test to be sure that the multiregion failover and caching options you have set up will work as designed. Gremlin makes verifying this easy and gives you the information you need when you want to be sure.
Now that you're familiar with running Scenarios, use our Recommended Scenarios to test for additional failure modes. You can use the following experiment cards to quickly get started.
.svg)
Avoid downtime. Use Gremlin to turn failure into resilience.
Gremlin empowers you to proactively root out failure before it causes downtime. See how you can harness chaos to build resilient systems by requesting a demo of Gremlin.

.svg)