
We’ve recently made upgrades to our CPU, disk, and memory attacks to provide more configurability, improve reliability, and enhance ease of use. Infrastructure attacks (Resource, State, and Network attacks) are at the core of Gremlin’s functionality. These attacks provide stresses on your infrastructure, highlighting application weaknesses and bugs that lead to incidents or outages, creating a poor user experience.
In this post, we’ll cover the improvements along with some use cases for these Gremlin attacks, enabling you to ship more reliable code.
As always, before running an attack, select the minimum number of hosts or containers and options necessary for you to learn without causing harm. It’s important to carefully consider the blast radius of any attack you’re running.
CPU Improvements
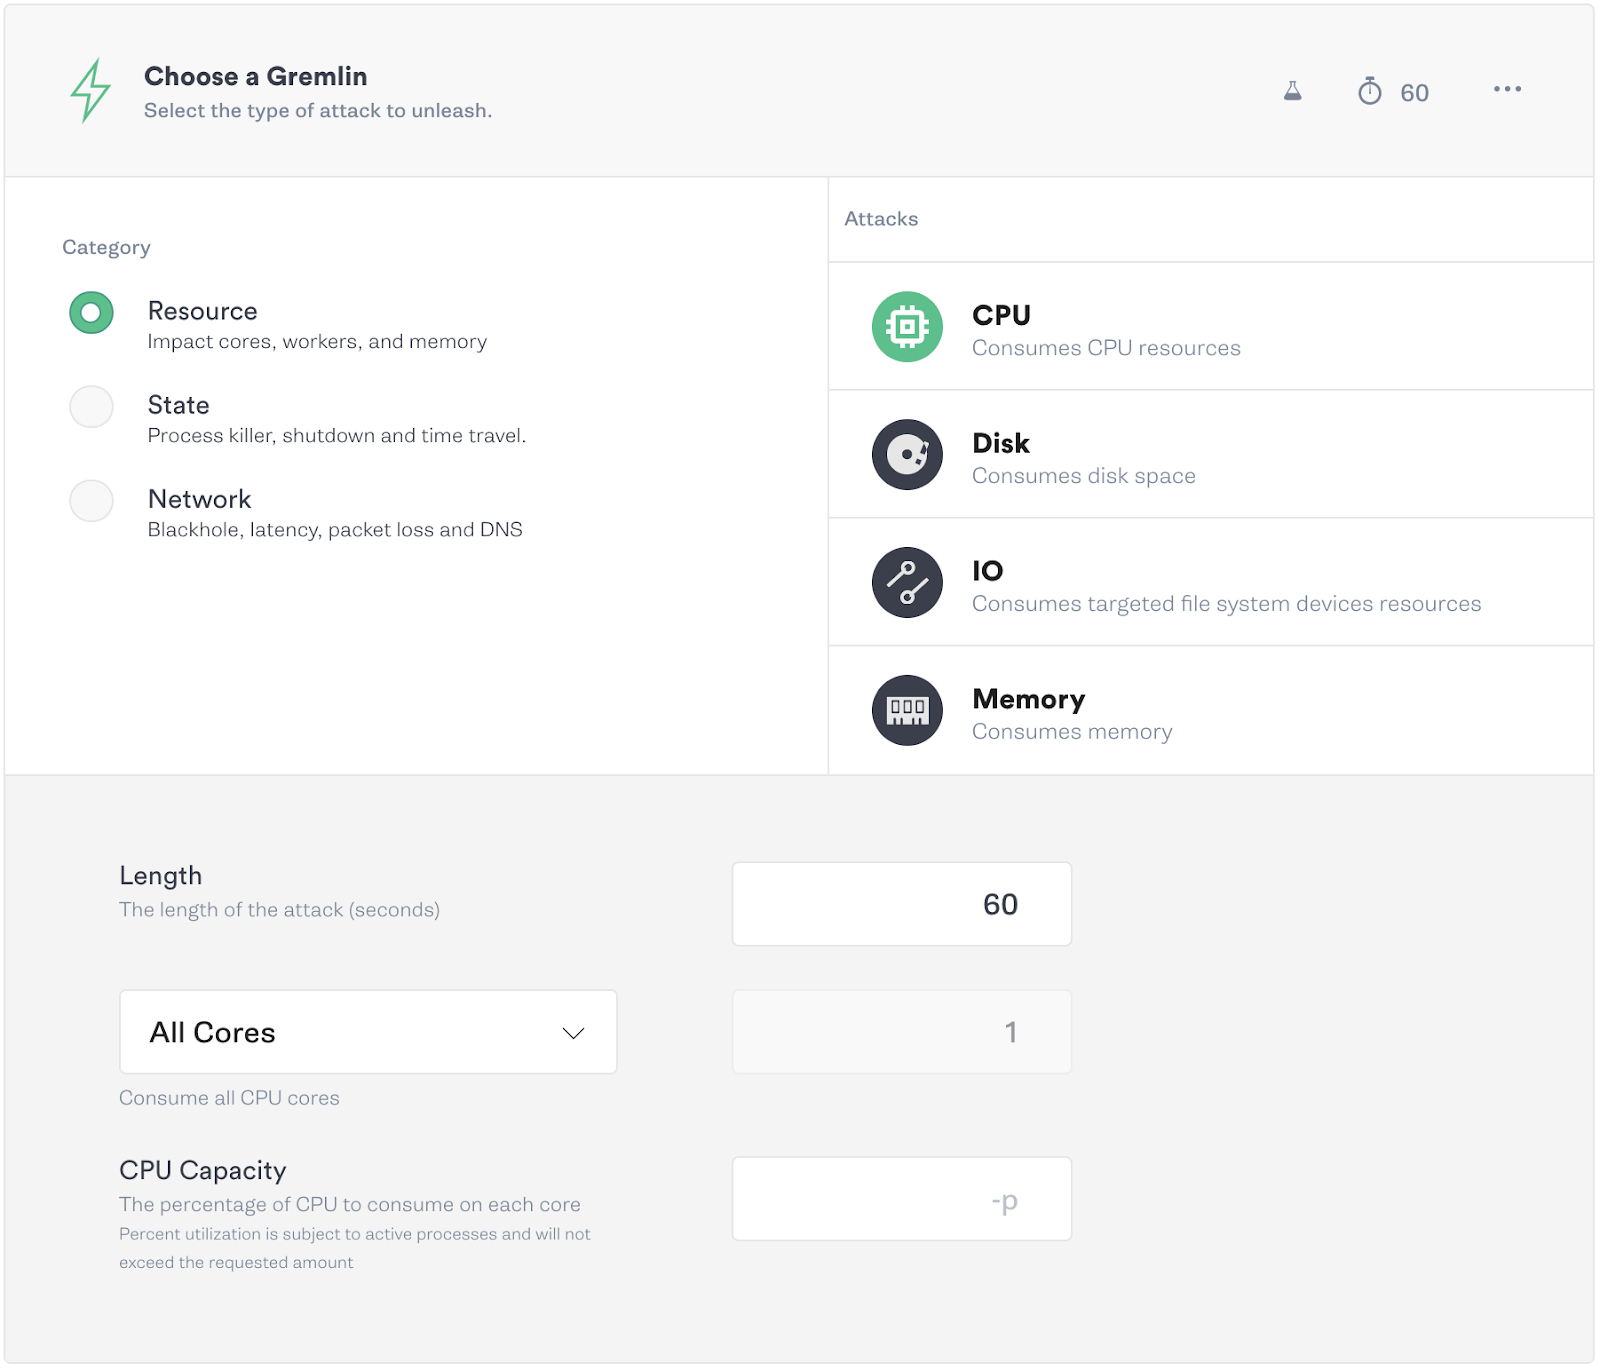
With Gremlin’s most recent release, we’ve added the ability to easily impact all of the available cores on your targets at once when using the CPU attack. The previous implementation required you to know or guess how many cores you have for each target.
To better emulate real-world usage, we’ve also added a feature to specify the percent of CPU capacity you would like to utilize per host.
CPU Use Case 1: Verify Your Monitoring and Alerting
An important part of running and maintaining reliable infrastructure is ensuring teams are aware when something is out of the ordinary. Observability into the state of your infrastructure, and being alerted when it’s outside of normal operations, are basic requirements in maintaining your Service Level Objectives (SLO).
To test your monitoring and alerting functionalities and policies, run CPU attacks to stress your infrastructure and services. Observe the impact in your monitoring dashboards, and receive alerts from paging platforms to verify they work as expected.
Set the CPU % utilization to a level above your alerting threshold, and set the attack length long enough to trigger the alert. Monitor the attack on your dashboard and ensure an alert is triggered.
CPU Use Case 2: Autoscaling verification
Huge spikes in traffic from link aggregation sites or holiday shopping can lead to your website or service being hugged to death. Autoscaling helps to combat this very thing by recognizing high CPU load on your service and spinning up extra instances that will handle the spikes in traffic. The scaling happens automatically based on policies you set, and if the load drops, it can save you money by shutting down the instances when you no longer need them. This scaling up and down leads to a seamless experience for your engineers and end users.
Create a CPU attack using a CPU utilization percentage and attack duration above your autoscaling policy thresholds. Verify that as your CPU is heavily used, your autoscaling takes effect to compensate by creating more instances. After the attack, when load decreases, the instances should then be shutdown.
Disk Improvements
With storage being cheap, coupled with our instinct to save everything, it’s tempting and easy to save logs, photos, videos, and more, without considering that storage constraints still exist. Forgetting that you’ve started an application on debug mode leads to the painful realization that the logs have filled your storage, leading to errors and alerts. To simulate this, we’ve improved our Disk Attack for stability when running experiments at the limits of disk space, to help test what it’s like when your storage fills completely.
Disk Attack Use Case: Filling Storage
What happens in your applications when your storage fills? Do the applications crash or lose data? While it may seem elementary, knowing that your application behaves as you expect when it cannot write data to storage ensures there are no surprises when a customer is attempting to upload photos, save data, or your platform is writing logs and the disk is full.
Use a disk attack to fill storage to 100% for long enough to run automated tests, verify the application’s UI manually, or run a script that writes logs while you monitor. Watch your dashboards and check for unexpected behavior and alerts that are triggered.
Memory Improvements
Previously, users had to specify the amount of MB or GB of RAM to consume when running a memory attack. Now, you can simply set the attack to consume a percentage of the available memory, making the feature much more user-friendly. This is particularly useful when hosts and containers have different memory allocations across each instance, or if you aren’t sure how much they have been allocated. Along with this, we’ve made memory consumption on hosts and containers more accurate, changing it from consuming memory marked as Free to consuming memory marked as Available.
Memory Use Case: Performance Bottlenecks
Memory leaks, garbage collection problems, and poor coding practices will fill your application’s memory over time and this can cause errors and performance bottlenecks. These bottlenecks lead to user-facing slowness, errors, and data loss.
Run a memory attack to help fill the available system memory then check your monitoring tools to verify the effects. Run your performance tests or UI regression testing to observe any user experience or performance degradation in the form of errors that are transparent to the user, slow page loads, or data loss.
Cover the basics
As part of any Chaos Engineering program, it’s important to ensure you have basic failure modes covered. Starting with a CPU, memory, or disk attack can challenge your assumptions of how a service will behave under stress or failure. We’re excited to release these upgrades with the 2.11.0 version of our agent to help users understand the reliability of their services and applications.
To learn more about the attacks discussed here, as well as our other attacks, go to our docs page that outlines them in-depth, or join the #support channel in our public Slack for help.
Gremlin's automated reliability platform empowers you to find and fix availability risks before they impact your users. Start finding hidden risks in your systems with a free 30 day trial.
sTART YOUR TRIAL
What is Failure Flags? Build testable, reliable software—without touching infrastructure
Building provably reliable systems means building testable systems. Testing for failure conditions is the only way to...


Building provably reliable systems means building testable systems. Testing for failure conditions is the only way to...
Read moreIntroducing Custom Reliability Test Suites, Scoring and Dashboards
Last year, we released Reliability Management, a combination of pre-built reliability tests and scoring to give you a consistent way to define, test, and measure progress toward reliability standards across your organization.

Last year, we released Reliability Management, a combination of pre-built reliability tests and scoring to give you a consistent way to define, test, and measure progress toward reliability standards across your organization.
Read more