
Redundancy is a core strength of Kubernetes. Whenever a component fails, such as a Pod or deployment, Kubernetes can usually automatically detect and replace it without any human intervention. This saves DevOps teams a ton of time and lets them focus on developing and deploying applications, rather than managing infrastructure.
However, problems arise when we start talking about Kubernetes clusters. For example, what happens when one of your nodes fails? Can your Kubernetes hosting provider automatically restart it for you? Can you re-route traffic to healthier nodes in the meantime? Were there any workloads running exclusively on the failed node that now need to be spun up on another node? All of these questions are important, as they can greatly affect your services’ performance and availability.
In this blog post, we’ll cover node redundancy in Kubernetes. Then, we’ll look at one of Gremlin’s built-in Recommended Scenarios that can help you verify your resilience.
How does Kubernetes handle redundancy?
There are three main challenges with redundancy that Kubernetes tackles:
- Running and managing multiple copies (replicas) of the same service simultaneously.
- Detecting failed replicas and automatically re-routing traffic to healthy instances.
- Recovering failed replicas if possible and re-routing traffic back to them once they’re healthy again.
Additionally, managed Kubernetes services like Amazon Elastic Kubernetes Service (EKS) and Google Kubernetes Engine (GKE) take these same concepts and apply them to the cluster itself. Kubernetes clusters are made up of multiple worker nodes, which run the Pods that make up your services. Cloud providers can create new worker nodes on-the-fly to increase capacity, or remove nodes when capacity is low. Adding a node can increase redundancy by letting you create new pod replicas and deploy them onto new nodes.
How do you make Kubernetes pods more redundant?
Imagine we have a Kubernetes cluster with two worker nodes running ten Pods in total. Kubernetes uses a scheduling algorithm to determine which node is best suited for a Pod. For example, it could split the Pods evenly between both nodes, or run three resource-intensive Pods on one node and the remaining seven on the other.
Now let’s imagine one of these nodes has a faulty power supply and suddenly shuts off. The Pods that were running on that node are now completely unavailable. Kubernetes can detect this and deploy replicas of those Pods onto the remaining node, but this could take several minutes. In the meantime, your services are down and customers are getting upset.
Let’s work on making this cluster redundant. First, we’ll use topology spread constraints to tell Kubernetes how it should distribute pods across the cluster. Topology constraints use node labels, affinity rules, taints and tolerations, and other deployment systems to determine the best way to deploy pods for high availability.
For example, say we have an Nginx Pod that we want to deploy across two availability zones (AZs). We could use this Deployment manifest to deploy two Nginx replicas, then use topology constraints to run them across both AZs:
This states that the Pod will be evenly distributed across nodes using the zone label, and that Kubernetes will avoid deploying if no nodes can satisfy this requirement (e.g. if the cluster is running in a single AZ). The minDomains option specifies how many zones must be present: in this case, 2. The maxSkew setting determines the degree to which Pods are unevenly distributed. In this case, setting it to 1 guarantees that both zones stay within one Pod’s difference from each other. For example, if we have one replica of the Pod running in zone 1, deploying the second replica to the same zone would increase the replica count to 2, which is higher than the skew. Deploying the second replica to zone 2 means there’s zero skew between the two zones, which is exactly what we want.
How do you make Kubernetes nodes more redundant?
Topology constraints are useful, but they only work on the Pod level. What about the cluster itself? How does Kubernetes handle node failures?
The truth is: Kubernetes doesn’t have much built-in functionality for this. However, managed Kubernetes providers do, and Kubernetes has ways of integrating with providers to make cluster management easier.
The native way to add node redundancy is with the Cluster Autoscaler. As the name implies, the Cluster Autoscaler automatically adds or removes nodes—usually in response to a metric like resource usage—to meet a minimum requirement that you set. For example, on AWS, the Cluster Autoscaler can interact with EC2 Auto Scaling Groups and adjust the node count as needed.
Another problem engineers run into is data redundancy. If your containers need to store data directly on a node, then the data is lost when that node goes down. For temporary data, like logs or working data, this might not be a problem. But for more permanent data, like customer records and settings, data loss can impact the business. Instead of writing data to the node, consider using cloud-based storage like Amazon S3, or distributed storage systems like OpenEBS. These systems are also susceptible to failures, though: cloud-based storage can have downtime, and distributed storage systems are only as resilient as your cluster. You’ll need to make sure your services can handle losing connection to data by using cached data, displaying error messages, using retry logic to periodically try reconnecting to down services, and similar fault-tolerant methods.
How to test Kubernetes redundancy with Gremlin
So far, we’ve seen how to configure Kubernetes for greater redundancy on both the Pod level and the node level. How do we prove that these techniques will work in a real-world outage? We can use Gremlin to do this.
Gremlin includes a test designed specifically to test your Kubernetes cluster during a node failure. This test works by selecting a worker node in your cluster (you can choose a specific node or let Gremlin choose one at random), then dropping all network traffic to and from it. This has the effect of making the node appear offline, but without actually taking it offline. It’s still connected to the Gremlin Control Plane, so it can report back its status, or halt the test if needed. The load balancer, Kubernetes control plane, and other Pods will all see the node as offline.
Opening the Kubernetes node redundancy test in Gremlin
This test is a Scenario called Kubernetes - Availability - Blackhole a Kubernetes node. Scenarios let you run multiple Chaos Engineering experiments sequentially and/or in parallel. They also support Health Checks, which are automated tests that monitor the state of your systems before, during, and after each experiment. Health Checks are useful for checking the availability and responsiveness of your services in case the Scenario causes something unexpected to happen, like a service outage. If your service doesn’t respond to the Healht Check, or it takes too long to respond, Gremlin will immediately stop the Scenario and roll back its effects on the service as a safety mechanism.
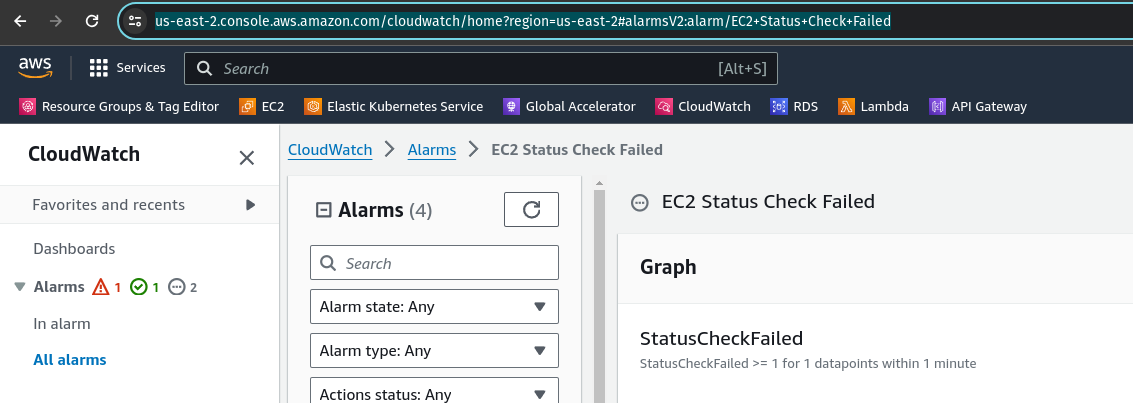
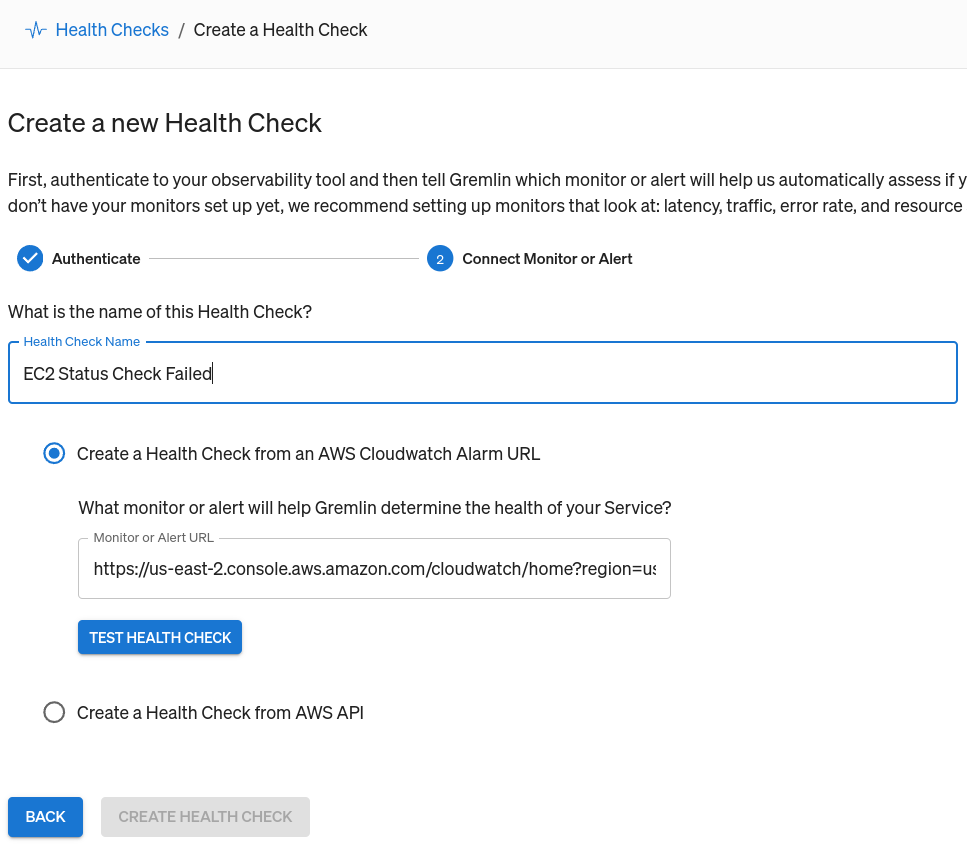
Before we run this Scenario, let’s add a Health Check. Our Kubernetes cluster is running on Amazon EKS, and Gremlin natively supports using AWS Cloudwatch alarms as Health Checks, so we’ll create an alarm that notifies us if any of our deployments falls to 0 replicas. In other words, if our deployments fail to maintain at least one Pod replica, it means our test was a failure and we still have work to do. If the alarm fires, Gremlin will detect this, and will immediately halt the Scenario. This stops the actively running test and immediately returns our systems back to normal. Gremlin natively integrates with a number of other observability tools, and we recommend using your existing monitors or alerts for your Health Checks. You can even use the same metrics and alerts you use for scaling your systems, like ASGAverageCPUUtilization.
Adding a Health Check to a Gremlin Scenario
First, open the Gremlin web app at app.gremlin.com, or click this link to go directly to the Scenario. From this page, click Customize. This brings you to a page where you can change the steps in the Scenario. Under the “Health Checks” heading, click Add Health Check. If you or someone else in your team has already created a Health Check, you can select it here. Otherwise, you can create a new one. For this blog, I’ll be using a Health Check I already created called “Application frontend.”
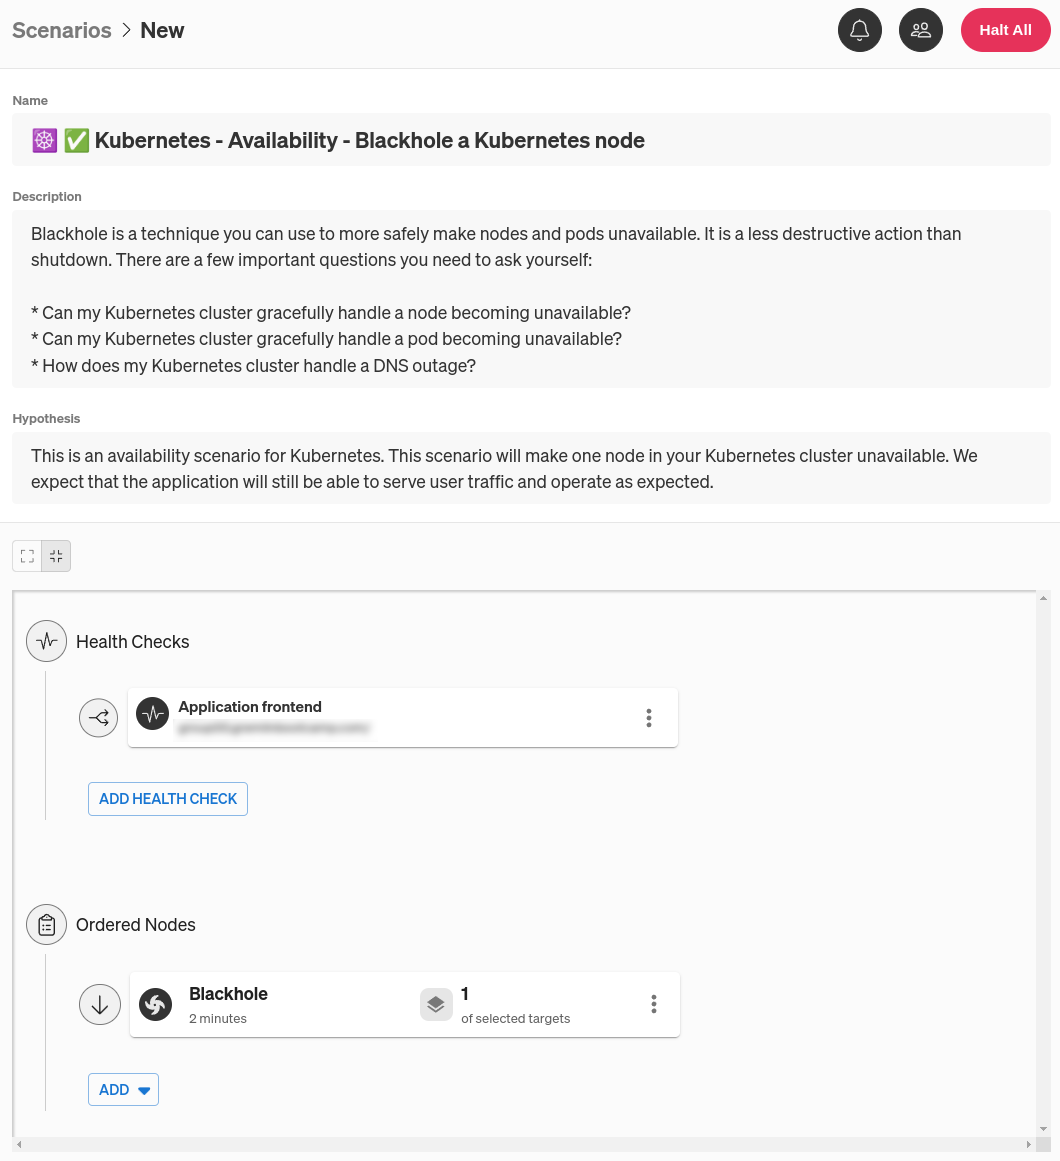
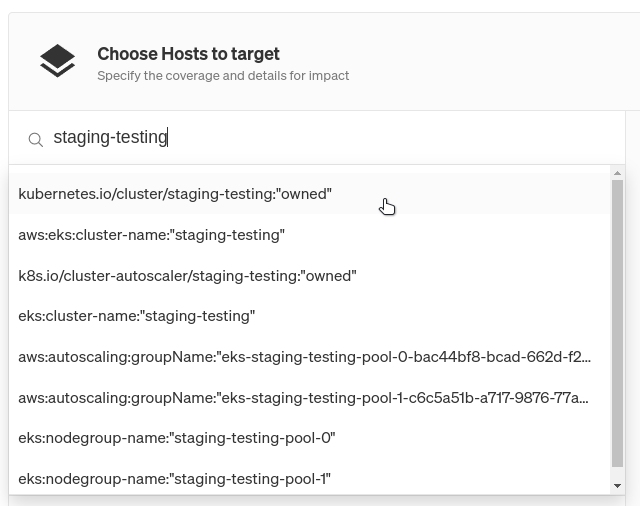
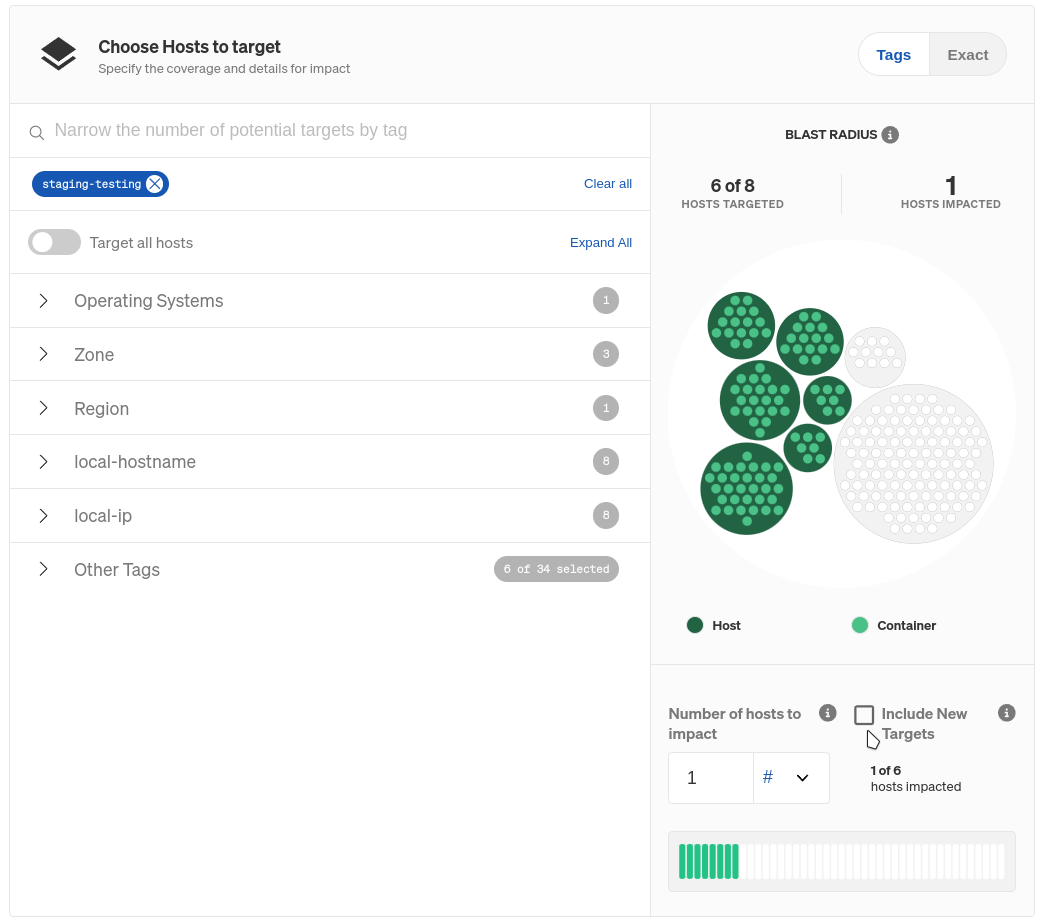
This Scenario only has one step: run a Blackhole experiment for two minutes. Right now, we don’t have any targets selected for this experiment. We can change this by clicking on the menu on the right side of the experiment node, then clicking Edit. This pulls up a pane where we can select which systems to target. You might be tempted to click on the Kubernetes tab, but remember: we’re testing what happens when a node fails, not a Pod or Deployment. Under the Hosts tab, use the tags to find your Kubernetes cluster. An easy way to do this is to use the search box to search for your cluster by name, availability zone, or cloud provider.
If we left our selection as-is, our experiment would impact every node in the cluster. We only want to impact one, so we’ll reduce our blast radius to just one node. The blast radius is the scope of systems that an experiment will run on. To limit this to just one node, change the Percent of hosts to impact to 1, then select # from the drop-down. Also, uncheck Include New Targets to prevent Gremlin from automatically including any newly-provisioned nodes in the test.
Click Update Scenario to save your changes, then click Save Scenario. When you’re ready to run the Scenario, click Run Scenario. The first thing Gremlin does is run the Health Check and ensure your metrics are in a healthy state. Next, the blackhole experiment runs, but before it makes any changes to network traffic, Gremlin randomly selects one of the nodes in our cluster to blackhole. This is done at runtime so we won’t know which node will fail in advance, which better reflects a real-world outage.
So what’s the impact of this experiment? Unsurprisingly, we see one of our nodes become unavailable, and several services also show signs of failing. This isn’t a huge surprise, since we already knew our nodes were single points of failure. Eventually, however, the Pods get spun up on the remaining healthy node, and AWS starts provisioning a new node to replace the failed one. Once the test ends, we’re left with three nodes.
Now, let’s apply our topology constraints and Pod redundancy learnings from earlier in this blog. Now, when we repeat the experiment, our services remain available because we have a minimum of two replicas of each Pod running on different systems. As long as our load balancer properly detects an unavailable node (we can determine this as a side-effect of this experiment), we can confidently say we can tolerate single node failures and single AZ failures.
What other scenarios should I be testing for?
In other blogs, we’ve talked about scaling your systems based on CPU usage, using host redundancy to improve service reliability and availability, and making your services zone redundant. These same techniques and best practices also apply to your Kubernetes clusters. If your Kubernetes cluster is in a single availability zone (AZ), consider spanning it across multiple AZs—or even multiple regions—and increase the scope of your testing to simulate an entire AZ failing.
If you don’t yet have a Gremlin account and want to ensure your systems are scalable, sign up for a free 30-day Gremlin trial and run your first Recommended Scenario in minutes.
Length:
2 minutes
Experiment(s):
Gremlin's automated reliability platform empowers you to find and fix availability risks before they impact your users. Start finding hidden risks in your systems with a free 30 day trial.
sTART YOUR TRIALTo learn more about Kubernetes failure modes and how to prevent them at scale, download a copy of our comprehensive ebook
Get the Ultimate Guide10 Most Common Kubernetes Reliability Risks
These Kubernetes reliability risks are present in almost every Kubernetes deployment. While many of these are simple configuration errors, all of them can cause failures that take down systems. Make sure that your teams are building processes for detecting these risks so you can resolve them before they cause an outage.


These Kubernetes reliability risks are present in almost every Kubernetes deployment. While many of these are simple configuration errors, all of them can cause failures that take down systems. Make sure that your teams are building processes for detecting these risks so you can resolve them before they cause an outage.
Read moreIf you're adopting Kubernetes, you need Chaos Engineering
When Ticketmaster started their Kubernetes migration, they had to address a huge problem: whenever ticket sales opened for a popular event, as many as 150 million visitors flooded their website, effectively causing distributed denial of service (DDoS) attacks. With new events happening every 20 minutes and $7.6 billion in revenue at stake, outages could mean hundreds of thousands in lost sales.


When Ticketmaster started their Kubernetes migration, they had to address a huge problem: whenever ticket sales opened for a popular event, as many as 150 million visitors flooded their website, effectively causing distributed denial of service (DDoS) attacks. With new events happening every 20 minutes and $7.6 billion in revenue at stake, outages could mean hundreds of thousands in lost sales.
Read moreHow to keep your Kubernetes Pods up and running with liveness probes
Getting your applications running on Kubernetes is one thing: keeping them up and running is another thing entirely. While the goal is to deploy applications that never fail, the reality is that applications often crash, terminate, or restart with little warning. Even before that point, applications can have less visible problems like memory leaks, network latency, and disconnections. To prevent applications from behaving unexpectedly, we need a way of continually monitoring them. That's where liveness probes come in.

Getting your applications running on Kubernetes is one thing: keeping them up and running is another thing entirely. While the goal is to deploy applications that never fail, the reality is that applications often crash, terminate, or restart with little warning. Even before that point, applications can have less visible problems like memory leaks, network latency, and disconnections. To prevent applications from behaving unexpectedly, we need a way of continually monitoring them. That's where liveness probes come in.
Read more