
CPU usage is one of the most common metrics used in observability and cloud computing. It’s for a good reason: CPU usage represents the amount of work a system is performing, and if it’s near 100% capacity, adding more work could make the system unstable. The solution is to scale - add more hosts with more CPU capacity, migrate some of your workloads to the new host, and split the traffic between them using a load balancer.
It sounds simple, but in practice, CPU scaling leaves a lot of open-ended questions. At what percentage of CPU usage should you scale? How soon after hitting that limit should you start the scaling process? How do you handle spikes and surges? And at what percentage do you scale back down to avoid paying for under-utilized hardware?
In this blog, we’ll walk through setting, testing, and fine-tuning CPU scaling rules. Reading this blog will give you all of the information you need to set reasonable autoscaling rules and confidently deploy to production.
Why is it common to scale on CPU usage?
Automatic scaling is a fundamental concept in cloud computing. With autoscaling, engineers can add or remove compute capacity to an environment in real-time in response to increasing or decreasing user demand. CPU usage is a common trigger in autoscaling because it’s a direct indicator of how much work a host is performing. As the amount of work increases, so too does CPU usage.
While running out of CPU isn’t as dangerous as running out of RAM or disk space, it can still make your systems unresponsive. It can also have a cascading effect on the rest of your infrastructure: if one host fails due to limited CPU, load balancers may redirect incoming traffic to other hosts, which increases their CPU usage.
How does CPU-based autoscaling work?
There are two main types of scaling: horizontal and vertical.
Horizontal scaling involves adding one or more hosts to create a shared cluster of computing resources. This is typically what “autoscaling” refers to. Each host has its own separate CPU, memory, network card, and storage, and a load balancer or similar solution directs incoming traffic between them. A key benefit of horizontal autoscaling is that it doesn’t need to interrupt service: if we need more capacity, we simply create a new instance, wait for it to finish starting, then migrate our workloads onto it. Likewise, if we don’t have as much work to do and a host becomes idle, we can migrate workloads back to our first host and shut down the second host to reduce costs.
Vertical autoscaling, on the other hand, involves adding capacity to an existing system. This method is more difficult, since the host must be shut down before you can make upgrades. Only specialized equipment like mainframes can swap hardware while running, and even then it’s not nearly as easy as selecting a more powerful CPU from a drop-down list. You could work around this by creating a new host alongside the current one with increased capacity, migrating workloads from the old host to the new, then decommissioning the old host.
The rest of this blog (and generally most content on autoscaling) focuses on horizontal scaling.
How to implement CPU autoscaling
For this blog, we’ll look at autoscaling in AWS. These same principles apply to any cloud platform, though the specific details and steps might be different.
AWS EC2 has a feature called Auto Scaling groups that, as the name suggests, are groups of instances that can automatically scale. You can set a minimum and maximum number of instances, choose the type of instance to add, and load balance across all instances. For scaling, you can use a custom CloudWatch metric, or one of four pre-defined metrics:
- ASGAverageCPUUtilization—Average CPU utilization of the Auto Scaling group.
- ASGAverageNetworkIn—Average number of bytes received by a single instance on all network interfaces.
- ASGAverageNetworkOut—Average number of bytes sent out from a single instance on all network interfaces.
- ALBRequestCountPerTarget—Average Application Load Balancer request count per target.
Source: Amazon EC2 Auto Scaling user guide
After selecting a metric, you also need to set the value where auto scaling is triggered. The AWS auto scaling guide recommends setting this to 40% when optimizing for availability, 70% when optimizing for cost, and 50% when balancing both availability and cost. AWS will also use predictive analysis to try and determine when you’ll exceed your threshold before it happens, letting it scale in advance. GCP and Azure also support similar features.
How to test CPU scalability with Gremlin
So far, we’ve covered the importance of scaling on CPU and how to configure your cloud platform to do so. Let’s make sure our scaling policies work as expected.
Gremlin offers a comprehensive and configurable CPU test that lets you consume any percentage of CPU on a host, container, or Kubernetes resource. Gremlin also provides Scenarios, which let you run multiple tests in sequence or in parallel. Scenarios also let you run Health Checks, automated tests that monitor the state of your systems before, during, and after an experiment. Health Checks are useful for checking the availability and responsiveness of your services in case the Scenario causes something unexpected to happen, like a service outage. If your service doesn’t respond to the Healht Check, or it takes too long to respond, Gremlin will immediately stop the Scenario and roll back its effects on the service as a safety mechanism.
We’ll look at one of Gremlin’s 30+ pre-built Recommended Scenarios: Scalability: CPU. This Scenario runs a series of three CPU tests, increasing from 50% usage to 75% to 90%. This is a great way to test CPU scaling rules, since there are clear delineations between each stage in the Scenario. For example, if we set our scaling threshold at 70%, we’d expect the second and third stages to trigger our autoscaler, but not the first stage.
Before we run this Scenario, let’s add a Health Check. A Health Check is an endpoint that Gremlin periodically checks during the Scenario to determine whether our application is in a healthy state. If the endpoint becomes unavailable, takes too long to respond, or reports an error, Gremlin will immediately halt and revert the Scenario, returning the system to normal. Gremlin natively integrates with a number of observability tools, including CloudWatch, so as a best practice, we recommend using your existing monitors or alerts for your Health Checks. You can even use the same metrics and alerts you use for scaling your systems, like ASGAverageCPUUtilization.
From the Scenario’s details page, click Customize. This brings you to a page where you can change the steps in the Scenario. Under the “Health Checks” heading, click Add Health Check. You can select any Health Check created in your Gremlin team. In this example, I’ll use one I've already created called “Application frontend check.” When you’ve selected your Health Check, click Update Scenario to save and close this pane.
The next step in the Scenario is to run three sequential CPU experiments. There’s a five-second delay in between each experiment to allow CPU usage to return to normal levels before starting the next experiment. This shouldn’t be necessary though, as the Gremlin agent stops consuming CPU the instant the experiment ends.
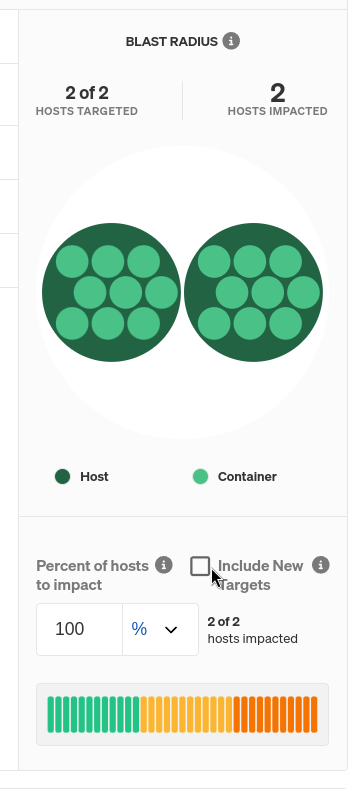
Right now, we don’t have any targets selected for this experiment. We can change this by clicking on the hamburger menu next to the first CPU experiment node, then clicking Edit. Find the host, container, or Kubernetes resource you want to test by using the selection tools. For a basic CPU scalability test, we want to determine whether our cloud platform provisions a new node when average CPU usage exceeds a certain threshold, so we’ll select hosts for our experiment type, then select Target all hosts. It’s important to note that if a target appears during the experiment and it meets the experiment’s selection criteria, it will also run the test. We don’t want this, so we’ll uncheck Include New Targets under the “Blast Radius” section of the screen.
Repeat this step for the other two CPU experiment stages in the Scenario, then click Save Scenario. Now we’re ready to start the Scenario by clicking Run Scenario. The first thing that happens is the Health Check checks our metrics to ensure they’re in a healthy, stable state. Next, the first CPU experiment starts and ramps up our cluster’s total CPU usage to 50%. Since this is below our scaling threshold, nothing should happen other than a sustained, 5-minute bump in CPU usage.
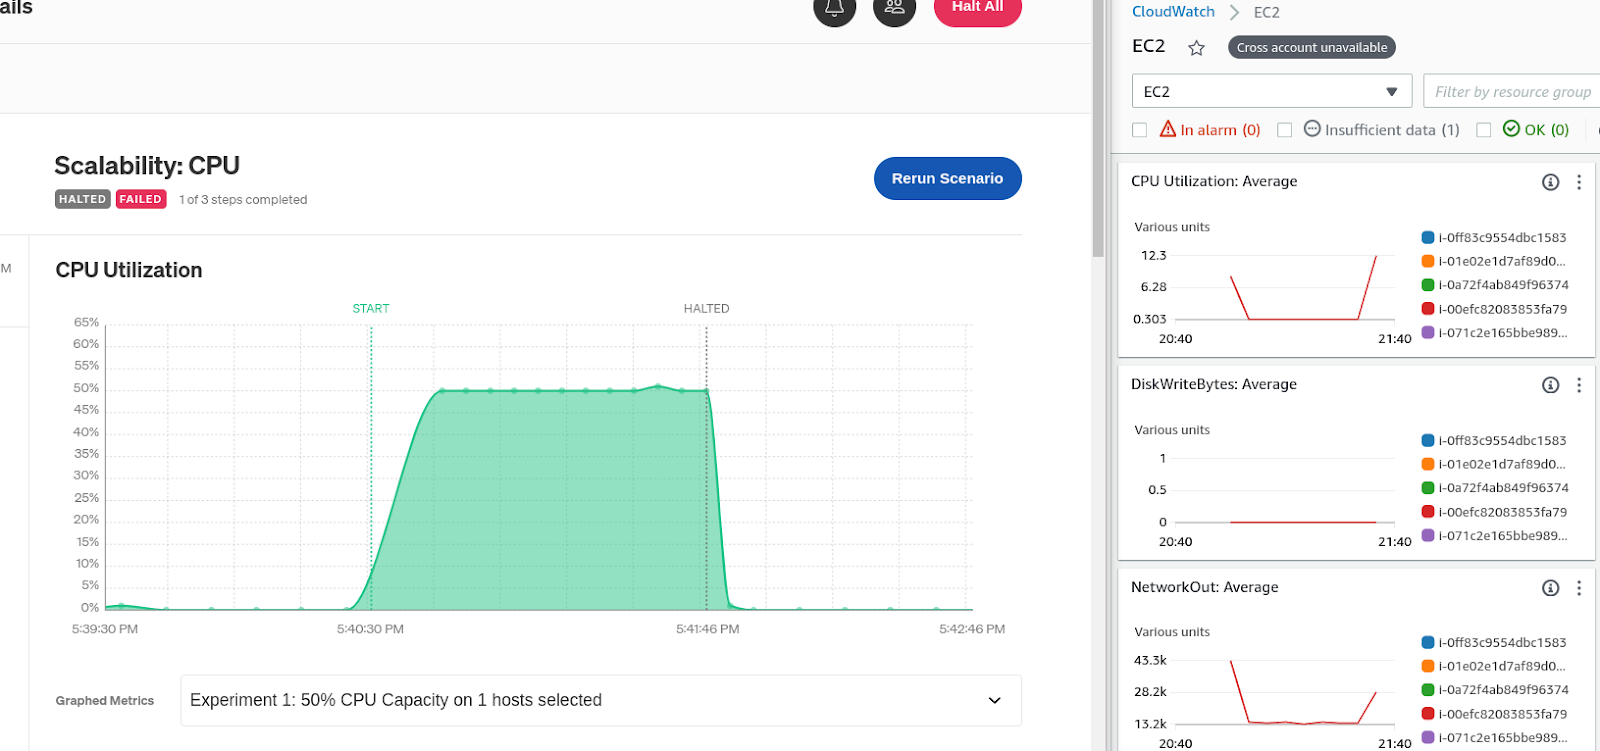
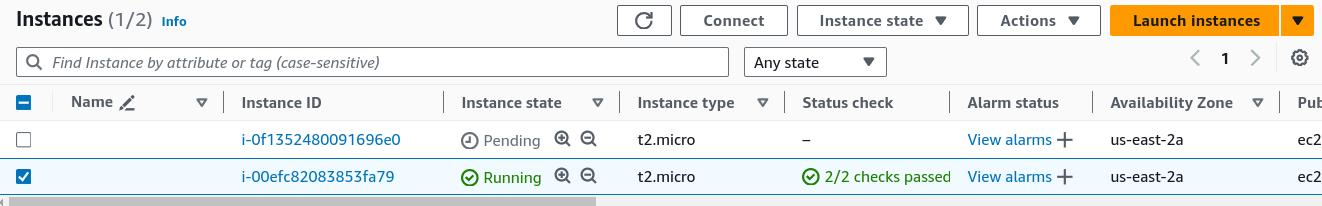
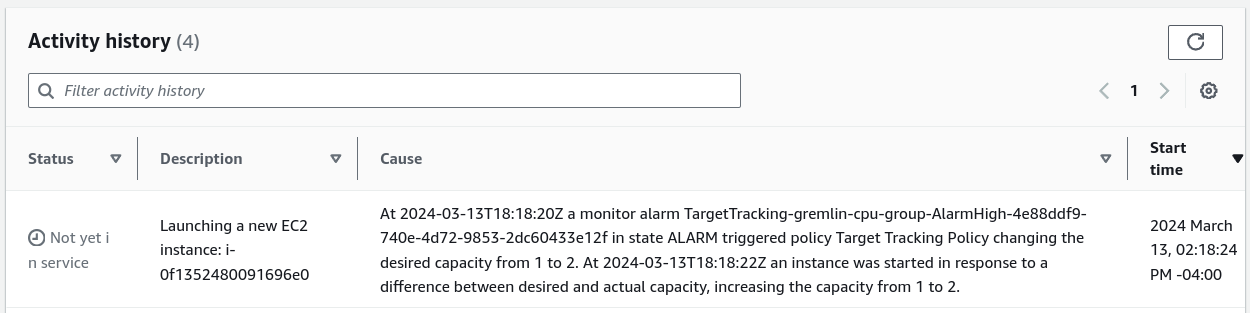
The next experiment is the interesting part. This experiment increases total CPU usage to 75%, which is above our threshold. This means we should see a new host start spinning up in our AWS environment. And if we look, that’s exactly what happens.
Remember how we unchecked “Include New Targets” when configuring the Scenario? This is why: if the new instance starts successfully, and it uses a template with the Gremlin agent pre-installed and pre-configured, Gremlin would distribute the CPU experiment to it as well, driving CPU usage up past 70% again and triggering another autoscale. By leaving it out of the experiment, it will (hopefully) bring average CPU usage back below 70%.
The final experiment, 90%, is the most important, as it represents a sudden, sustained increase in usage. In production, this might be due to a high-traffic event like Black Friday, a viral social media post, or even just regular traffic cycles. In any case, it’s extra important that we get autoscaling right when events like this happen, otherwise we could have more significant failures.
Interpreting the results of your CPU scalability tests
What does this result mean for our systems? At a basic level, it means our autoscaling configuration is working as expected. It means that AWS’ auto-scaler works too, but that’s outside our sphere of control and shouldn’t be the focus of this test.
If we noticed any unusual behavior during the Scenario, like an increase in errors or a significant decrease in throughput, we could use this opportunity to tweak our auto-scaling rules. Maybe instead of scaling at 70%, we'd follow AWS’ performance-optimized guidelines and scale at 40%. Maybe we need to increase the minimum number of concurrent nodes to create a capacity buffer in case of sudden surges, or use more powerful instance types.
If you’d still like guidance around what to set your autoscaling parameters to, check your cloud provider’s recommendations. And whenever you update your rules, remember to run the CPU: Scalability Scenario to validate that they work as expected!
Other ways to prevent CPU exhaustion
Fortunately, CPU exhaustion is easier to recover from, and there are many different tools available for controlling how CPU time is allocated across processes. In Linux, cgroups (short for “control groups”) let you set limits on how much CPU time to allocate to individual tasks, processes, or containers. Cgroups are in turn used by many different process and task management systems, including systemd and Kubernetes. You can also assign a priority (a niceness value) to processes to change how much CPU time is given to a process.
And of course, you can distribute workloads across multiple hosts to take advantage of multiple CPUs and other resources. A common use case is to increase the number of hosts in your environment as CPU usage approaches its maximum and spread your workloads across these hosts, then consolidate and remove hosts as CPU usage decreases.
What other scenarios should I be testing for?
Our previous blog in this series covered memory-based Scenarios, including memory-based scaling, recovering from out-of-memory situations, and testing swap space. CPU and memory are two of the most important resources to manage on cloud platforms, and between these two blogs, you can deploy confidently.
If you don’t yet have a Gremlin account and want to ensure your systems are scalable, sign up for a free 30-day Gremlin trial and run your first Recommended Scenario in minutes.
Length:
15 minutes
Experiment(s):
Gremlin's automated reliability platform empowers you to find and fix availability risks before they impact your users. Start finding hidden risks in your systems with a free 30 day trial.
sTART YOUR TRIALGetting started with CPU attacks
The CPU attack is one of the most common attack types run by Gremlin users. CPU attacks let you consume CPU capacity on a host, container, Kubernetes resource, or service. This might sound like a trivial exercise, but consuming even small amounts of CPU can reveal unexpected behaviors on our systems. These behaviors can manifest as poor performance, unresponsiveness, or instability.


The CPU attack is one of the most common attack types run by Gremlin users. CPU attacks let you consume CPU capacity on a host, container, Kubernetes resource, or service. This might sound like a trivial exercise, but consuming even small amounts of CPU can reveal unexpected behaviors on our systems. These behaviors can manifest as poor performance, unresponsiveness, or instability.
Read moreHow to ensure your Kubernetes Pods have enough CPU
A common risk is deploying Pods without setting a CPU request. While it may seem like a low-impact, low-severity issue, not using CPU requests can have a big impact, including preventing your Pod from running. In this blog, we explain why missing CPU requests is a risk, how you can detect it using Gremlin, and how you can address it.

A common risk is deploying Pods without setting a CPU request. While it may seem like a low-impact, low-severity issue, not using CPU requests can have a big impact, including preventing your Pod from running. In this blog, we explain why missing CPU requests is a risk, how you can detect it using Gremlin, and how you can address it.
Read more