.png)
In an earlier blog, we looked at slow dependencies and how they can impact the reliability of other services. While we explored what happens when dependencies are degraded, what happens when dependencies outright fail? What can you do when your application or service sends a request to another service, and nothing comes back?
We’ll answer this question by using Gremlin to proactively test a service with multiple dependencies. You’ll learn how to prepare your services for dependency failures, how to ensure your services can withstand losing dependencies, and how you can use your learnings to increase availability and better serve your customers.
What are service dependencies, and what are the risks of them failing?
In the context of this blog, a dependency is a service that provides extra functionality to other services. Dependencies can include SaaS (Software as a Service) services, services managed by other teams in your organization, and even transitive dependencies (dependencies of dependencies). Consider the classic LAMP (Linux, Apache, MySQL, PHP) stack: applications are written in PHP but store data in MySQL, making MySQL a dependency of the application.
Any large or mature application will likely have a complex chain of services that rely on output from other services. Because this chain is essential to the application’s operation, teams need to ask: “what happens if one of the links in this chain breaks?”
The impact is similar to slow dependencies:
- Services can get stuck waiting for a response, resulting in long wait times for users.
- Services with incomplete or missing error logic might crash, or worse, surface up internal error messages to users.
- Failover and redundancy systems might not work as expected, leading to unexpected or undefined behaviors.
Like mentioned in the last blog, service dependencies are different from code dependencies. Code dependencies (or libraries) get imported into an application’s source code during development. Service dependencies aren’t a part of your application, but are hosted separately and are typically interacted with over a network connection.
How to prepare your services for failed dependencies
The challenge with dependencies is that they’re not always under your control. A dependency managed by another team in your organization is one thing, but what happens when you start integrating third-party dependencies? If you rely on a cloud platform provider to host your database, and the provider has a region outage, how will you handle losing access to your critical data?
The key to responding to failed dependencies is to “fail fast.” In other words, detect unavailable dependencies quickly, and have a fallback plan in place. This also means providing feedback to users, even if it’s a simple error message. Making users wait for a request to a failed dependency to inevitably timeout is a poor user experience, and in the case of websites, will make a third of all users bounce. But how can this work in practice? Here are several recommendations for making your services dependency fault-tolerant.
Asynchronous communication
When sending a request to a dependency, you can’t always expect an immediate response, even if the dependency is located in the same availability zone, VPC (virtual private cloud), or even on the same host. Sending requests synchronously means pausing the execution of your service to wait for a response. Even if the dependency is available, synchronous requests can process slowly due to poor network performance, higher than normal traffic, or random packet latency.
This is why most modern programming languages have libraries for asynchronous communication. Libraries like Javascript’s Promises and Python’s asyncio send requests and immediately continue executing the program, then handle the response (or failure) whenever it arrives. This lets you perform other actions, such as showing a loading icon or rendering parts of the page, while waiting for the dependency to respond. You can also increase the timeouts for requests to allow for short interruptions in connectivity.
Redundant services
Redundancy is a requirement for mission-critical applications, but it’s tricky to implement. With dependencies, it’s even harder.
Generally, redundancy means having two or more replicas of the same service so that if one fails, the other can take over its workloads. For a simple LAMP application, this could mean running multiple instances of the same application and database on two or more separate hosts, replicating data from the primary host to the backup instances, and using a load balancer to redirect traffic from unhealthy hosts to healthy hosts. This assumes you have control over the infrastructure you want to make redundant, which of course, isn’t guaranteed with dependencies.
Some services have built-in tools to provide some redundancy. For example, Amazon DynamoDB automatically replicates database writes across multiple availability zones within a region. There are also cases where hosted services don’t have redundancy features, but the underlying technology does. With MySQL, you can configure a single source database, which sends copies of data to one or more replica databases. This means you can host your primary instance on a service like Amazon RDS, and host backup instances on Azure Database for MySQL, Google Cloud SQL for MySQL, or even on-premises.
Caching and queueing messages
Instead of sending requests directly from your service to its dependencies, there’s another approach: using an intermediary. Message queue services like RabbitMQ and Apache Kafka are often used to decouple services from one another by creating channels (or classes) for messages to flow through. This is known as the publish-subscribe (or pub/sub) pattern. These services work by taking requests from publishers (i.e. your application) and temporarily storing them to be consumed by subscribers (i.e. the dependency). Not only does this allow for asynchronous and distributed communication with dependencies, but it also lets you scale up the number of producers or subscribers in response to increasing or decreasing traffic.
For example, imagine we have an online banking application with a service specifically for sending emails to users. Other services—such as the account management, authentication, and transaction processing services—use this email service to notify customers. Instead of sending requests directly from these services to the email service, we could place a message queue between them. Now, messages get sent to a message queue, and the email service periodically retrieves and processes messages from the queue. Now, the upstream services don’t have to worry about checking if the dependency is online, and if the email service gets backed up, we can very easily scale it up by creating more replicas.
Message queues do have a major downside, however: they’re another service to have to maintain. You might not have to worry about detecting dependency failures in your code, but you do have to worry about your message queue failing. You’ll still need to add circuit breakers, fallback logic, and retries to your application code. Message queue libraries will almost always have this functionality built-in, but you’ll still need to test your services to ensure it works as expected.
How do you test your resilience to failed dependencies?
Making your service dependency-resilient is only the first step. Now, you need to test your service to demonstrate that your remediation works. Unfortunately, we can’t just wait for a dependency to fail on its own. Service providers work hard to ensure their services are always available, and they certainly won’t take their services offline so you can test your own.
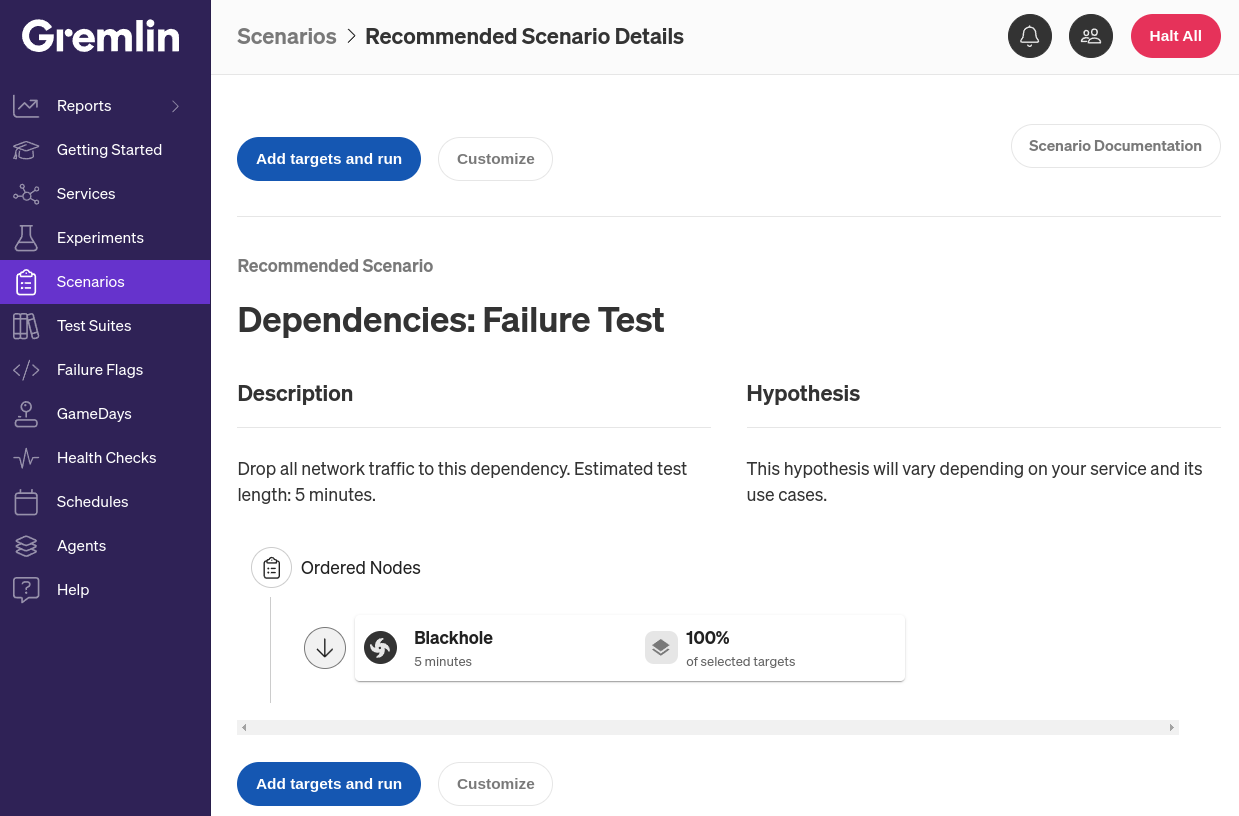
Gremlin’s Dependencies: Failure Test Scenario was designed exactly for this use case. A Scenario is a workflow for running one or more Chaos Engineering experiments sequentially or in parallel. This specific Scenario uses what we call a blackhole experiment, which drops network traffic to and from the target. The experiment works on IP packets, so you can fine-tune it to target only specific kinds of traffic based on hostname, port number, IP address, and other attributes. This lets you recreate a failure in a specific dependency without having to take that dependency offline, and without interrupting traffic to any other dependencies or services.
Creating and configuring a dependency failure Scenario in Gremlin
Gremlin’s blackhole experiment drops all network traffic to and from a target, whether it’s a host, container, Kubernetes resource, or service. However, you can customize blackhole (and other network) experiments to impact only specific kinds of network traffic. Continuing with our bank example, this screenshot shows how we can configure an experiment to drop only traffic to a MySQL database at the hostname ledger.bank-of-anthos.gremlin-lab:
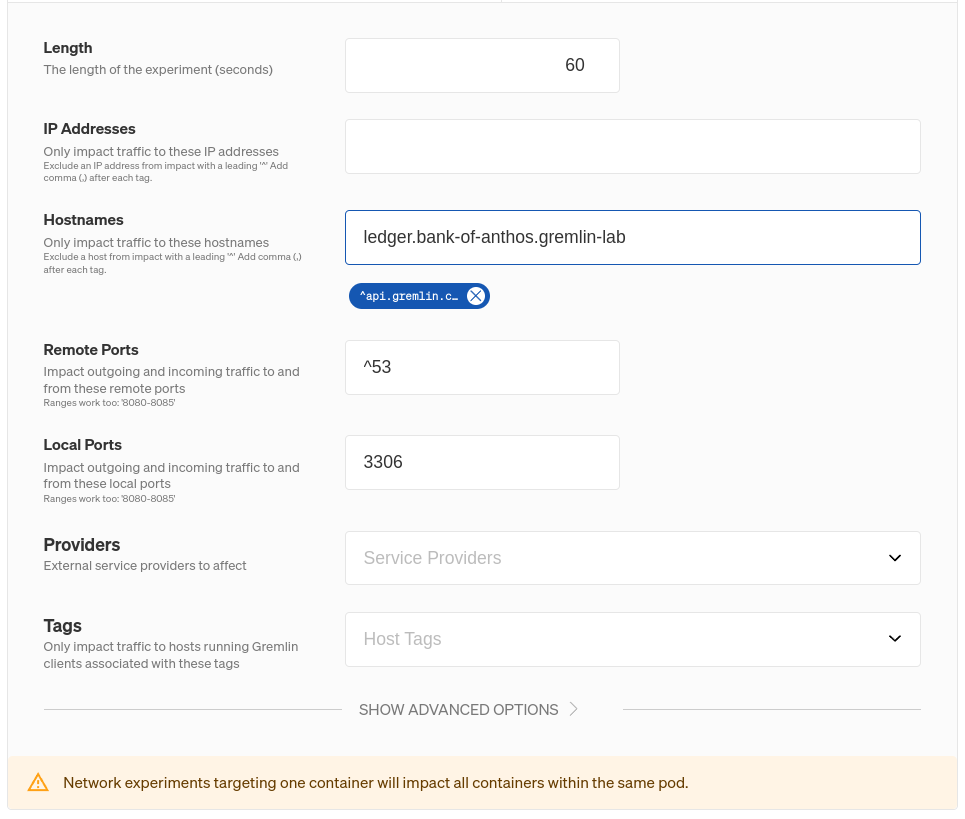
If we ran this experiment on our frontend service, then all network packets sent to or received from ledger.bank-of-anthos.gremlin-lab will be dropped. This only affects the frontend: all other services—including the ledger service itself—won’t be affected. Any traffic that the frontend sends to other dependencies won’t be affected either. Limiting the scope of an experiment is an important part of Chaos Engineering and reliability testing for two key reasons:
- It reduces the scope of systems impacted by the experiment, making it easier to observe and form conclusions about how the system behaves.
- If something goes wrong and a problem occurs, it limits the potential reach of the problem, making it easier to troubleshoot and recover.
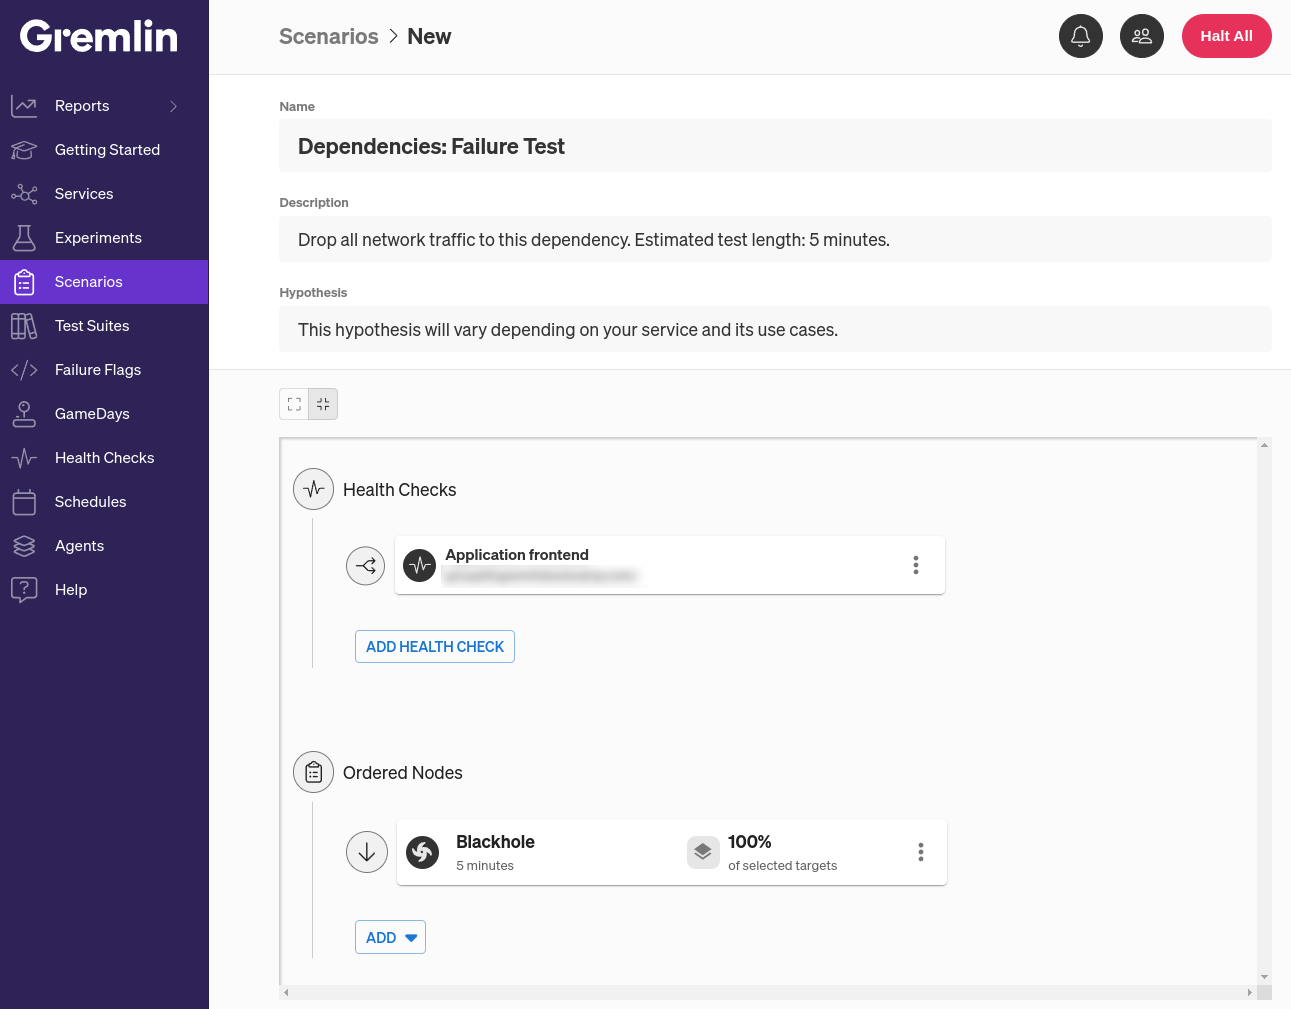
There’s another way we can improve this Scenario, and that’s by adding a Health Check. A Health Check is a periodic check that Gremlin makes to verify that a service is still responsive during testing. If the check returns a healthy status code with a response time that falls within our criteria, then the Scenario keeps running. Otherwise, Gremlin immediately stops the Scenario and returns the service to its normal state to prevent an incident or outage. Gremlin natively integrates with several observability tools including Amazon CloudWatch, Datadog, Prometheus, and Grafana, and you can leverage your existing monitors or alerts as Health Checks instead of creating brand new ones.
To configure the Scenario and add the Health Check, first open the Gremlin web app at app.gremlin.com, or click this link to go directly to the Scenario. From this page, click Customize. This brings you to a page where you can change the steps in the Scenario. Under the “Health Checks” heading, click Add Health Check. If you or someone else in your team has already created a Health Check, you can select it here. Otherwise, you can create a new one. For this blog, I’ll be using a Health Check I’ve already created called “Application frontend” that simply sends pings our website’s frontend and expects a response within two seconds.
The next step is to select targets for this experiment. The target is the system or service that the experiment will run on, not the dependency. We can only test our own service’s ability to handle slow and failed dependencies—we can’t test the resilience of the dependency itself. That’s the responsibility of the dependency’s owner, whether that’s another team in our organization or a third party provider, like a cloud platform.
Clicking on the three-dot menu icon on the right side of the experiment node and selecting Edit opens a pane where you can select which systems to target. In the Bank of Anthos demo application, the frontend is a Kubernetes Pod, so click the Kubernetes tab, expand Deployments, and select frontend. You can also use the search box just below the cluster name, and switch between clusters or namespaces using the drop-down boxes.
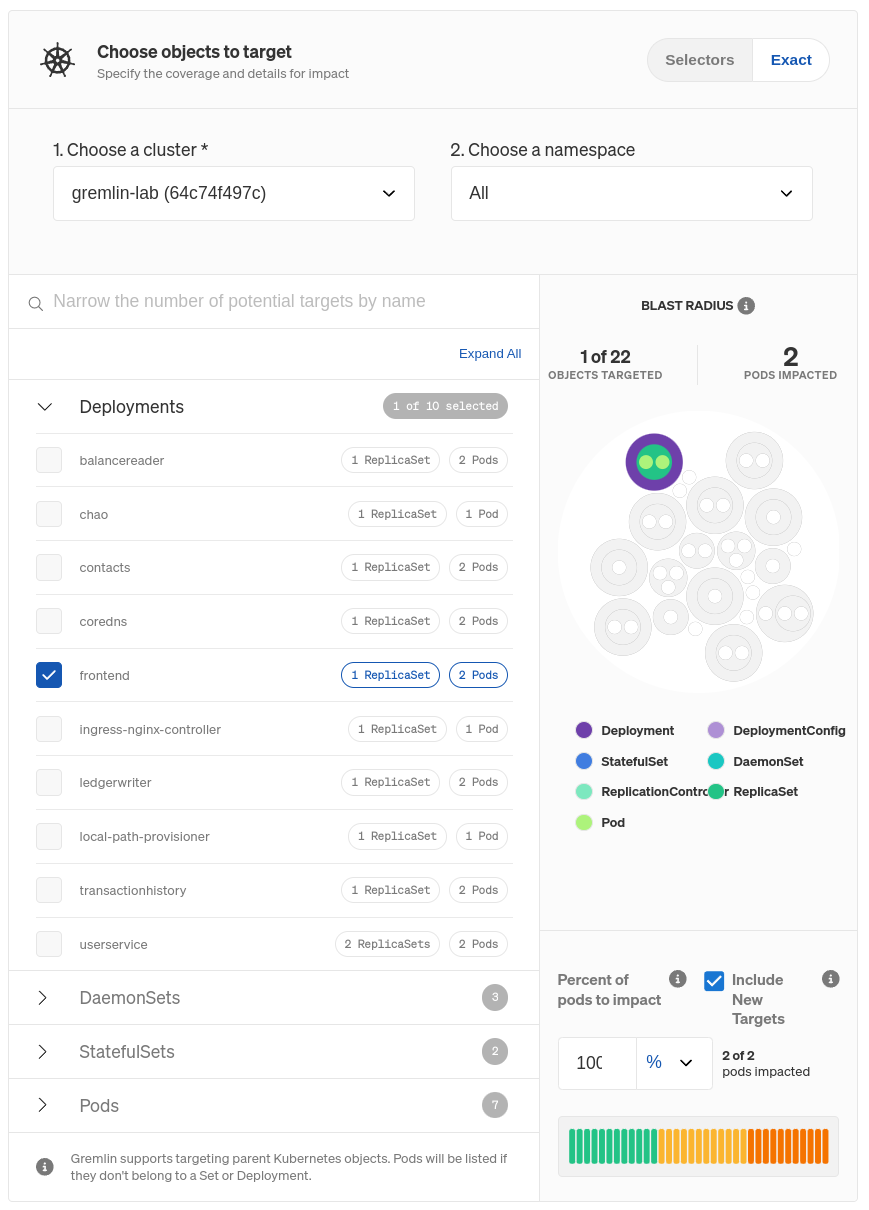
Once you choose your target(s), you’ll see it highlighted to the right. This shows the resources that will be directly impacted by the experiment. Below that, you can specify the number or percentage of Pods within the Deployment to target, assuming you don’t want to target all of them. If you reduce this number, Gremlin will randomly choose targets from the pool of available targets until it meets the number or percentage you specify. You can also choose whether to include Pods that are created while the experiment is running. You’ll want to keep this enabled, otherwise traffic might flow through those newly created Pods and bypass the experiment.
Click Update Scenario to save your changes, then click Save Scenario. When you’re ready to run the Scenario, click Run Scenario. The first thing Gremlin does is run the Health Check and ensure your service is in a healthy state. Next, the blackhole experiment starts. While it’s running, we should see the service stop sending network packets to the dependency and stop receiving packets from the dependency.
Without knowing how the experiment will end, there are a few different possible outcomes:
- The website works normally. This tells us the dependency is a soft dependency—in other words, our website still works normally even when the dependency is unavailable.
- The website works, but there’s missing content or errors. This means we can tolerate this dependency failing, but we might want to find ways to better handle the failure. This might mean making the error messages more user-friendly, or disabling functionality related to the dependency until it comes back online.
- The website stops working. This is the worst-case scenario, since it means the dependency is a hard dependency of our website. If these two services can’t function properly independently, then we might consider bundling and deploying them together. In a Kubernetes environment, we could run them as two containers within the same Pod. In a bare-metal environment, we’d need to deploy both services to the same hosts.
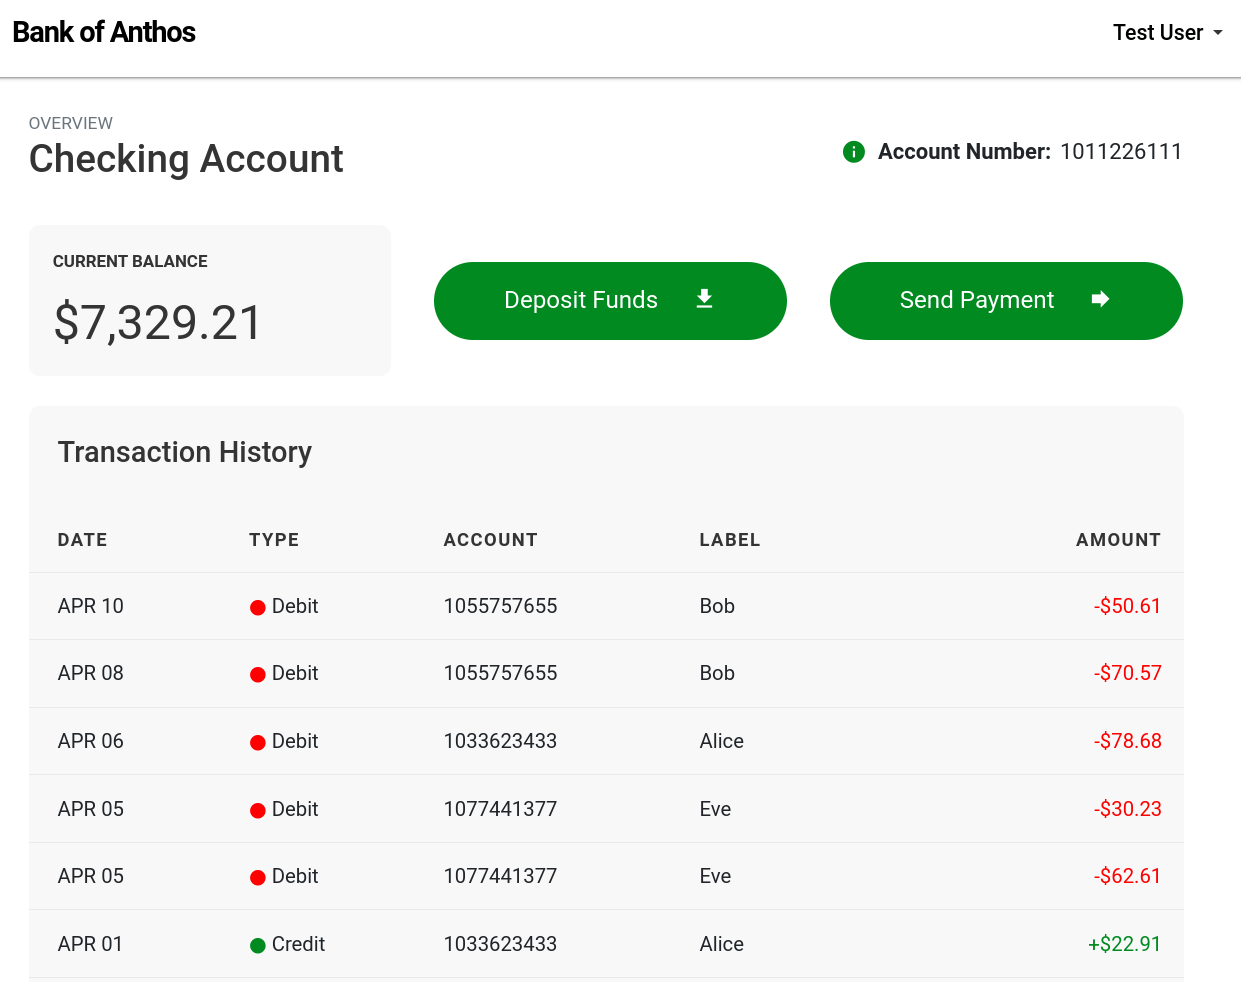
Going back to our actively running Scenario, here’s what our frontend looks like under normal, healthy conditions:
Once the blackhole experiment starts, we can see the impact of losing our ledger:
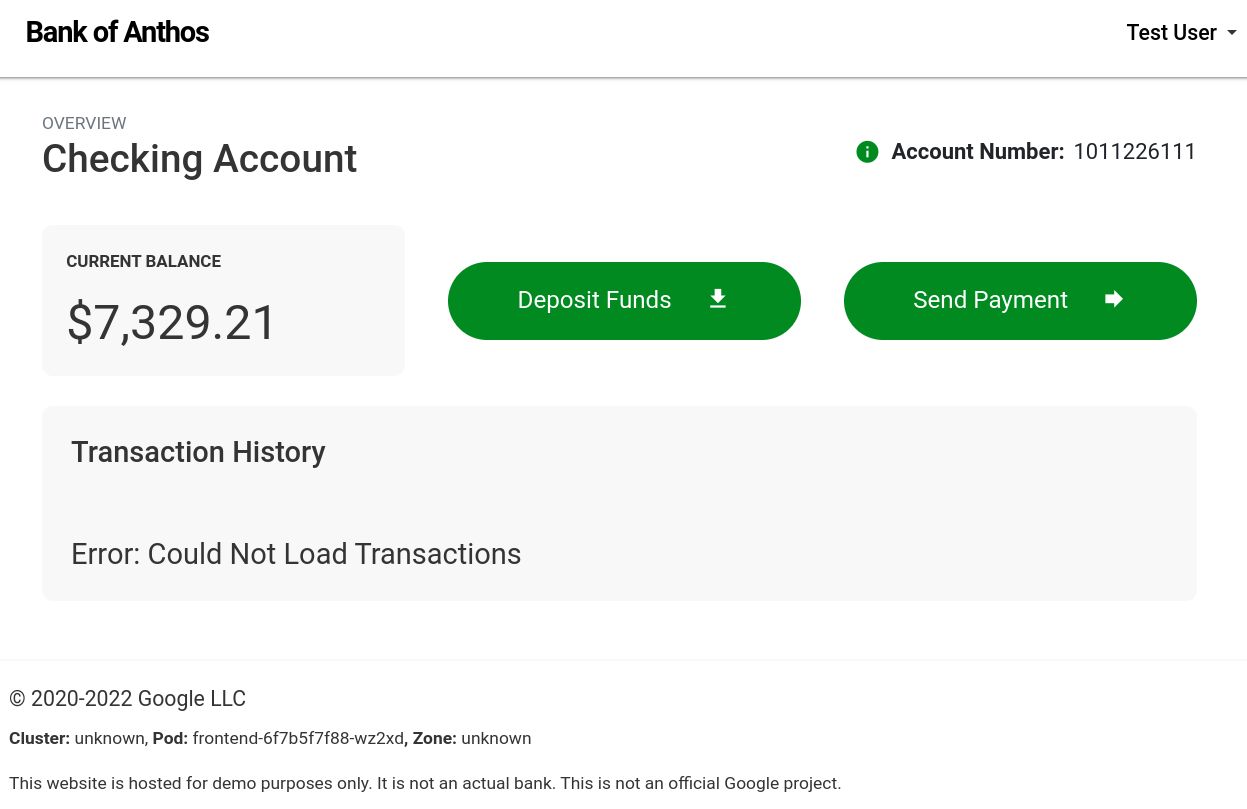
This means that for our frontend, the ledger falls squarely into the second bucket of dependency types. The website still works and is usable, but we’ve lost critical functionality. Interestingly, we can still deposit and send funds, since they rely on a separate service (the balancereader) instead of the transactionhistory service. We can confidently say that our frontend is resilient to a transactionhistory failure, but since this is a critical part of the website, we’ll still want to invest engineering effort into making it redundant.
Automating dependency failure tests at scale
We’ve walked through configuring and running a dependency failure test on a single service, but this isn’t the only dependency in our environment. Our frontend has nearly a dozen other dependencies, and each of those dependencies has their own dependencies. Instead of running hundreds of individual tests, we can use Gremlin’s Reliability Management feature to automate this for us.
First, we need to define each of our services in Gremlin. This simply means selecting the hosts, containers, Kubernetes resources, and processes that make up a service. Alternatively, you can use annotations to let Gremlin automatically detect and add your services for you. In either case, Gremlin will automatically detect dependencies that the service communicates with.
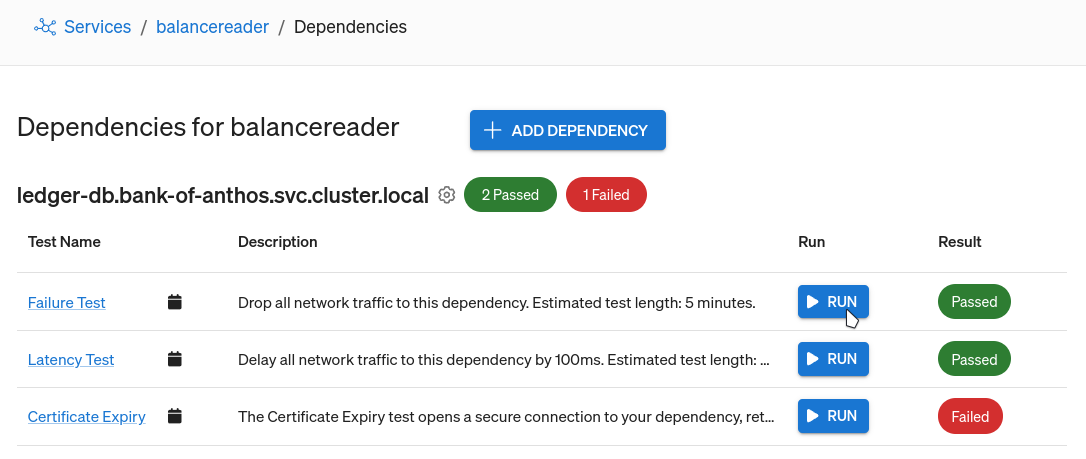
If you’re using the default Gremlin Recommended Test Suite, each dependency will have an associated Dependency Failure test that recreates the exact scenario we tested for in this blog. All you need to do is find the dependency you want to test, and click Run.
If you don’t yet have a Gremlin account and want to start testing your dependencies, you can sign up for a free 30-day trial.
Length:
10 minutes
Experiment(s):
Gremlin's automated reliability platform empowers you to find and fix availability risks before they impact your users. Start finding hidden risks in your systems with a free 30 day trial.
sTART YOUR TRIALTo learn more about Kubernetes failure modes and how to prevent them at scale, download a copy of our comprehensive ebook
Get the Ultimate GuideHow dependency discovery works in Gremlin
Gremlin’s dependency discovery automatically finds your services’ dependencies and tests their resiliency, giving you a complete view of your reliability. Learn how it works in our latest blog.


Gremlin’s dependency discovery automatically finds your services’ dependencies and tests their resiliency, giving you a complete view of your reliability. Learn how it works in our latest blog.
Read moreHow to identify and map service dependencies
Modern applications are a web of interdependent services. As applications grow in size and complexity, and as more engineering teams adopt service-based architectures like microservices, this web becomes deeper and denser. Eventually, keeping track of the interdependencies between services becomes a complex and time-consuming task in and of itself. In addition, if any of these dependencies fails, it can have cascading impacts on the rest of your services and on the application as a whole.

Modern applications are a web of interdependent services. As applications grow in size and complexity, and as more engineering teams adopt service-based architectures like microservices, this web becomes deeper and denser. Eventually, keeping track of the interdependencies between services becomes a complex and time-consuming task in and of itself. In addition, if any of these dependencies fails, it can have cascading impacts on the rest of your services and on the application as a whole.
Read moreHow to make your services resilient to slow dependencies
Our applications increasingly rely on services we don’t control. What happens when those services become unreliable? This blog post explains how to build software that stays available and responsive, even if your dependencies aren’t.
Our applications increasingly rely on services we don’t control. What happens when those services become unreliable? This blog post explains how to build software that stays available and responsive, even if your dependencies aren’t.
Read more