
Modern applications can easily include hundreds of discrete services, all of which need to be reliable in order for the application to function correctly. While running tests on a handful of critical services can lead to small reliability improvements, real impact requires testing and increased reliability visibility across your entire organization.
That’s the logic behind the new, improved Reliability Reports within Gremlin.
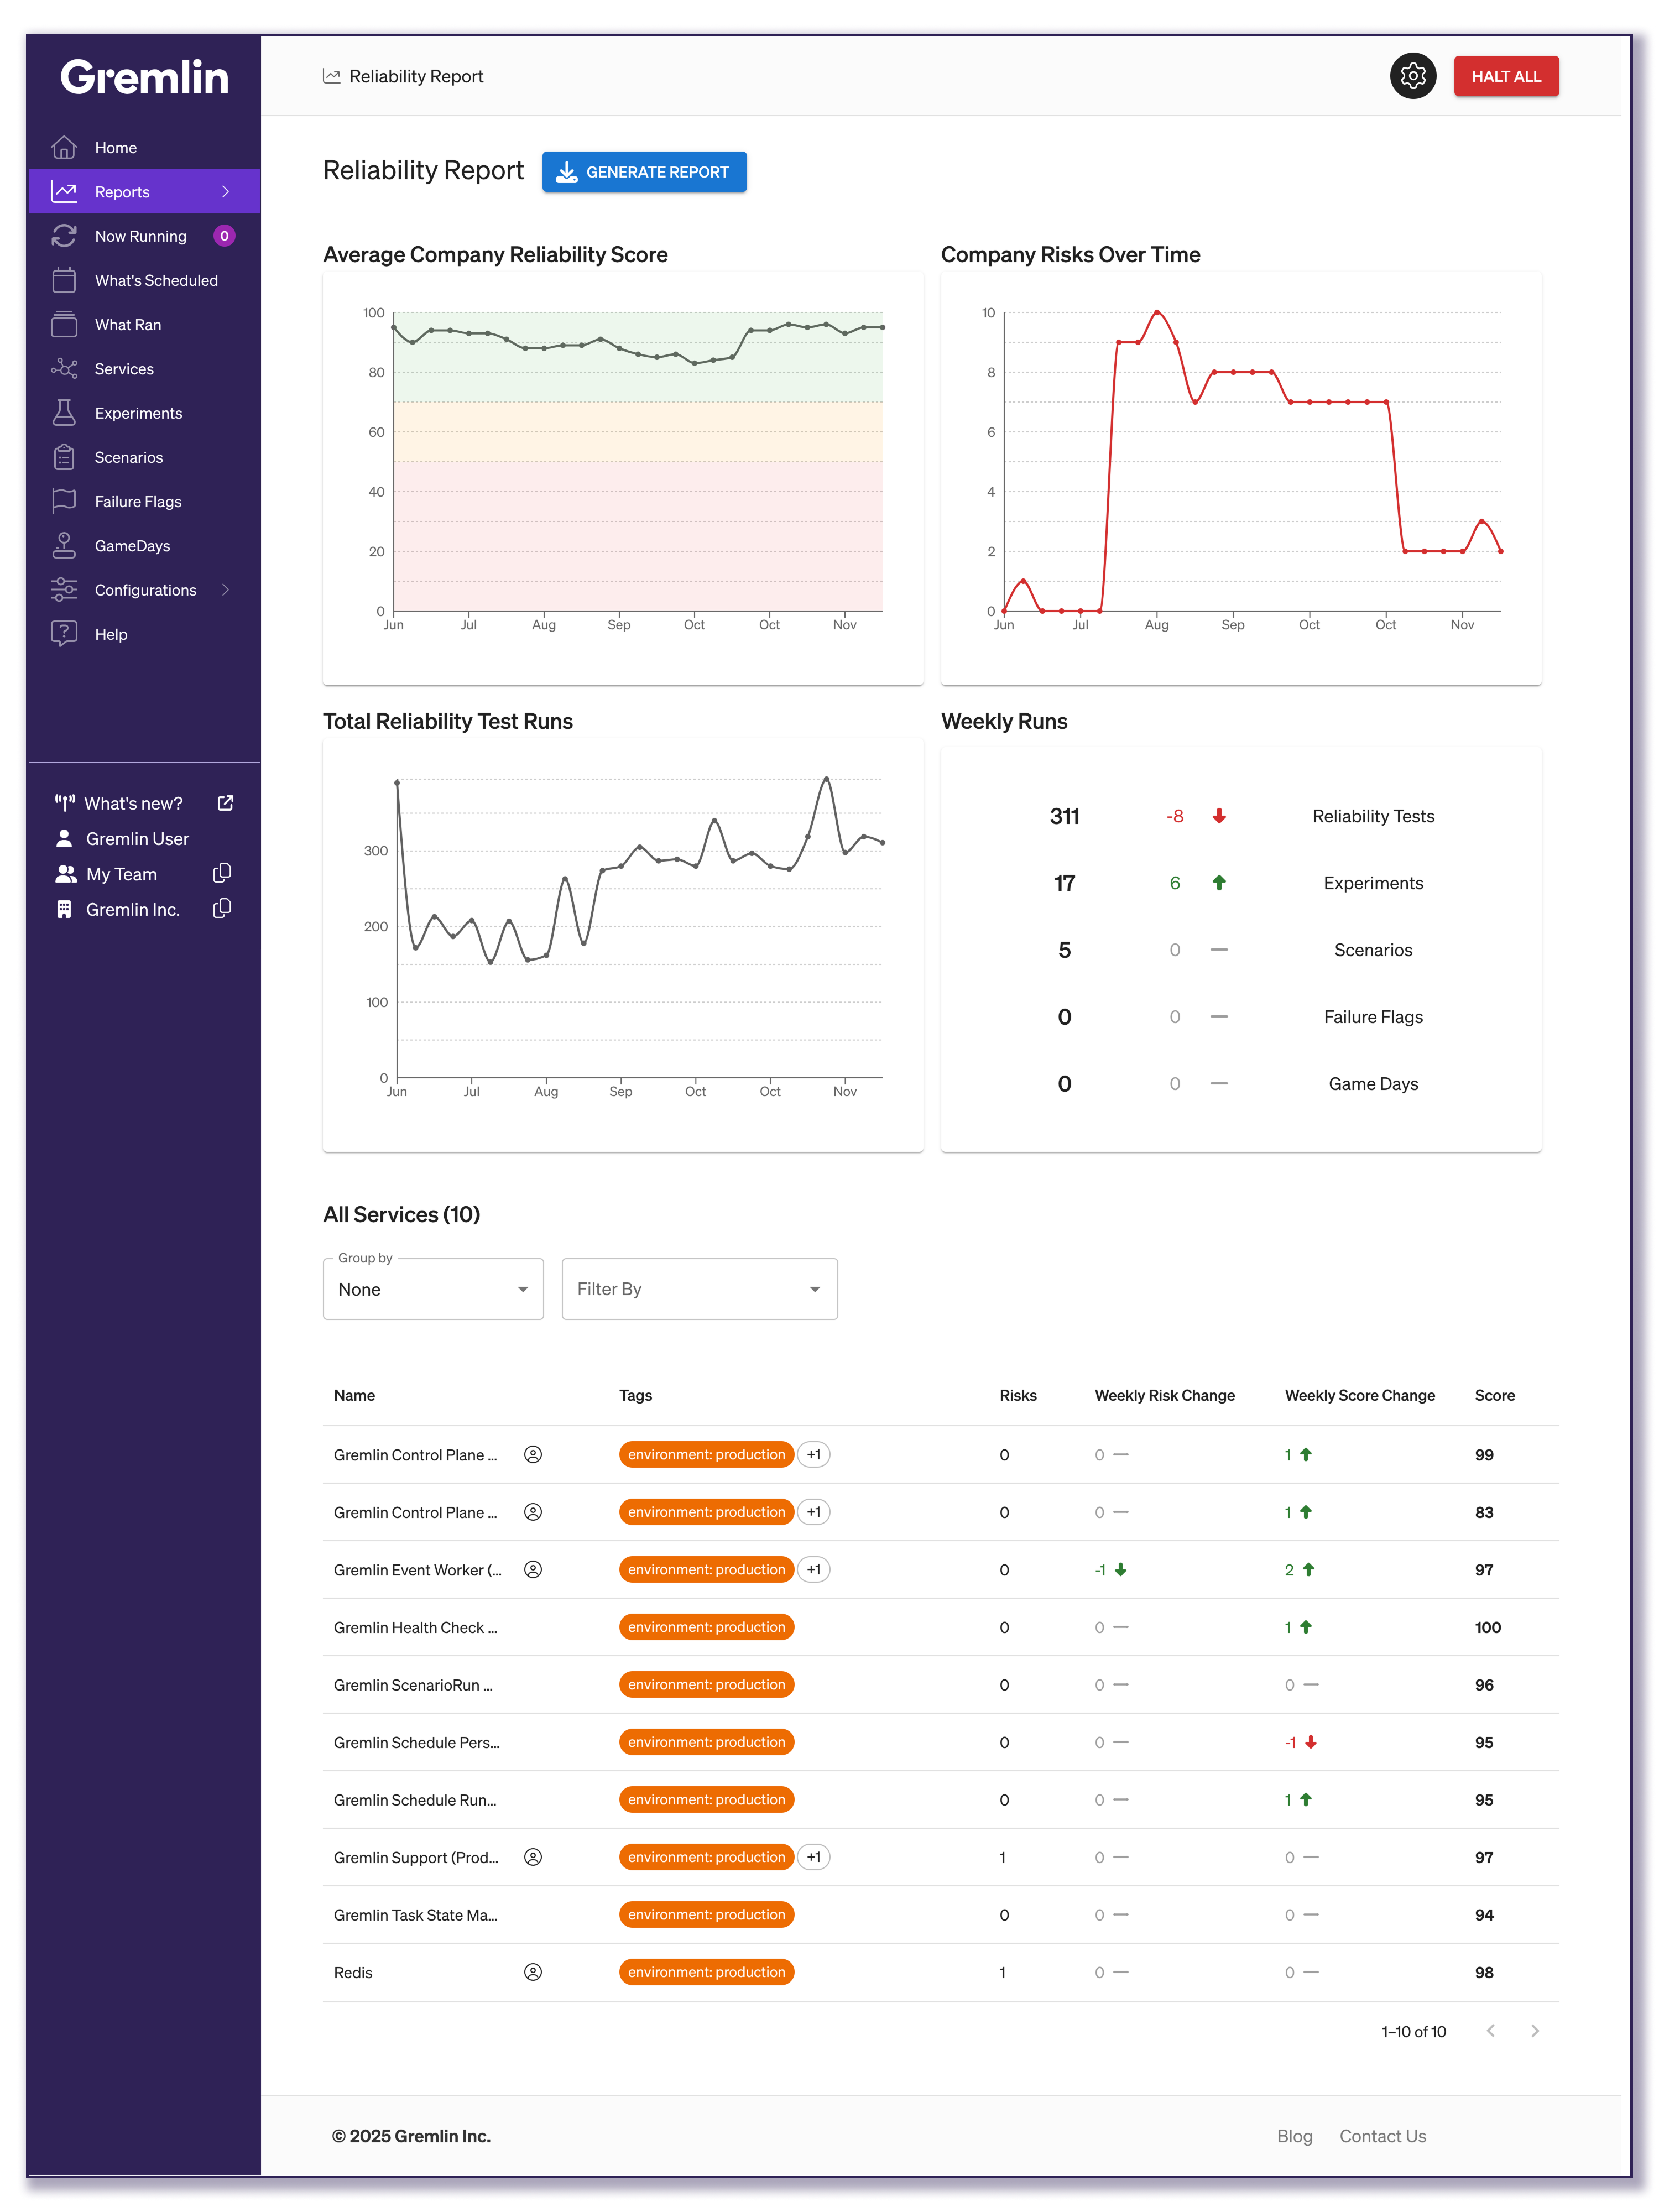
Reliability Reports give leaders high-level visibility into system reliability across the company, including the reliability score, detected risks, number of tests run, and more. By using the Reliability Reports, leadership can keep track of the effectiveness of their efforts, get visibility into the current reliability of their systems, and see how individual services impact the reliability of the entire system.
In this blog, we’ll dig into what’s in the Reliability Report, how to make the best use of it, and give you an example of how we’ve improved our own reliability with it.
What data’s in the Reliability Report?
The reliability report pulls data from across your company into a dashboard layout, so let’s dig into each section and what it means to your reliability.
Average Company Reliability Score
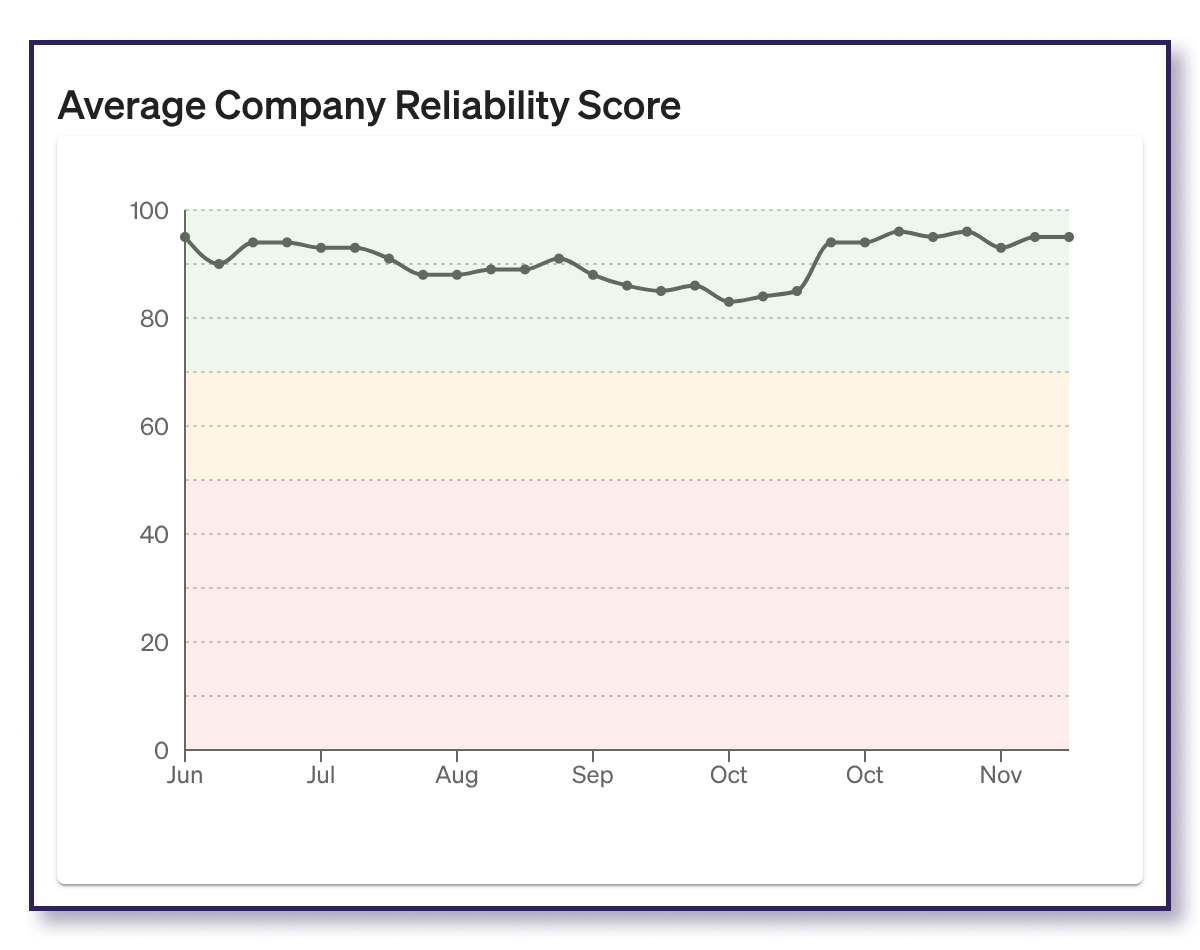
This is your high-level overview of your system’s reliability. Pulled from the reliability scores of all your services, it gives you an average score over the last six months. Use this to monitor reliability trends and get a general sense of the dips and rises in your reliability.
It also includes color-coding to help you tell your general reliability at a glance. Scores in the green section (above 70) are considered good, scores between 70 and 50 in the yellow section are fair, and any under 50 in the red are poor.
Company Risks Over Time
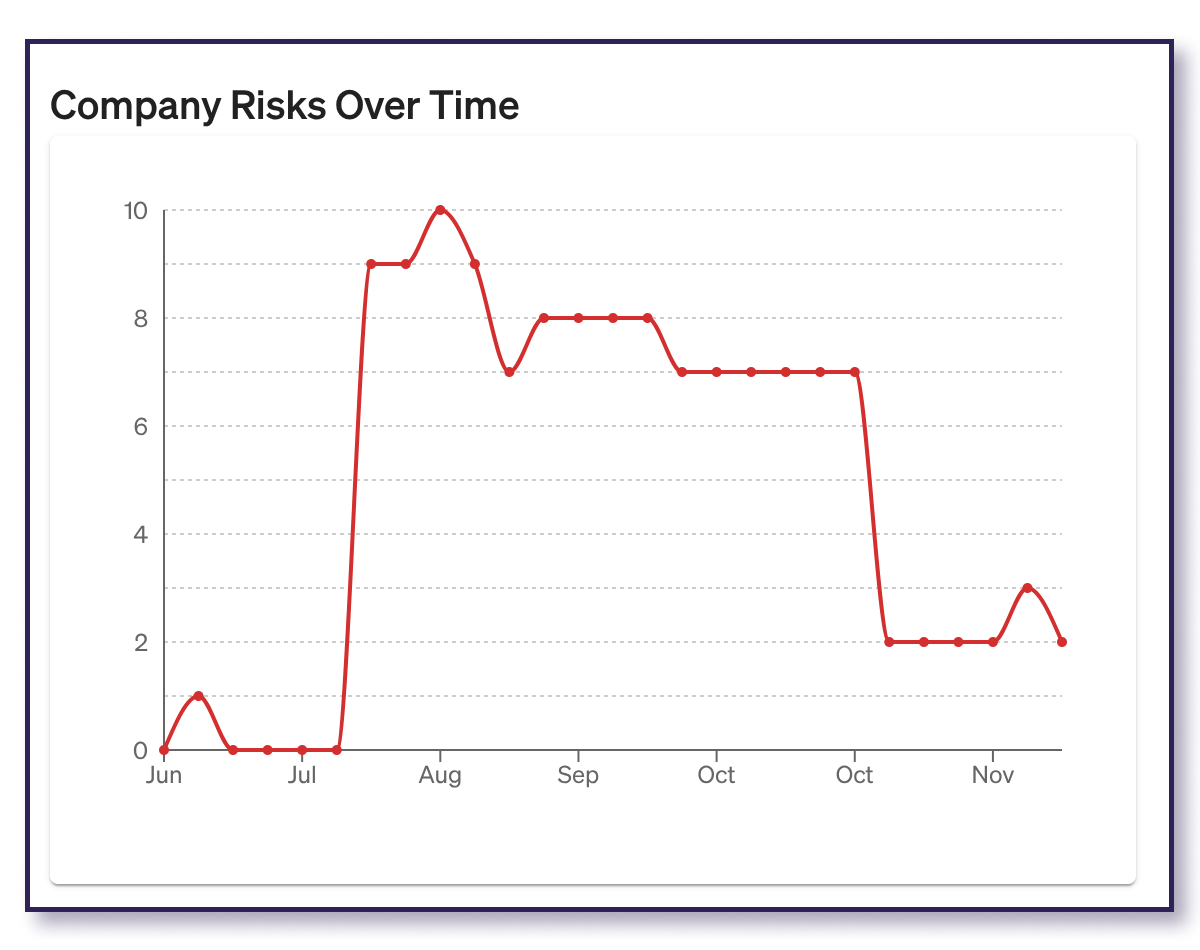
Detected Risks automatically surfaces 18 different reliability risks without running tests, including common Kubernetes and cloud configuration or status risks. For each of your services, these risks will be flagged as either At Risk, Mitigated, or N/A (if it can’t be detected or isn’t relevant for your service).
On an organizational level, the important status here is “At Risk,” and this graph gives you an aggregate count of all unaddressed risks across your company. It will go up and down over time as new code is deployed and your system changes, but this shows you when it’s time to check in and see what shifted.
Total Reliability Test Runs
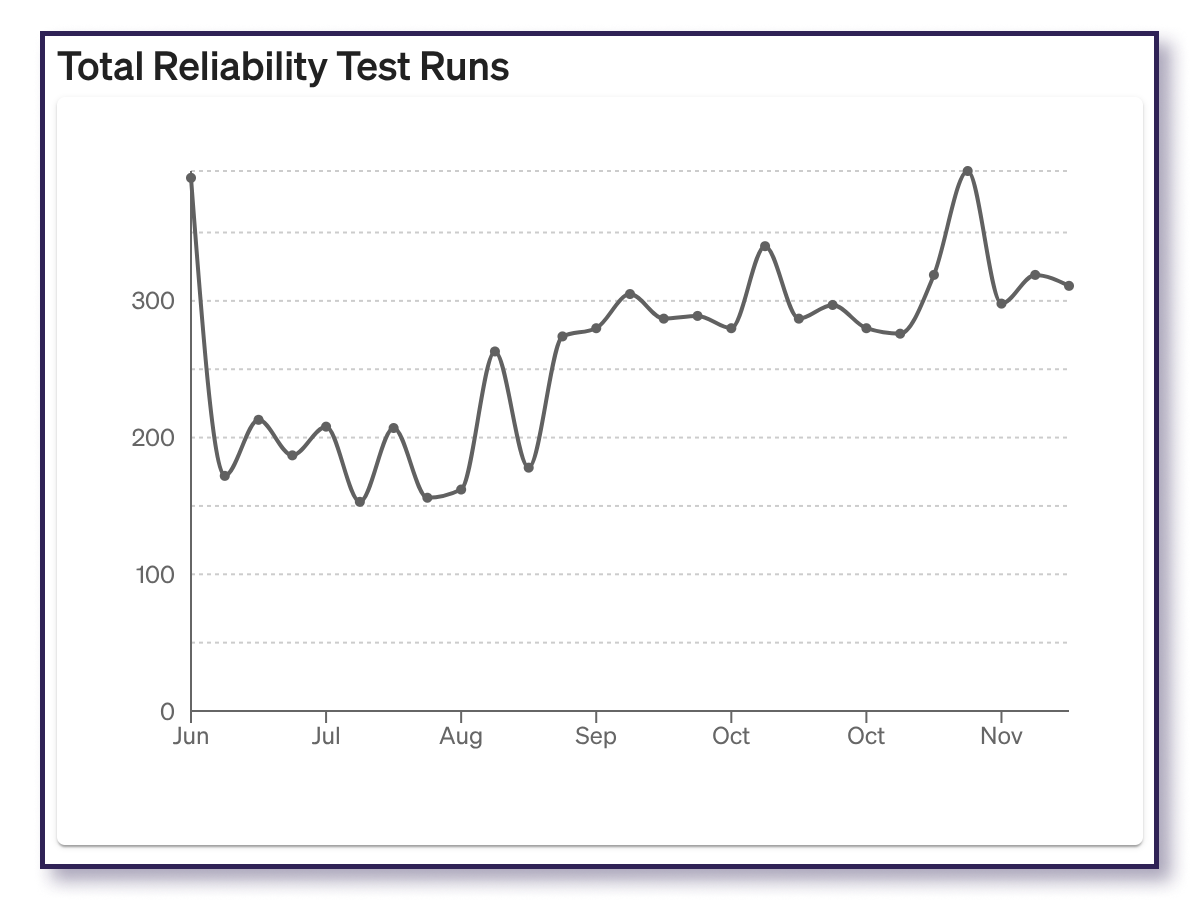
Your company will have a variety of reliability tests, such as Latency tests or Dependency Blackhole tests, packaged as a standard suite of tests done by all services. Each of these tests should run weekly for every service. So if you have 80 services, then over the course of two weeks, you’ll have 160 latency test runs, 160 Dependency Blackhole tests, etc.
This graph rolls all of those test runs together to show you the total number of tests performed on a bi-weekly basis. Use this graph to get an idea of your test coverage and how much visibility you’re getting into the behavior of your systems.
Weekly Runs
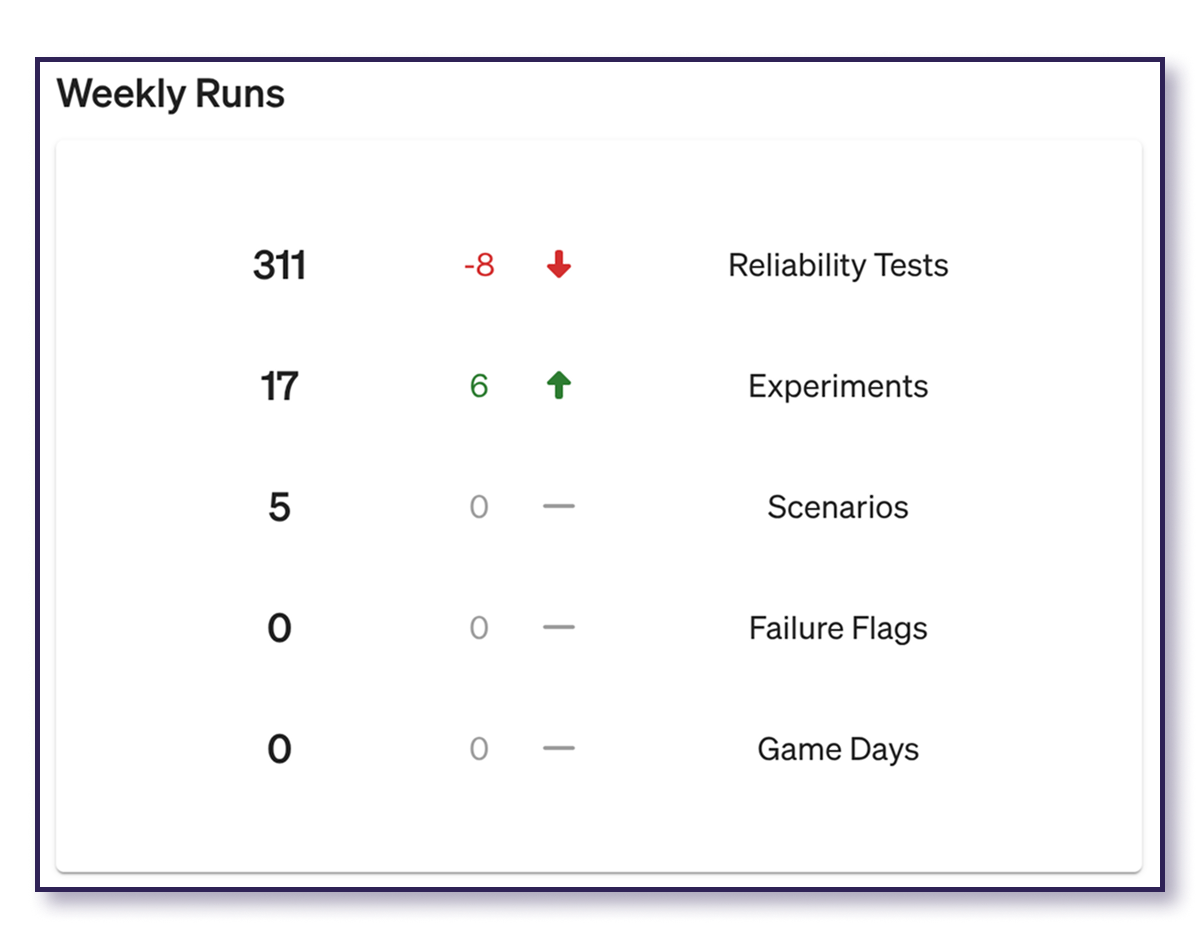
Weekly Runs shows the shift in the number of Reliability Tests, Experiments, Scenarios, Failure Flags tests, and GameDays on a week-to-week basis. While the Reliability Tests Run graph gives you an idea of test coverage, this data gives you an idea of how Gremlin is being used, so you can monitor the progress of your reliability programs.
Services
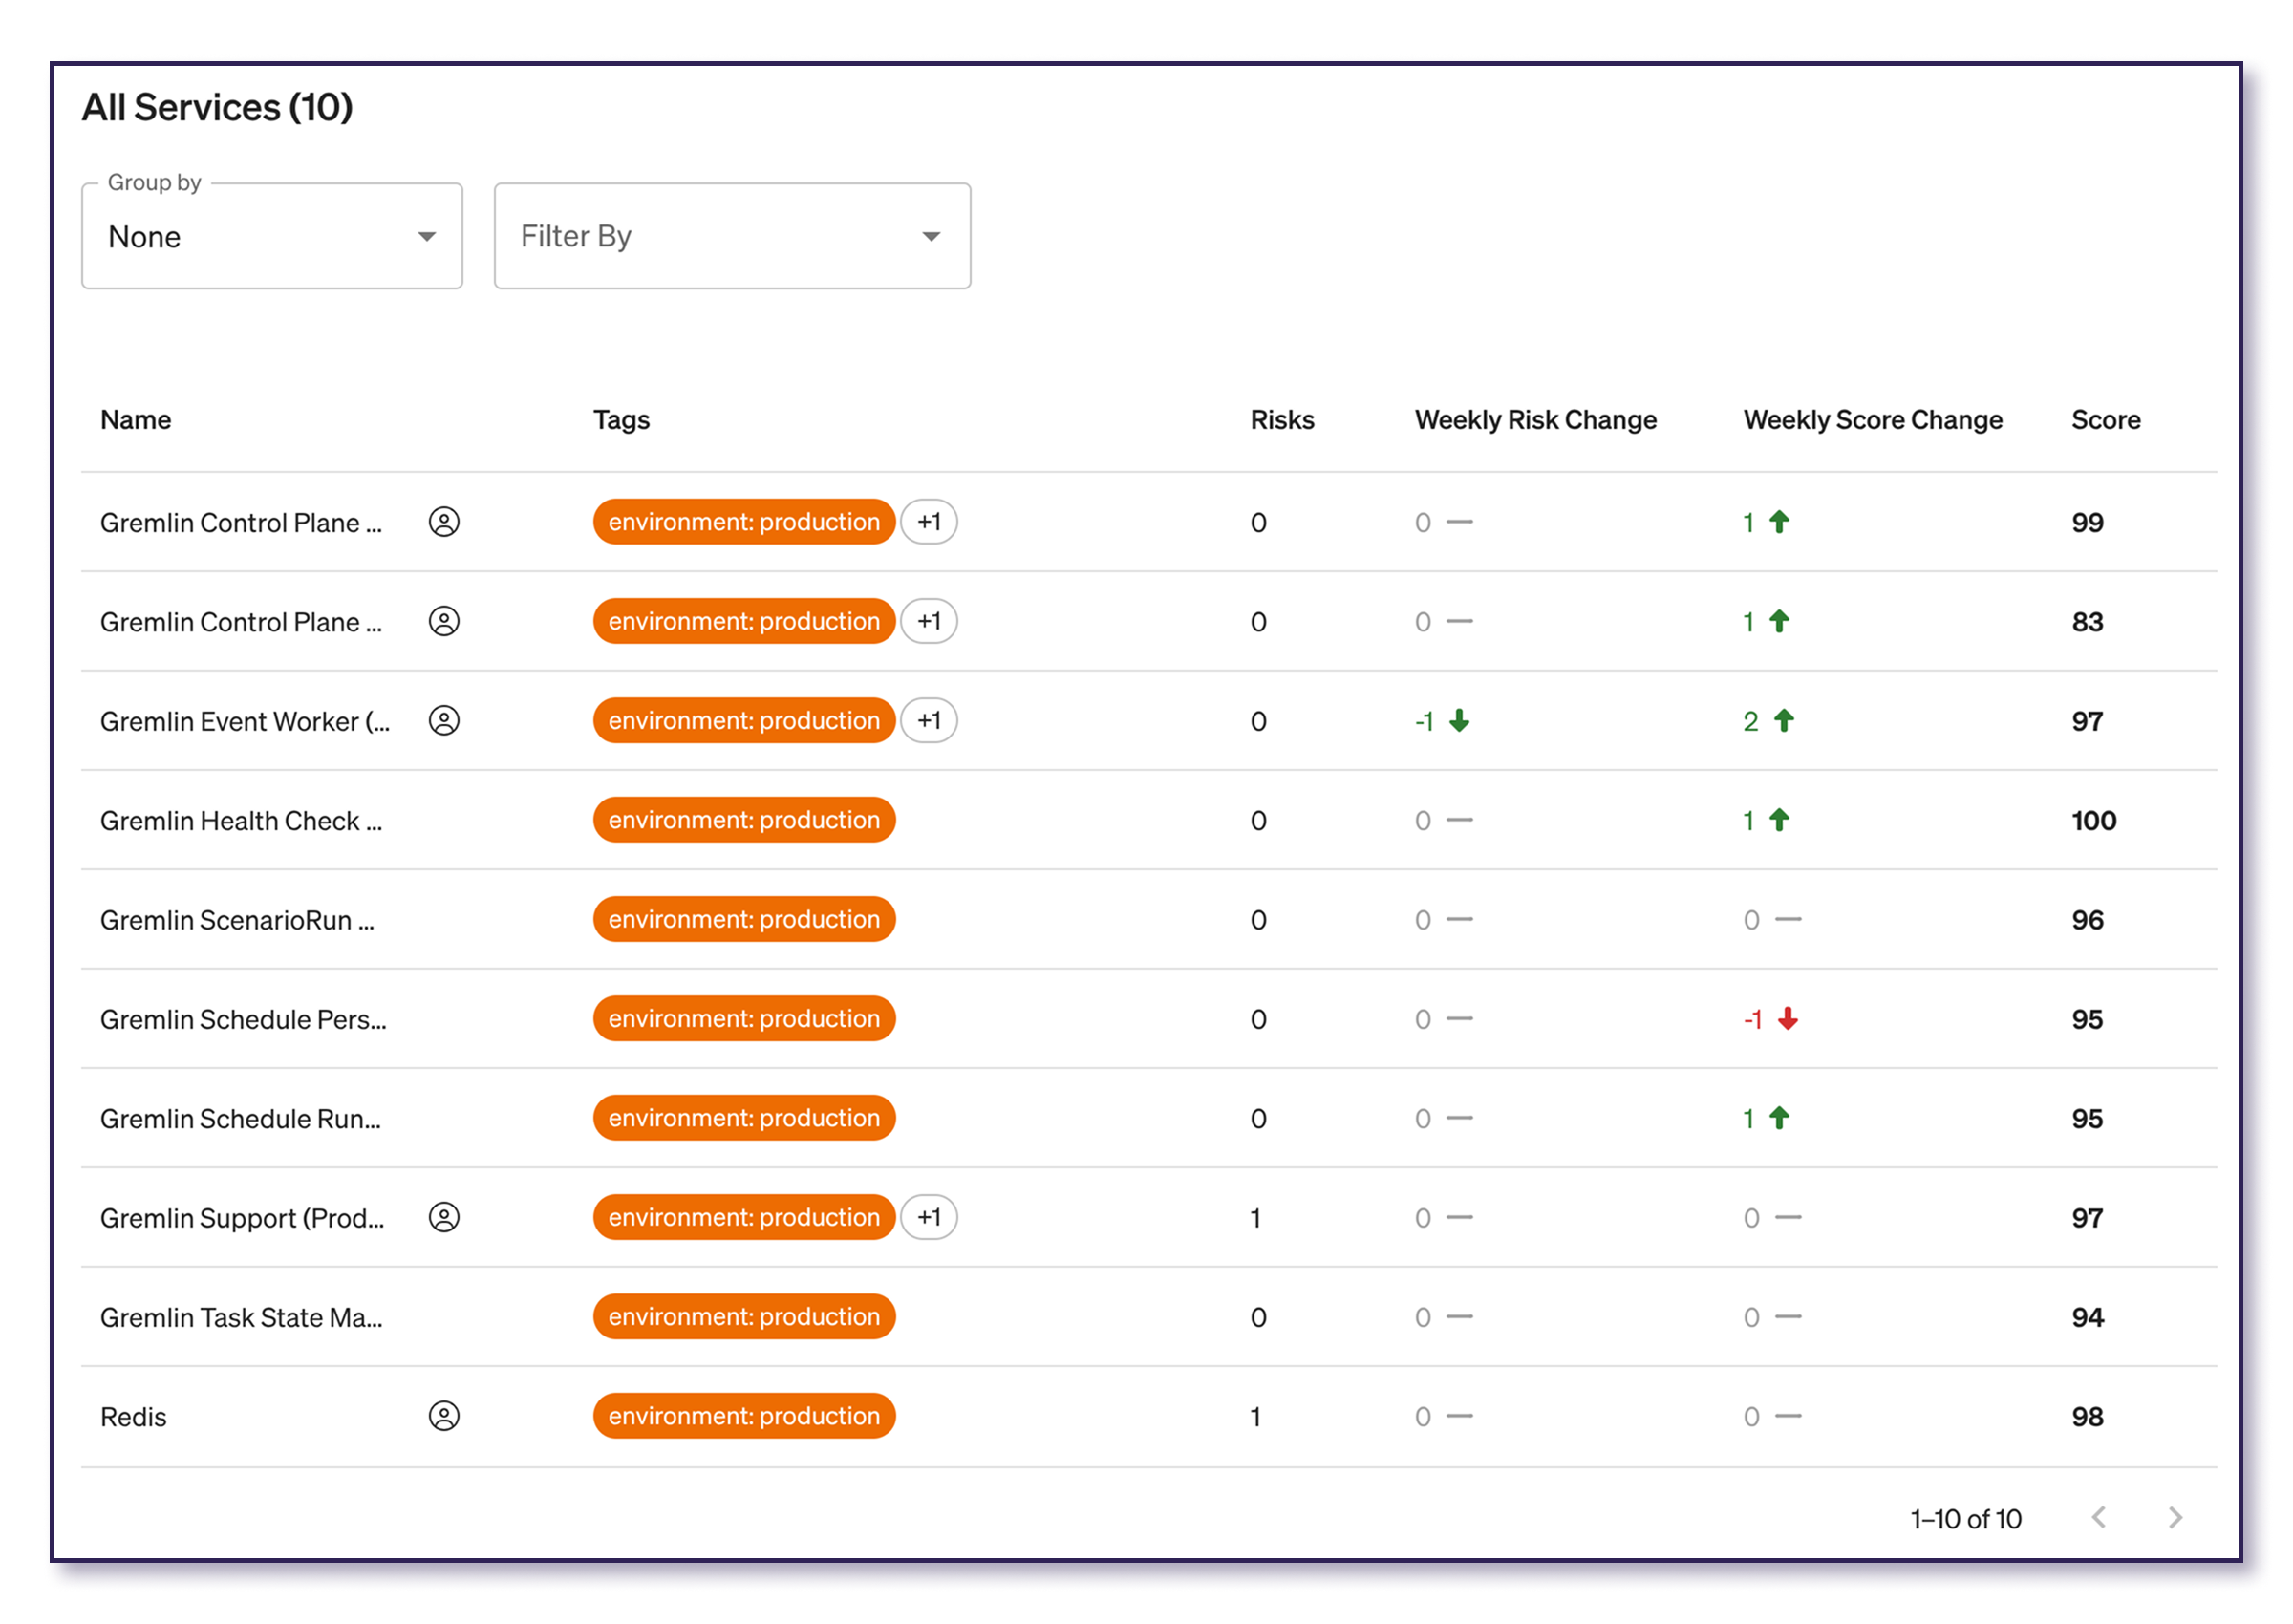
The Services table lists every service in your company, along with its name, tags, risks, score, and weekly changes. You can also group the list by team, filter by service tag(s), and sort the list, which helps you drill down if you want to find out why the average reliability score went down or where a spike in risks came from.
How to get the most out of the Reliability Report
Like all reliability efforts, the Reliability Report isn’t a one-and-done activity. It should be regularly referenced and checked to give you consistent increased visibility into your system reliability and resilience.
Fortunately, email helps make this easier! Gremlin sends weekly email summaries of the Reliability Report to company owners, along with team reports to team managers and service owners.
Make the most out of your Reliability Report by using it to:
- Kickstart conversations with your teams about unseen issues - Why was there a sudden drop? Are you addressing this? Was it intentional?
- Get a report back about the progress of efforts - If the score goes up or the risks decrease, you know that issues are being addressed and your teams are improving reliability.
- Check for reliability test coverage - You can’t see what you don’t test, so if there’s a decrease in tests or services aren’t being tested, then you know there are blind spots where you can direct your teams’ attention.
Real story: How Gremlin uses the Reliability Report
At Gremlin, we run reliability tests on our production environment every week, which means our leadership team also uses the Reliability Report. In fact, here’s a real story of how our CEO Kolton Andrus used it just last week.
When Kolton returned after a trip to AWS re:Invent, he pulled up the app and checked the Reliability Report to see how the app was doing. After all, we’re incredibly proud of our 99.999% uptime, and a big part of that is because our leadership holds teams accountable.
For the most part, the report looked good…except there was a slight dip in the average reliability score. Kolton scrolled down and saw that one of our services had dropped from a 99 score the previous week to an 85. That’s still in the green, but enough of a drop that it’s worth looking into.
Grabbing a quick screenshot, he pinged our Head of Engineering, then went into his next meeting. The Head of Engineering checked with the on-call engineer, who looked at the service, finished some in-flight work on it, then ran the tests again.
By the time Kolton got out of his meeting, the score was back up to 98.
It was a great example of how the report can be used to quickly draw attention to issues and resolve them before they cause problems or snowball into bigger issues.
Build your own Reliability Report with Gremlin
Reliability Tests and Detected Risks go beyond reactive monitoring to show you how your system will react. With regular testing and automatic detection, you’re filling in the blanks to get visibility into how reliable your systems are right now.
With the Reliability Report, your entire team from leadership to individual engineers gets a clear source of truth to align your reliability efforts around so you can make impactful improvements and show their results.
Ready to get started with your own Reliability Report? Schedule a demo and we’ll show you how.
Gremlin's automated reliability platform empowers you to find and fix availability risks before they impact your users. Start finding hidden risks in your systems with a free 30 day trial.
sTART YOUR TRIALSchedule a time with a reliability expert to see how reliability management and Chaos Engineering can help improve the reliability, resilience, and availability of your systems.
Schedule now
What is Reliability Management?
Measuring and improving the reliability of technical systems has always been challenging. As an industry, we've developed several practices to try and address reliability concerns, such as incident response, observability, and Chaos Engineering. This led SREs and service owners to measure reliability in a handful of ways:


Measuring and improving the reliability of technical systems has always been challenging. As an industry, we've developed several practices to try and address reliability concerns, such as incident response, observability, and Chaos Engineering. This led SREs and service owners to measure reliability in a handful of ways:
Read more