
Memory is a surprisingly difficult thing to get right in cloud environments. The amount of memory (also called RAM, or random-access memory) in a system indirectly determines how many processes can run on a system, and how large those processes can get. You might be able to run a dozen database instances on a single host, but that same host may struggle to run a single large language model.
Memory management requires planning and testing to make sure your systems are ready to handle the demands that your users will throw at them. In this blog, we’ll look at why memory is such a tricky resource to balance, then look at ways to optimize your memory allocation. The result is that your systems will have enough memory to handle any demand, without being over-allocated or over-budget.
Why is memory management so important in the cloud?
Memory is one of the most expensive parts of running modern software systems. Along with CPU, it’s one of the most common factors in determining the price and capacity of cloud compute instances. On AWS, for example, the cost per hour of running a memory-optimized instance (x2gd) doubles for each increase in memory. Considering that the base instance, with 16 GiB of memory and 1 vCPU, costs $731.46* to run per year, those costs can quickly increase depending on the number of instances you have running.
*As of this writing, the on-demand hourly rate for an x2gd.medium instance is $0.0835.
Figuring out how much RAM to use requires a delicate balance. Allocating too little RAM could make your services unstable, or even trigger the system’s out-of-memory (OOM) killer to evict services. Allocating too much will lead to overspending on cloud compute costs.
When provisioning systems, engineers need to make assumptions about how much memory their applications will consume both now and in the future. This is why memory management is so important: in addition to cost savings, it also improves the reliability of memory-intensive workloads like machine learning models, makes on-demand scaling more effective, and helps teams prepare for high-traffic events.
How to manage your memory effectively
Before settling on how much memory to allocate, you need to ask the important question: how much memory do I need? This will vary depending on the requirements of your service(s), how many instances you plan to deploy, and how much you expect demand to grow. A simple web server might work fine on a Linux server with 512 MB of RAM, whereas a database will need at least 2 GB.
One way to estimate your memory requirements is to use an observability tool or system monitor. Once it’s running and collecting data on memory usage, deploy your application and let it run under normal conditions. Use load or performance testing tools to simulate heavy demand on your service and see how that changes memory usage.
If your service is distributed (e.g. a Kubernetes deployment), you have some added flexibility in horizontal autoscaling. You can create an auto-scaling rule that adds instances to your cluster as memory demand increases, then distribute replicas of your service to those instances to take advantage of the extra memory. When demand on your service decreases, the cluster will scale back down and release the unused memory.
For a monolithic application, you’ll need to use vertical scaling, where you change the size of the instance that the application’s running on. This usually isn’t possible to do on a live system, so you’ll either need to stop the instance first (which means stopping your application and causing downtime), or spin up a second instance and redirect traffic using a load balancer or API gateway. For an example of how to scale vertically, AWS provides a user guide for EC2 instances.
How to test memory scalability with Gremlin
You can wait for a high-traffic event to test whether your systems will scale appropriately, or you can take a more proactive approach. Gremlin includes experiments specifically designed to test your service’s ability to scale when memory pressure is high. Specifically, Gremlin includes Scenarios, which are workflows for creating failure modes such as heavy memory load, disk pressure, and high CPU consumption. Gremlin comes with over 30 pre-built “Recommended Scenarios” based on common failure modes and industry best practices, but you can customize these or create your own to create unique failures. For now, we’ll look at the “Scalability: Memory” Recommended Scenario.
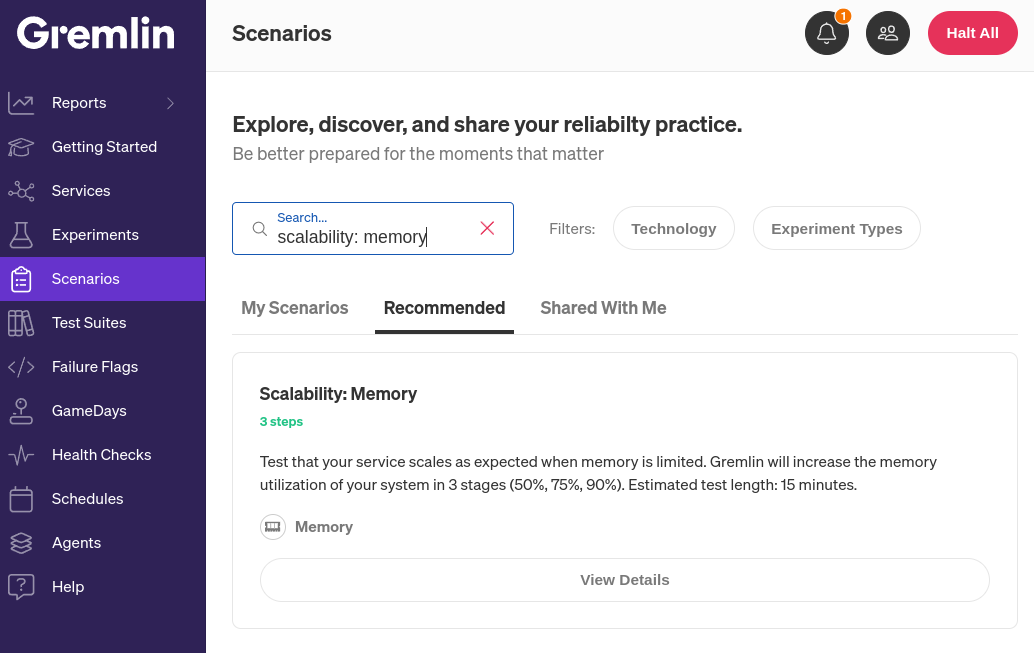
This Scenario works by consuming memory in three stages. First, it uses 50% of the entire system’s available RAM for five minutes. Next, it increases this amount to 75%, and finally, 90%.
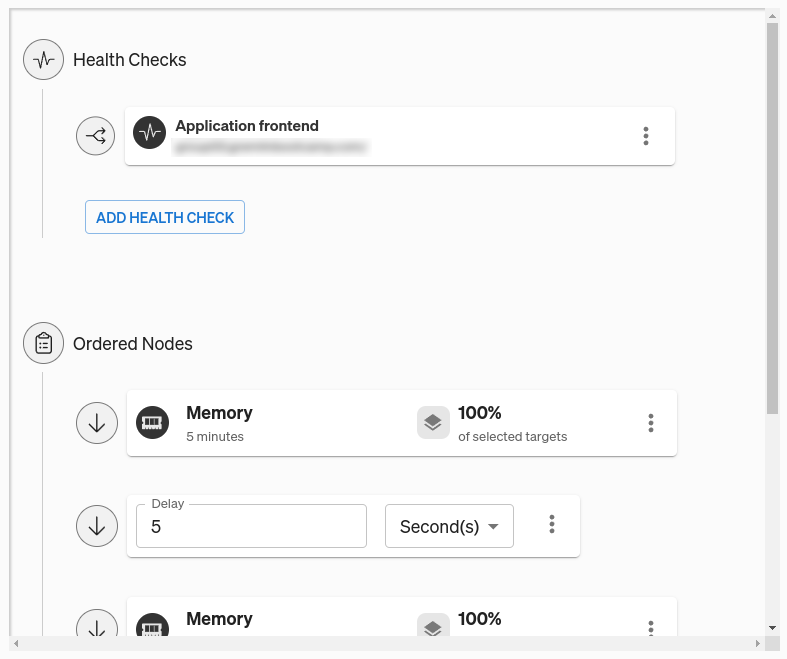
Before running this Scenario, we need to add a Health Check. A Health Check is a periodic check that Gremlin performs to determine whether your service is in a healthy or unhealthy state. They consist of an endpoint, such as a monitor or alert in your observability tool or a URL. If the endpoint returns an error, takes too long to respond, or becomes unresponsive, Gremlin will immediately halt the Scenario and revert its impact, returning your systems to normal. Gremlin natively integrates with a number of observability tools, so as a best practice, we recommend using your existing monitors or alerts for your Health Checks.
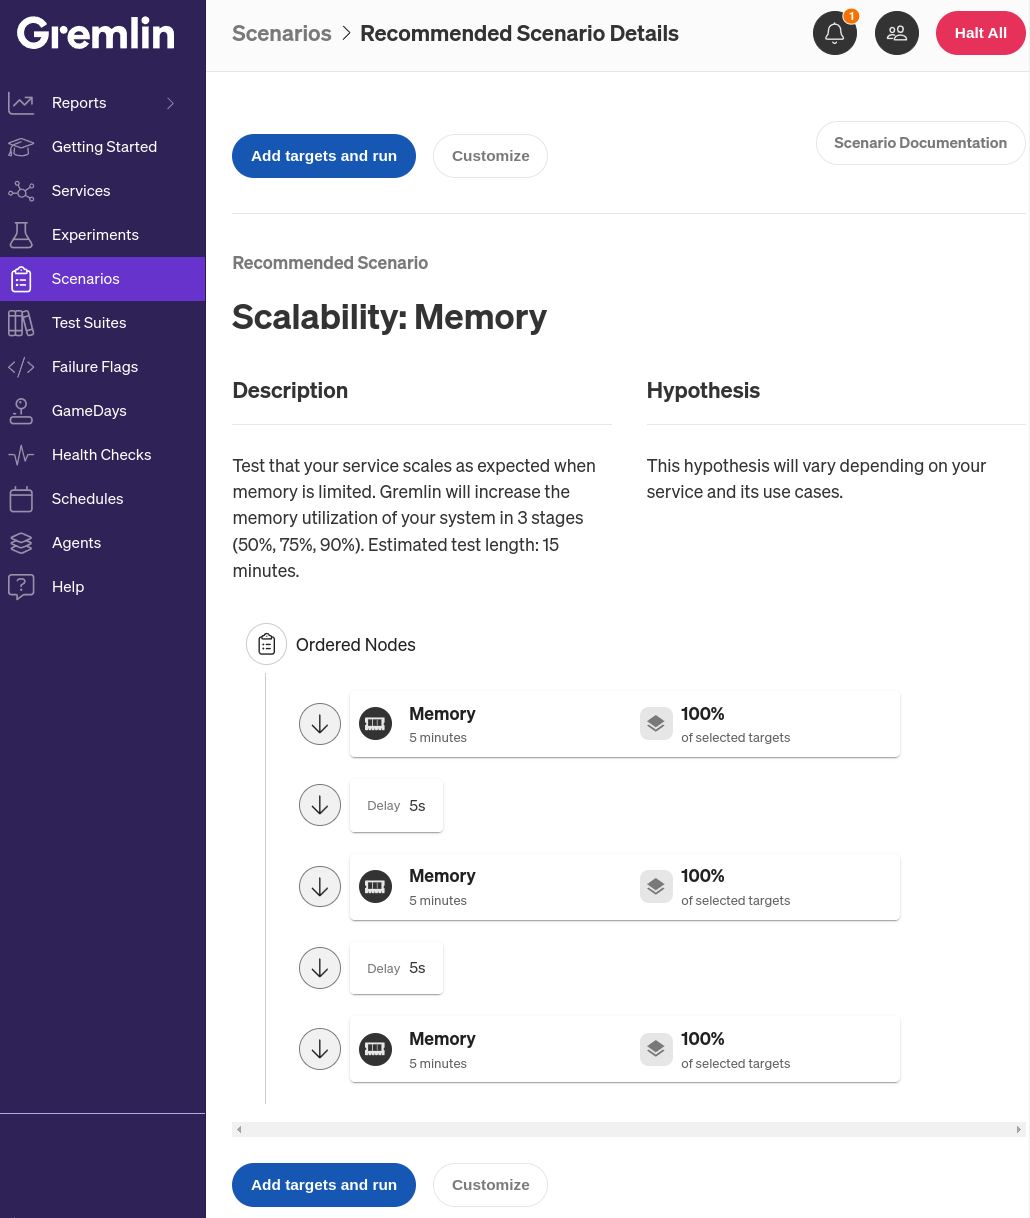
The first step in the Scenario is to run a memory experiment for five minutes. Experiments are the steps in the Scenario where we inject fault into the target system(s). Memory experiments, as the name implies, work by consuming RAM. Memory experiments are easy to revert (we simply free the consumed RAM), but they can still have impacts on our systems. For example, if we use a large amount of memory and try to spawn a new process on the target, the process may fail to start. This chance is pretty low, since the operating system’s out-of-memory (OOM) killer process will likely stop the Gremlin agent before that happens.
By default, the Scenario doesn’t have any targets selected, but we can change that by clicking on the hamburger menu next to the memory experiment node, then Edit. Here, we can select the targets for this experiment. Gremlin makes it super simple to select a target: we can just scroll down to Choose Hosts to target (this also works for containers and Kubernetes resources) and select (or type in) a tag. Gremlin highlights the impacted systems so we can visually confirm these are the ones we want to impact.

For the Health Check, we’ll use one we've already created. You can learn more about Health Checks, how they work, and which observability tools Gremlin supports in our documentation.
Once we’ve added our Health Check and saved the Scenario, we can run it. Clicking “Run” triggers the first memory experiment, which immediately increases memory usage until the host has used 50% of its RAM. If the host is already using 50% or more, nothing will happen. While the Scenario is active, Gremlin runs the Health Check every 10 seconds.
Interpreting the results of your memory tests
So, what do we expect to happen? At first, probably not much. It’s normal for systems to use at least 50% of their RAM. This shows that you’re allocating resources efficiently. If you’re experiencing failures or your Health Check is already failing, this could indicate a problem with your deployment or instance’s configuration.
During the 75% phase of the Scenario, you might expect your autoscaling rules to kick in and start provisioning a new instance. If this is the case, five minutes should leave enough time for the new instance to come online before the final stage of the Scenario. If your service successfully migrated to the new instance without any interruptions in availability, the Scenario will complete without any errors. Otherwise, the Scenario will fail and immediately stop.

Using swap as a temporary solution
Swap space is a location on a hard drive or similar storage device that acts as RAM. Data that is used infrequently or for caching purposes can be “swapped” out to swap space, freeing up RAM for more important tasks. This isn’t a “true” solution because swap space is significantly slower than RAM, but it can help prevent hosts from becoming unstable when RAM usage gets too high. To learn more about using swap on Amazon EC2, see this AWS knowledge center article.
What other scenarios should I be testing for?
Memory is just one of many finite resources engineering teams need to consider when deploying workloads. CPU capacity, network bandwidth, and disk space are all important contributors to scalability, reliability, and performance. Gremlin comes with over 30 pre-built Recommended Scenarios for testing all of these resources, and more.
We’ll be publishing more blog posts like these, so stay tuned for more. In the meantime, if you’re ready to run your own memory tests, sign up for a free 30-day trial, or use the card below to open the Scenario in your browser.
Length:
20 minutes
Experiment(s):
Gremlin's automated reliability platform empowers you to find and fix availability risks before they impact your users. Start finding hidden risks in your systems with a free 30 day trial.
sTART YOUR TRIALGetting started with Memory attacks
Memory (or RAM, short for random-access memory) is a critical computing resource that stores temporary data on a system. Memory is a finite resource, and the amount of memory available determines the number and complexity of processes that can run on the system. Running out of RAM can cause significant problems such as system-wide lockups, terminated processes, and increased disk activity. Understanding how and when these issues can happen is vital to creating stable and resilient systems.


Memory (or RAM, short for random-access memory) is a critical computing resource that stores temporary data on a system. Memory is a finite resource, and the amount of memory available determines the number and complexity of processes that can run on the system. Running out of RAM can cause significant problems such as system-wide lockups, terminated processes, and increased disk activity. Understanding how and when these issues can happen is vital to creating stable and resilient systems.
Read moreHow to detect and prevent memory leaks in Kubernetes applications
In our last blog, we talked about the importance of setting memory requests when deploying applications to Kubernetes. We explained how memory requests lets you specify how much memory (RAM for short) Kubernetes should reserve for a pod before deploying it. However, this only helps your pod get deployed. What happens when your pod is running and gradually consumes more RAM over time?

In our last blog, we talked about the importance of setting memory requests when deploying applications to Kubernetes. We explained how memory requests lets you specify how much memory (RAM for short) Kubernetes should reserve for a pod before deploying it. However, this only helps your pod get deployed. What happens when your pod is running and gradually consumes more RAM over time?
Read more