
As the world becomes more dependent on cloud-native systems, the tolerance for slow services is decreasing. Users expect instantaneous access to services, whether it's for work, entertainment, or even cloud infrastructure. Even small amounts of latency can significantly decrease user satisfaction: nearly half of all users expect web pages to load in under two seconds, and as many as 28% of users will permanently abandon a slow site. The problem is, how can we test and verify that our applications and services will perform well even when network conditions are less than ideal?
In this blog, we'll take a deep dive into the Latency attack and how it can help address this problem. We'll look at how it works, how to use it, and how it can help you build responsive, fault-tolerant applications and systems.
How does a Latency attack work?
The Latency attack works by injecting a delay into outbound network traffic from a host or container. It uses existing Quality of Service (QoS) and Differentiated Services (diffserv) facilities in the Linux kernel to emulate packet latency. This way, it doesn't need to modify any firewall rules or iptables rulesets. On Windows systems, Gremlin uses a custom driver to create latency.
By default, the attack adds 100ms of latency to all outbound network traffic (except for DNS traffic and traffic to api.gremlin.com). You can configure the attack to only impact specific types of traffic based on port, IP address, hostname, or other parameters. Gremlin also provides a list of pre-defined third-party services that you can select for easy targeting, such as AWS EC2 regions.
The attack supports these parameters:
- <span class="code-class-custom">Length</span>: How long the attack runs for.
- <span class="code-class-custom">IP Addresses</span>: Restricts the attack to specific IP address(es). This field supports CIDR values (e.g. <span class="code-class-custom">10.0.0.0/24</span>).
- <span class="code-class-custom">Device</span>: The network interface to impact traffic on. If left blank, Gremlin will target all network interfaces.
- <span class="code-class-custom">Hostnames</span>: Only impacts traffic to these hostnames.
- <span class="code-class-custom">Remote ports</span>: Only impacts traffic to these destination ports.
- <span class="code-class-custom">Local ports</span>: Only impacts traffic originating from these ports.
- <span class="code-class-custom">MS</span>: How long to delay each packet (in milliseconds).
- <span class="code-class-custom">Protocol</span>: Which protocol to impact (TCP, UDP, or ICMP).
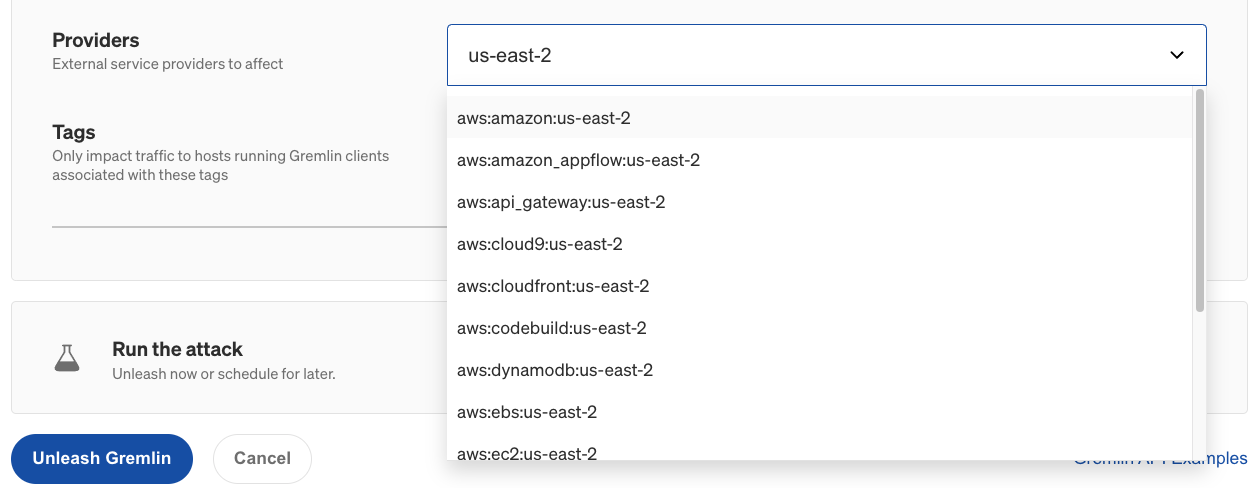
- <span class="code-class-custom">Providers</span>: Which external service provider(s) to impact, if any. To access this option in the Gremlin web app, click "Show Advanced Options".
- <span class="code-class-custom">Tags: If specified, the attack will only run on Gremlin agents associated with these tags.
These parameters make up what's called the magnitude of the attack. As you increase the latency and target a wider range of network traffic, the magnitude increases. As with all Gremlin attacks, you can run a Latency attack on multiple hosts simultaneously. This is called the blast radius. You can also run a Latency attack on containers, Kubernetes resources, and Services.
When running your first Latency attack, start small by reducing the magnitude and blast radius to a single non-production host and a single port number or service. For example, if you're running a web server such as Apache or Nginx, only block port 80 (or port 443 if using TLS). While the attack is running, monitor the availability and throughput of your service using a network monitoring tool to observe the impact on bandwidth and performance.
As you run these experiments, remember to record your observations, discuss the outcomes with your team, and track any changes or improvements made to your systems as a result. This way, you can demonstrate the value of the experiments you’ve run to your team and to the rest of the organization.
Why should you run Latency attacks?
When building networked applications or services, it's easy to test the service on a high-speed network and assume it will perform just as well in the real world. In reality, many factors can affect network speed, including:
- Aging or underperforming network hardware.
- Data saturation.
- Cloud platform provider availability and capacity.
- Physical distance between your systems and your users.
- Applications that are poorly optimized or have poorly configured connection, timeout, and/or retry logic.
With Latency attacks, we can validate that:
- Our applications can work reliably over saturated, unstable, or slow network conditions.
- We can confidently migrate our applications and services from a low-latency architecture to a high-latency architecture, like from an on-premises data center to a public cloud.
- Developers have thoroughly tuned and tested their applications' retry and timeout thresholds.
- Load balancers are properly configured to route traffic away from slow or unresponsive nodes.
- Systems that rely on concurrency (like distributed databases) work reliably without data loss.
This helps us maximize the performance and responsiveness of user-facing applications, maximize throughput for our backend systems, and ensure a good user experience independent of network performance.
Get started with Latency attacks
Now that you know how Latency attacks work, try running one yourself:
- Log into your Gremlin account (or sign up for a free trial).
- Create a new attack and select a host to target. Start with a single host to limit your blast radius.
- Under Choose a Gremlin, select the Network category, then select Latency.
- Set the Length of the attack.
- Change the number of MS to the number of milliseconds each packet should be delayed. This is <span class="code-class-custom">100</span> by default. Note that this number applies to each individual packet matching the attack parameters, not each connection. Processes that send large amounts of data will have proportionally higher response times.
- Optionally, enter the IP Addresses or Hostnames to drop traffic to, the network Device to impact, and the Remote or Local Ports to drop traffic on. For convenience, you can select an external service Provider to target, as well as target specific hosts by Tags.
- ^If you leave all of these options at their default values, latency will be added to all outbound traffic.
- ^Optionally, open the Show Advanced Options section and select the network Protocol to impact traffic on. By default, all protocols will be impacted.
- Click Unleash Gremlin to start the attack.
Before starting the attack, gather information about the performance of your network using a network monitoring tool. Something as simple as <span class="code-class-custom">ping</span> will work, but for a better understanding of your network, use a tool like Apache Bench. You can use Apache bench to measure the responsiveness of an endpoint simply by entering its URL. You can also run it for a period of time, such as 60 seconds. For example:
When you start the attack, re-run Apache Bench and measure the difference in performance. You should see a noticeable decrease in requests per second and transfer rate, and an increase in time per request:
shell
1Requests per second: 1.39 [#/sec] (mean)
2Time per request: 718.532 [ms] (mean)
3Time per request: 718.532 [ms] (mean, across all concurrent requests)
4Transfer rate: 35.42 [Kbytes/sec] received
Now that you have your data, compare it to your hypothesis:
- Were you still able to access and use your service, even if performance wasn't ideal?
- Did this trigger a timeout in your application? Was it able to recover?
- If you were testing a load balancer, did it automatically redirect you to a faster node?
- Did your monitoring and alerting solution detect a significant change in throughput? Was anyone on your team notified? Should you adjust your monitoring rules to detect problems like these in the future?
Once you’ve answered your initial hypothesis, try increasing the magnitude of your attack by adding more latency, or by adding additional port numbers, IP addresses, or hostnames. Target commonly used system ports like port 22 (SSH), 53 (DNS), or 67 and 68 (DHCP). Target connections between your services and their critical dependencies like databases, caches, and other services.
You can also increase the blast radius by targeting more hosts simultaneously. This can be used to simulate large-scale network degradation, such as an availability zone (AZ) or region-wide incident. If your systems are deployed on AWS, what happens when one of your AZs can no longer be reached? To simulate an AZ outage, you can either select the hosts running in that AZ by tag, or select all hosts and use the Providers drop-down to select the AZ that you want to block traffic to.

Now that you’ve run the attack, try using a Scenario. Scenarios allow you to run multiple attacks sequentially, as well as monitor the availability of the target system(s) using Health Checks. Health Checks can periodically contact a monitor that you provide before, during, and after a Scenario, and if the monitor returns a failed state or fails to respond successfully or within a window of time, then the Scenario will automatically halt. You can use this to set an upper bound and prevent latency from increasing too much.
If you'd like guidance on where to start, try using one of our Recommended Scenarios. Gremlin includes over nine pre-built Scenarios designed by our reliability experts for testing conditions such as cascading latency between containers and nodes, database timeouts, message queues with slow consumers, and validating monitoring alerts. Links to a few of these Scenarios are available below.

Gremlin's automated reliability platform empowers you to find and fix availability risks before they impact your users. Start finding hidden risks in your systems with a free 30 day trial.
sTART YOUR TRIALIntroducing Custom Reliability Test Suites, Scoring and Dashboards
Last year, we released Reliability Management, a combination of pre-built reliability tests and scoring to give you a consistent way to define, test, and measure progress toward reliability standards across your organization.


Last year, we released Reliability Management, a combination of pre-built reliability tests and scoring to give you a consistent way to define, test, and measure progress toward reliability standards across your organization.
Read moreTreat reliability risks like security vulnerabilities by scanning and testing for them
Finding, prioritizing, and mitigating security vulnerabilities is an essential part of running software. We’ve all recognized that vulnerabilities exist and that new ones are introduced on a regular basis, so we make sure that we check for and remediate them on a regular basis.


Finding, prioritizing, and mitigating security vulnerabilities is an essential part of running software. We’ve all recognized that vulnerabilities exist and that new ones are introduced on a regular basis, so we make sure that we check for and remediate them on a regular basis.
Read more