


Custom Health Check
Supported platforms:
Custom health checks let you use a custom tool or REST API endpoint to monitor the health of your service(s).
To add a custom health check, you'll need the REST API endpoint of your custom tool, and any REST headers required to access the endpoint (e.g. for authentication).
- Open the Health Checks page in the Gremlin web app and click + Health Check.
- If you want to reuse an existing custom tool, select the name of the tool from the drop-down list and skip ahead to adjusting the success evaluation criteria. Otherwise, select Other and follow these instructions:
- Enter a Nickname for the observability tool.
- If your observability tool is in multiple different regions or sites, select Yes under Does this observability tool have multiple regions. This lets you specify which region to use when selecting this URL.
- If the endpoint is behind a private network, select Yes under Is this observability tool behind a firewall or on-prem.
- Enter the Authentication Endpoint URL. This is the URL that you use to authenticate with your tool.
- Add any required REST API request headers by clicking + Add Header in the Authentication section. Examples might include:
- Click Authenticate Observability Tool to send a test request to the endpoint. If the request is successful, Gremlin displays the response received. Double-check the contents to make sure this is the response you expected.
- Click Save Authentication, then click Next.
- Enter a Name for the Health Check.
- Enter the REST API endpoint of the Health Check in the Monitor or Alert URL box. This can be any valid HTTP endpoint: a website, an observability tool monitor, etc.
- By default, Gremlin sends a request to the endpoint using the GET method. If your API endpoint requires data, you can use the box to select a POST method instead. See Changing the request method for details.
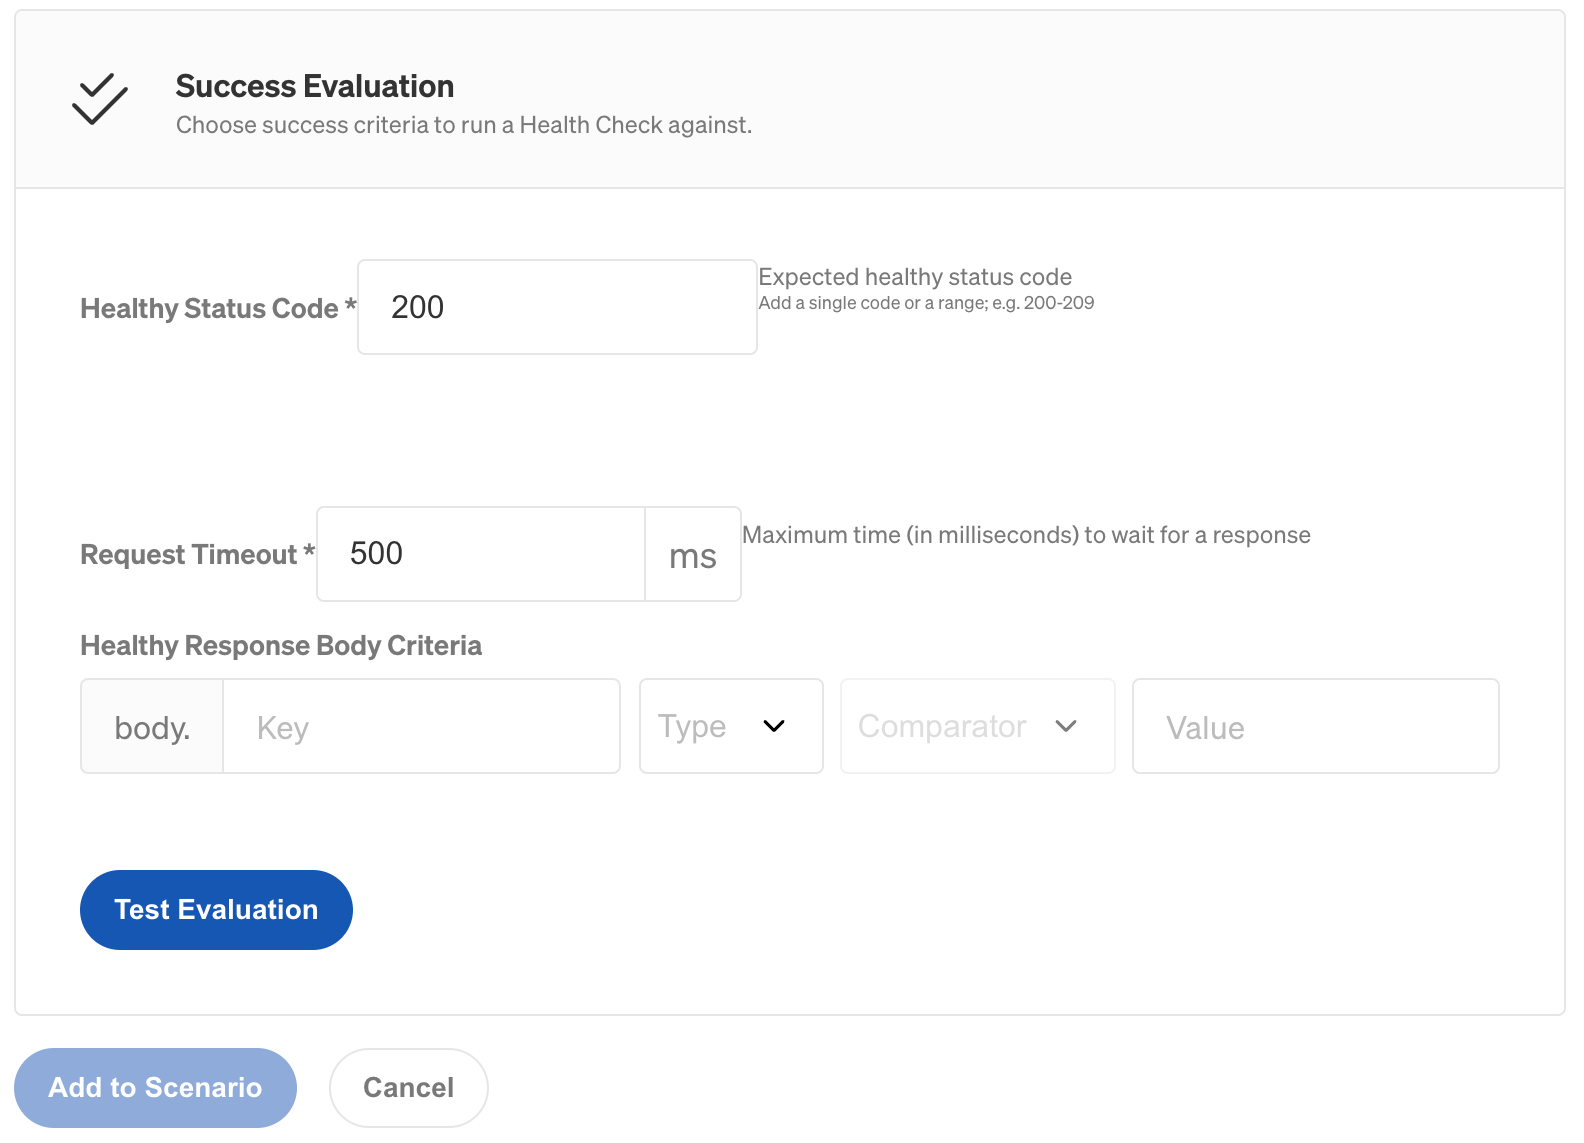
- Adjust the Success Evaluation criteria to your needs. By default, Gremlin considers the check to be successful if it returns an HTTP 200 status code within 1000 milliseconds (1 second). You can change these values to fit your requirements or keep the defaults.
- If your response contains a JSON object, the Healthy Response Body Criteria form will appear. You can enter the JSON path of a specific field and compare its value to an expected value using this form. Read adding success evaluation criteria below for more information.
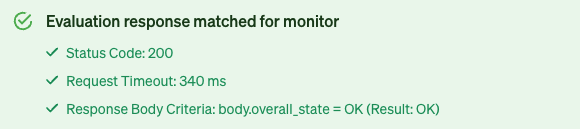
- Click Test Evaluation to send another test request to your endpoint. This is to ensure the response meets your criteria.
- Optionally, change how frequently Gremlin performs the check using the Polling Interval box. You can set this value anywhere between 15 and 60 seconds.
- Click Save to save the new health check.
This custom integration will be available for all Gremlin team members to use for adding additional custom Health Checks. Team members will be able to select it in the Integrations drop-down when adding a Health Check to a Service.
Changing the request method
By default, Gremlin sends a GET HTTP request when contacting a custom Health Check endpoint. Alternatively, you can send a POST request. This lets you pass additional data to your Health Check, such as the service ID, test ID, and reliability test ID.
To change the request method:
- Create a new custom Health Check, or edit an existing one.
- Click on the Method box next to the Health Check's URL. Select POST.
- Use the Content Type field to specify the type of content included in the request body. For example, if you want to send JSON, enter "application/json" here. Otherwise, leave it blank.
- Enter the data you want to POST to your Health Check using the Request Body field. This can be plain text, JSON, XML, etc.
- Click Test Connection to verify the request is successful. If so, continue with the usual steps to save your Health Check.
Interpolated fields available in POST requests
Gremlin can include additional, dynamic information in each POST request, such as the current test ID, service ID, and run time. You can include these in your POST payload by wrapping them in curly braces, e.g., ${SCENARIO_ID}. Here is a list of each available field and what it includes:
Adding success evaluation criteria
Custom Health Checks require an additional step: setting success criteria. This tells Gremlin how to interpret the response received from your endpoint to determine whether your systems are unhealthy or unhealthy. The following sections explain each of the different fields and how they impact success evaluation.
Healthy status code
Add the status code the response should include if the service is healthy. If the status code responds outside of this code or range of codes then the Scenario will automatically halt. See the list of HTTP Status Codes for more guidance. Besides a single HTTP Status Code, you can also enter in a range such as 200-204.
Request timeout
You can optionally set a maximum time in milliseconds to wait for a response before halting the Scenario. For example, you might add a Health Check before starting a latency experiment to validate your service is responding within your Service Level Indicator (SLI) and Service Level Objectives (SLO) requirements. This would ensure that a Scenario halts prior to introducing even more latency on your service.
To add a timeout:
- Check the Use custom request timeout box when editing the Success Evaluation criteria of a Health Check.
- Enter the timeout in milliseconds into the Request Timeout (ms) box. This must be a number between 50 and 10,000 ms.
- Click Test Evaluation to verify that your Health Check responds within the timeout.
Healthy response body criteria
Add the key that you expect from the response body, and then add a comparator to ensure the value associated with that key is accurate. If the value doesn’t pass the comparator you add, the Scenario will halt. This field is especially important for evaluating the responses from 3rd party monitoring software. At this time, we support JSON response bodies. This was implemented using the Jayway JsonPath library. Please refer to their docs for options for evaluating response body criteria as well as the basic Operators and Functions tables below.
Operators
Tables are from the Jayway JSONpath library.
Functions
Functions can be invoked at the tail end of a path - the input to a function is the output of the path expression. The function output is dictated by the function itself.
Tables are from the Jayway JSONpath library.