
As complex as Kubernetes is, much of it can be distilled to one simple question: how do we keep containers available for as long as possible? All of the various utilities, features, platform integrations, and observability tools surrounding Kubernetes tend to serve this one goal. Unfortunately, this also means there’s a lot of complexity and confusion surrounding this topic. After all, most people would agree that availability is important, but how exactly do you go about achieving it? And how can you even achieve high availability when Pods can fail at any time, and for any reason?
In this blog, we’ll answer this question by showing how to configure Kubernetes to automatically detect and restart failed containers. You’ll learn how to set a container restart policy, how to create liveness probes, and how to test that these systems will work as expected and when you need them to.
How does Kubernetes identify failed Pods?
Let’s start by looking at how Kubernetes handles Pod failures. A deployed Pod can be in one of five lifecycle phases:
Pending: the cluster has accepted the Pod, but hasn’t yet scheduled or started it.Running: the Pod is actively running on a node.Succeeded: the Pod’s containers have all finished running and exited successfully.Unknown: Kubernetes can’t determine the Pod’s state.Failed: the Pod’s containers have all finished running, but at least one container returned an error.
The Failed phase is the one we’re interested in. A Pod is marked as Failed when one of its containers returns a non-zero status, or is terminated by the system. This could be due to a crash, an unhandled exception, an out-of-memory (OOM) event, an intentional exit, or any number of other reasons. The main takeaway is that something undesirable happened, and now the Pod is offline.
We’ll look at two ways to handle failed Pods: using a Pod restart policy, and using liveness probes.
Using a Pod restart policy to recover a failed Pod
Pods have an optional field called restartPolicy, where you can define the Pod’s behavior if it fails. restartPolicy has three options:
Alwaysis the default setting, and tells Kubernetes to restart the Pod after its containers stop, regardless of whether the containers return a successful or failed exit code.Nevermeans Kubernetes won’t restart the Pod once it’s finished running.OnFailureonly restarts the Pod if it enters the Failed phase.
Setting the restart policy to Always doesn’t mean Kubernetes will keep trying to restart a failed Pod perpetually. Instead, it uses an exponential back-off delay that starts at 10 seconds and goes up to five minutes. In other words, let’s say you have a Pod with a critical error that prevents it from completing its startup process. Kubernetes will try to start it, see that it failed, wait 10 seconds, then restart it. The next time it fails, Kubernetes will wait 20 seconds, then 40 seconds, then 1 minute 20 seconds, etc, all the way up to five minutes. After this point, if the container still fails to start, Kubernetes will no longer try to start it. But if Kubernetes does manage to get the container running, this timer will reset after 10 minutes of continuous runtime.
The restart policy also only applies to the Pod’s app and init containers. Sidecar containers, like logging and observability services, will always restart by default.
How to apply a Pod restart policy
Declaring a restart policy is simple: in your Pod manifest, set the Pod’s spec.restartPolicy to the option you want. For example, this Nginx Pod is set to only restart on failure:
This does mean that if the Pod ever exits successfully, it won’t restart until we do so manually. This shouldn’t happen under normal circumstances, but we can always set the restart policy to Always to be sure.
Using liveness probes to recover failed Pods
In cases where a Pod restart policy won’t work, or where we need a bit more control over what constitutes “failed”, we can use a liveness probe. A liveness probe is a periodic check designed to test a Pod to determine whether it’s in a healthy state.
Liveness probes and restart policies work hand-in-hand. When a liveness probe detects a problem, Kubernetes (more specifically, the kubelet agent running on the node) kills the container, then handles it according to its restart policy. If a container doesn’t have a liveness probe attached to it, then it enters the Success state. This can, however, lead to a crash loop if you have your pod restart policy set to Always and your liveness probe keeps failing.
Liveness probes don’t just need to be HTTP requests. They can also be TCP requests, gRPC requests, and even commands running inside the container. You could use them to:
- Check whether a specific endpoint is available
- Check the response time of the container
- Look for the presence of a specific file
- Make sure a command is returning a successful exit code
If we wanted to add a liveness probe to our Nginx Pod, we could use this code:
This probe simply checks the root URL of the container over port 80. It first waits 5 seconds before running the first probe (specified by initialDelaySeconds, then runs the probe every 30 seconds (specified by periodSeconds). By default, the probe won’t fail immediately if it doesn’t get a response back: instead, it tries three times, and only reports a failure if all three attempts fail. You can change this by setting the failureThreshold option.
How do you test your Pod’s recoverability?
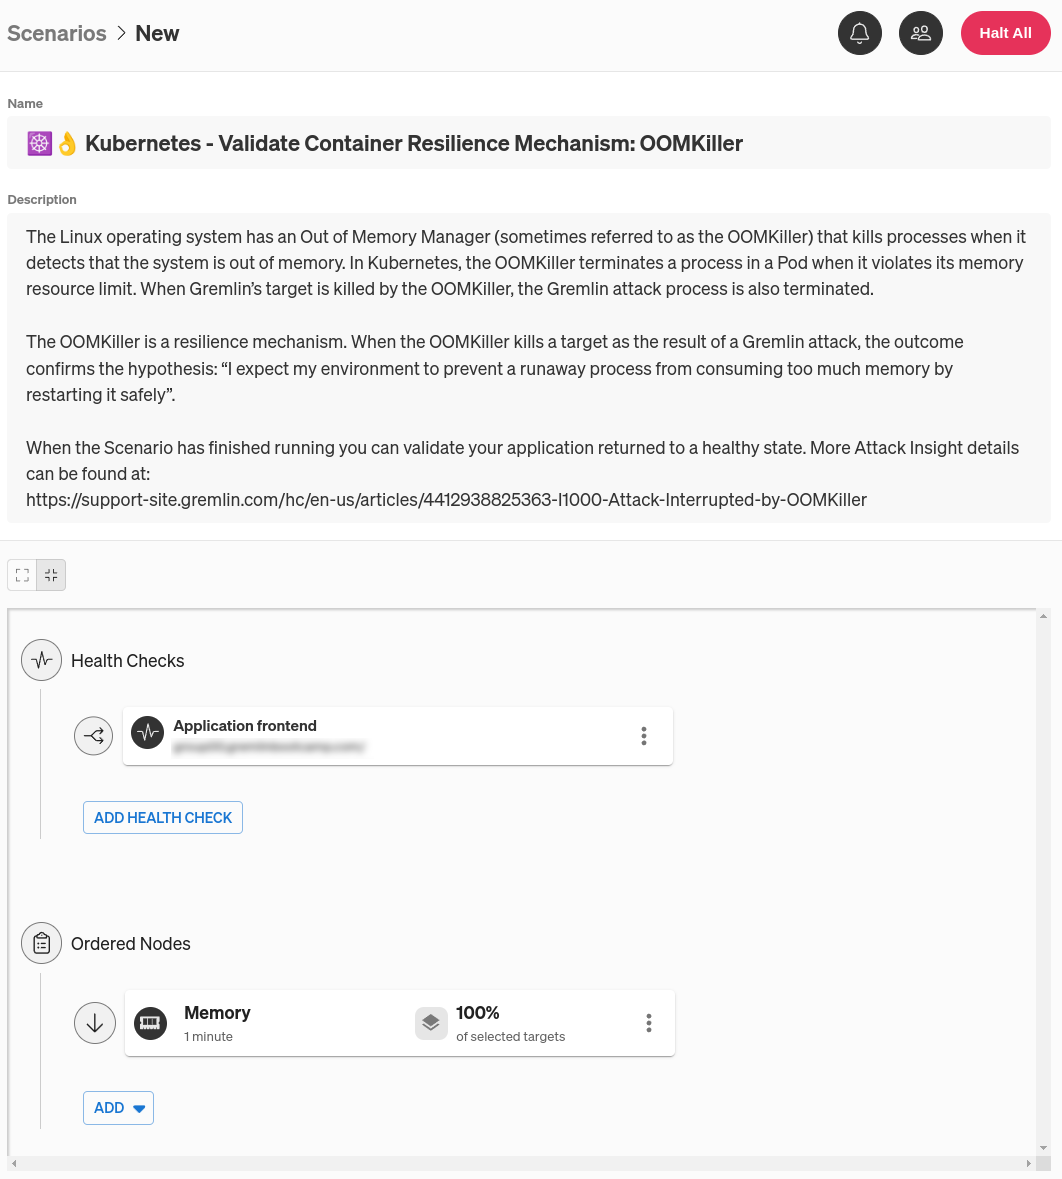
The Scenario we’ll use to test our containers is called Kubernetes - Validate Container Resilience Mechanism: OOMKiller. As the name suggests, this Scenario pushes memory usage inside of a container to its absolute limit, triggering the out-of-memory (OOM) killer process to stop it. Think of it like filling an unbalanced bucket with water until it tips over.
But why trigger the OOM killer? Why not just run a Shutdown or Process Killer experiment? While the latter two experiments are more direct, a memory experiment has an added benefit: they let us test two scenarios at once. First, running out of memory is a very realistic problem that happens even in well-tested environments. If you set memory limits on your Pods (which you should), a sudden increase in traffic or an undiscovered bug could lead to the Pod using more memory than expected. This can easily push past a limit you’ve set. Second, the out-of-memory killer terminates processes that exceed their memory limits without warning and without giving them time to exit cleanly. This creates a similar behavior as we’d see with a Shutdown or Process Killer experiment.
Testing our containers this way doesn’t just tell us whether our containers can recover, but also how our cluster handles low-memory situations. Of course, it’s still useful to test containers using Gremlin’s Shutdown, Process Killer, and other experiment types, but Memory helps us answer more questions that may save time, effort, and future incidents.
Looking back at the Scenario, there’s only one step: consume 100% of all memory available to the target for one minute. The “available to the target” part is important—remember that you can specify resource limits to containers and Pods. If you set a Pod’s resource limit to 1 GB and run a memory experiment that uses 100% of available memory, Gremlin will consume 1 GB of RAM regardless of the amount of RAM on the host.
Adding a Health Check to a Gremlin Scenario
Before running this Scenario, let’s add a Health Check. Much like liveness probes are to Kubernetes, Health Checks are Gremlin’s way of checking to make sure a service is still available. It sends an HTTP request to an endpoint that you specify, checks the response, and as long as the response meets the criteria that you set (HTTP response code and response time), the Health Check is successful. If the endpoint responds too slowly, returns an error, or doesn’t respond at all, the Health Check fails, and Gremlin immediately stops the actively running Scenario and returns the system back to normal. Gremlin natively integrates with a number of observability tools, and we recommend using your existing monitors or alerts as Health Checks instead of creating brand new ones.
Chances are if you’re using an observability tool for Kubernetes, you already have easy access to a metric or alert that monitors service health. But for a quick and easy solution, you can also use the Nginx container’s public-facing URL as the endpoint for your Health Check.
To add the Health Check, first open the Gremlin web app at app.gremlin.com, or click this link to go directly to the Scenario. From this page, click Customize. This brings you to a page where you can change the steps in the Scenario. Under the “Health Checks” heading, click Add Health Check. If you or someone else in your team has already created a Health Check, you can select it here. Otherwise, you can create a new one. For this blog, I’ll be using a Health Check I already created called “Application frontend.”
Next, we need to select targets for this experiment. Clicking on the three-dot menu icon on the right side of the experiment node and selecting Edit opens a pane where you can select which systems to target. Since we’re targeting a Kubernetes Pod, click the Kubernetes tab, then select your target Deployment, DaemonSet, StatefulSet, or standalone Pod. You can also use the search box just below the cluster name to find a specific target, and choose between different clusters and namespaces using the drop-down boxes.
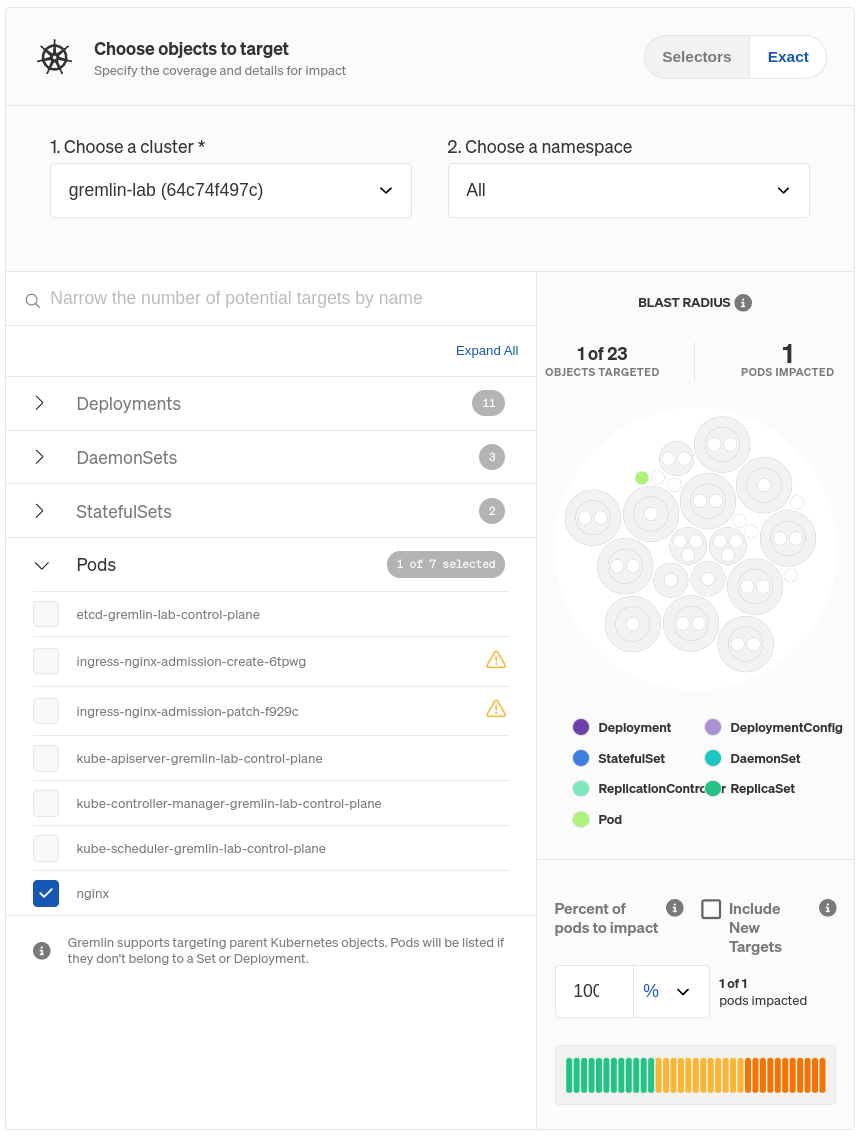
Once you choose your target(s), you’ll see it highlighted to the right. This is your blast radius. This just represents the resources that will be directly impacted by the experiment. Below that, you can specify the number or percentage of Pods within the Deployment to target, assuming you don’t want to target all of them. If you reduce this number, Gremlin will randomly choose targets from the pool of available targets until it meets the number or percentage you specify. You can also choose to exclude new Pods from the experiment, in case one spins up while the Scenario is running. We don’t want this, so make sure Include New Targets is unchecked!
Click Update Scenario to save your changes, then click Save Scenario. When you’re ready to run the Scenario, click Run Scenario. The first thing Gremlin does is run the Health Check and ensure your metrics are in a healthy state. Next, the memory experiment starts. The sequence of events looks like this:
- Gremlin creates a sidecar container running in the Nginx Pod.
- Gremlin calculates how much memory to allocate, then allocates it (or at least, as much as it can).
- The kubelet (the Kubernetes agent running on the node) notices that the Pod is using more memory than has been allocated to it, so it triggers the OOM killer and terminates the Pod.
- Depending on the Pod’s restart policy, the kubelet either restarts it or leaves it alone.
- Assuming the Pod hasn’t already been restarted, the kubelet runs the liveness probe, notices that the container isn’t running, and responds according to its restart policy.
Assuming our restart policy isn’t set to Never, we should see our Pod come back up again. And in fact, that’s exactly what we see:
We can see what happened by querying our Pod using kubectl describe pod nginx and scrolling down to the Events section:
To make this more robust, we could deploy our Nginx container as a Deployment instead of a standalone Pod and increase its replica count to two or higher. This way, if one of the Pods fails due to a memory leak or other critical problem, its replica can continue serving traffic while Kubernetes restarts the failed Pod.
What other Kubernetes resilience scenarios should I be testing for?
This is just the latest in a long line of blogs covering Kubernetes failure modes. We’ve also looked at making sure you can tolerate lost nodes, how to troubleshoot unschedulable Pods, and how to ensure your Pods have enough memory to run reliably. We’ve also taken a more in-depth look at liveness probes and how exactly they keep your Pods up and running. You can also use our resources page to find more information on how to keep your Kubernetes clusters running smoothly.
Length:
1 minute
Experiment(s):
Gremlin's automated reliability platform empowers you to find and fix availability risks before they impact your users. Start finding hidden risks in your systems with a free 30 day trial.
sTART YOUR TRIALTo learn more about Kubernetes failure modes and how to prevent them at scale, download a copy of our comprehensive ebook
Get the Ultimate Guide