
As systems become increasingly complex, we’ve seen the growth of engineering tools to abstract away and manage the complexity. But often our tools are “opinionated” and the default actions or settings may not align with how our systems are intended to work or how we think they work. Chaos Engineering is a good way to not only test your applications, but also the tools you use to build them.

Containerize it!
A few weeks ago, AWS released a new tool, AWS App2Container. Although my friend Corey Quinn would have you believe that all AWS service names are nonsensical, this one is extremely transparent: It transforms apps into containers. Along with the container image, it also generates deployment manifests for Amazon ECS and EKS so you can easily run your application. For most organizations, this packaging and deployment automation is typically handled by a mix of tools (e.g. Hashicorp’s Packer and Terraform) and a lot of custom code.
But the free tool comes with a few limitations. First, it only works on Java and .NET applications. Second, as I had mentioned, abstractions come with assumptions. This means you’ll not only need to test that your application behaves correctly in a container, but you’ll also need to test that you’re receiving the benefits of running in a containerized environment.
Correctness - Shutdown Scenario
Services written for container environments are typically designed to be more ephemeral than those designed for VMs or traditional servers. Kubernetes and Amazon ECS excel at restarting failed services, but sudden service shutdowns can lead to data loss, corruption, or other knock-on effects for services that aren’t designed to handle such dynamic infrastructure.
Use the Kubernetes - Correctness - Shutdown a service Scenario to target and shutdown the containers generated by AWS App2Container. Verify that traffic is automatically rerouted to new instances of your service, that any data stores are reconnected, and that any user sessions are maintained or handled gracefully. Also verify that any data transmitted during the Chaos Experiment is handled correctly (i.e. stored correctly or retried).
Run this Scenario in Gremlin →
Autoscaling via CPU
In addition to reliability benefits, Amazon ECS and EKS both feature autoscaling functionality. To test if your newly containerized application can take advantage of autoscaling, first try manually scaling the service. Once you’ve verified that your service can scale, setup autoscaling and configure your autoscaling policy (see the documentation for ECS or EKS). Then use the Kubernetes - Scaling - Autoscaling via CPU Scenario to verify that your autoscaling works (note that you may need to adjust the CPU values in the attack to trigger your policy).
Run this Scenario in Gremlin →
Chaos in the AWS Well-Architected Framework
If you’re using tools like AWS App2Container and running your apps in AWS, take some time to review the AWS Well-Architected Framework (WAF).
The WAF is a guide for building applications centered on 5 “pillars”: operational excellence, security, reliability, performance efficiency, and cost optimization. AWS recently updated their reliability pillar to include a stronger focus on Chaos Engineering.

Chaos in Gremlin
This past spring, the team that built and manages our deployment pipeline ran a GameDay and quickly realized they had little visibility into the health of one of our deployment tools. The only way to check if it was working properly was to run a deployment!
It’s easy to underestimate the importance of observability and reliability in your engineering tools—especially when those tools are internal and the only “customer” is yourself or other engineers who can easily inform you of problems (or even fix it themselves). Although we naturally tend to place our customer’s needs over our own, prioritizing the reliability of your own tooling helps ensure that you can quickly and reliably respond to your customer’s needs.
Have you run any Chaos Experiments on your internal engineering tools? If you have a chatops tool, what would cause it to fail and how would that impact your team? How would an incident in your deployment pipeline impact developer velocity? Run a GameDay on an internal tool this week and let us know what you learn!
Not sure where to start testing your internal tools or need help simulating an issue with Gremlin? Reach out to support@gremlin.com!

What’s new in Gremlin
Windows Release
The Windows agent is now generally available! Windows agents have 7 Gremlin attacks available (CPU, Disk, IO, Memory, Shutdown, Blackhole, and DNS).
Status Checks
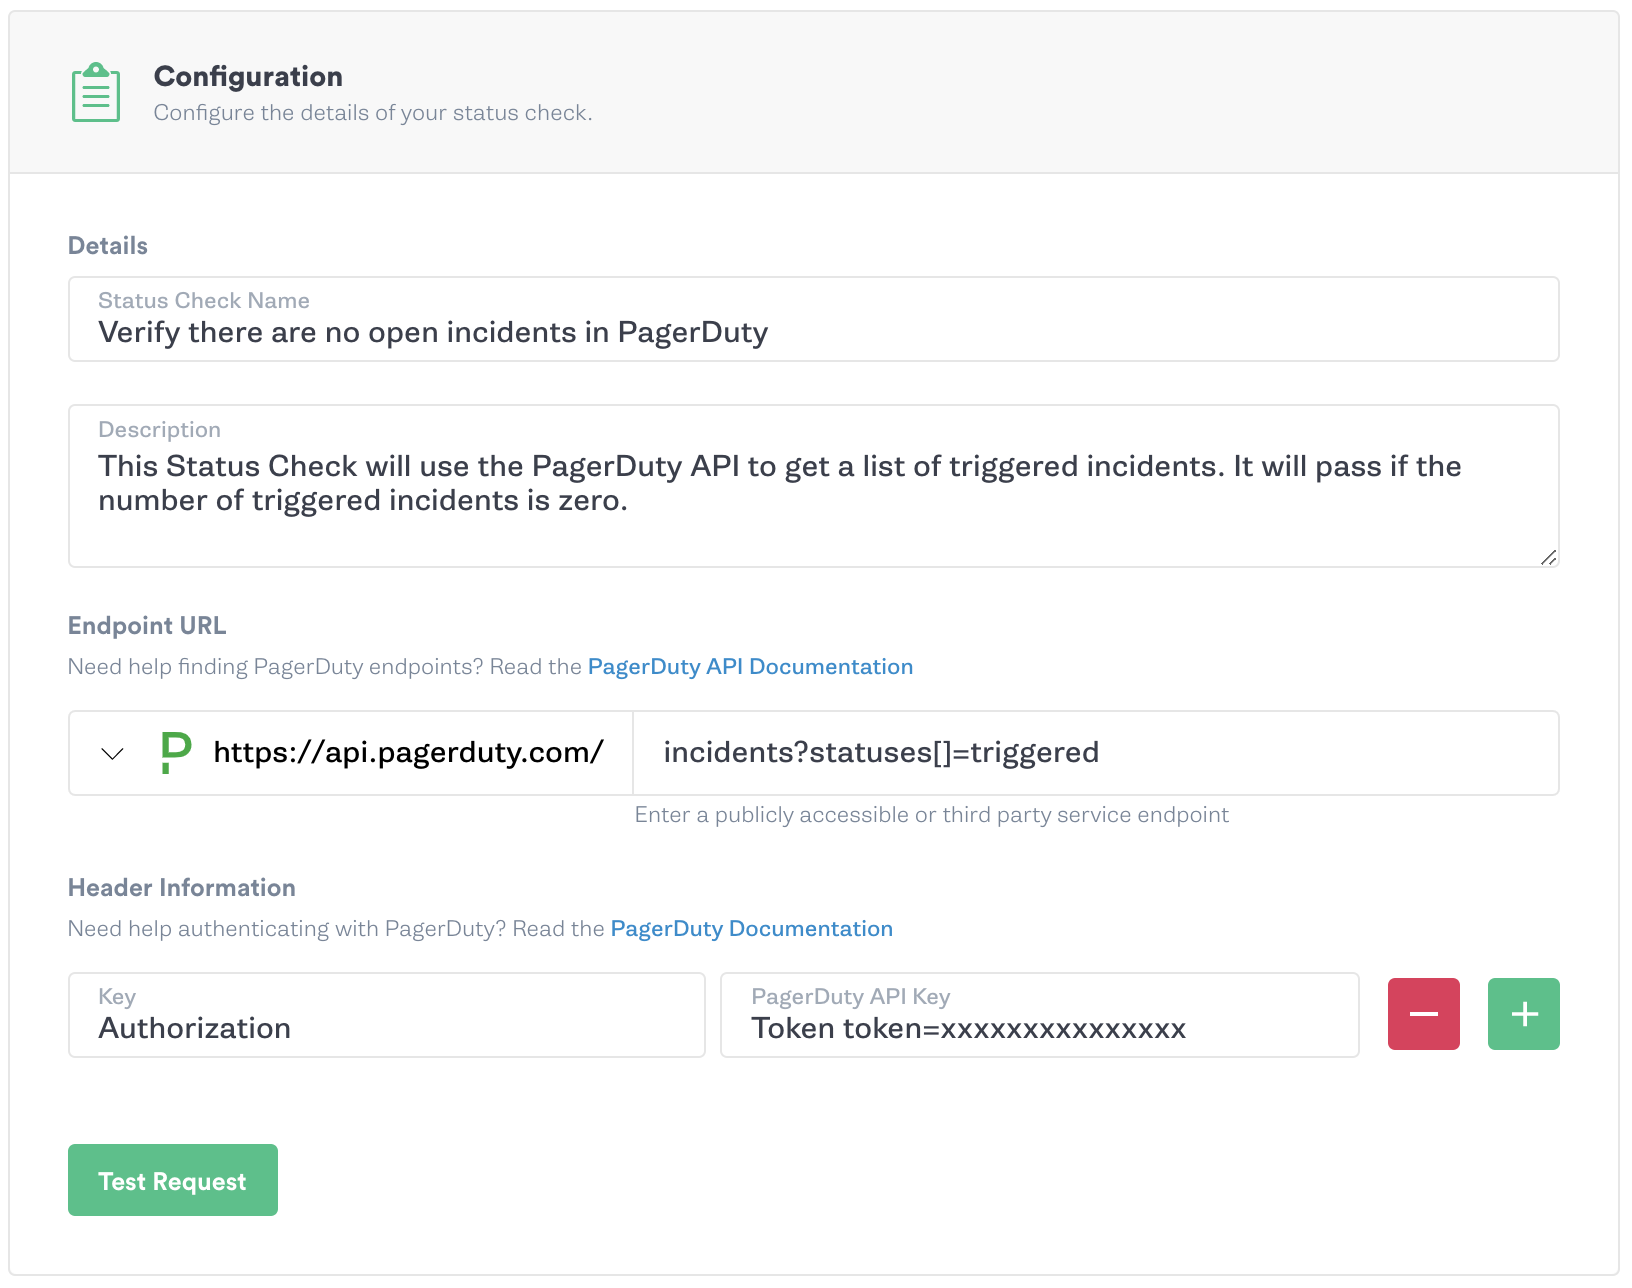
Gremlin is excited to announce Status Checks, which allow you to verify the health of your systems before, during, and after running attacks in a Chaos Engineering Scenario. If the Status Check passes, attacks are run as they normally would. But if a Status Check fails, the Scenario will be halted to prevent further damaging your systems.
You can use existing third-party presets with Datadog, New Relic or PagerDuty to quickly build your first Status Check, or use a custom Status Check to hit any API endpoint. Schedule a Scenario with confidence and set up notifications to be emailed if the Scenario halts. Check out the blog post, tutorial, and documentation to get started today!
Scenario Multiple Attack Types in Series
Multiple Attack Types in series enables you to recreate incidents with multiple failure modes, introduce cascading failure, and ultimately build Scenarios that make use cases easy to develop. For example, string together latency attacks leading up to a blackhole attack to simulate dependency degradation and failure or simulate a memory leak with resource attacks that lead to a shutdown attack of the host.
Scenario Editing
You can now edit a Scenario that has been run rather than duplicating and creating a new Scenario. This enables you to quickly iterate on attack parameters and targets while keeping a history of the run to track the evolution of the chaos experiment.
Other important features we’ve added include:
- We’ve consolidated the Custom/Draft pages under the “My Scenarios” area to enable easier viewing of all Scenarios.
- We added a “New Runs” section in each Scenario with filtering that clearly lists out each prior run and its final status. This page also allows you to easily revert the experiment to a prior version.
- Each Scenario Run and Scenario Draft now also has a unique URL so you can easily view and share your Experiments and findings with teammates.

Blast Radius / Impact UI Improvement
As your infrastructure grows, it can be difficult to correlate how many hosts or services are impacted by an attack.
We’ve improved the Blast Radius UI to show how many targets will be impacted based on your percentage selection, as well as visually communicate the impact it will have with a severity bar.
Kubernetes Enhancements - Targeting and API Examples
You now have the ability to select a percentage of pods in a deployment to target with a Kubernetes attack! Previously, Kubernetes attacks were limited to targeting all resources in a given primitive, for example targeting all the pods in a deployment.
We added Gremlin API Examples to Kubernetes attacks and Scenarios! This enables you to quickly configure an attack or Scenario via the UI and automatically generate the corresponding API endpoint and request payload information to programmatically create and run the same attack or Scenario. After creating your attack or Scenario, click the “Gremlin API Examples” to the right of the “Run” button. Using this information you can easily add Chaos to your build and deployment pipelines to automatically ensure your applications are reliable!
For a list of features and updates to the Gremlin agent, see our release notes. We’re constantly working on new features and enhancements. To see what’s on our roadmap and suggest new features, visit our product board.

Gremlin's automated reliability platform empowers you to find and fix availability risks before they impact your users. Start finding hidden risks in your systems with a free 30 day trial.
sTART YOUR TRIALTo learn more about how to proactively scan and test for AWS reliability risks and automate reliability management, download a copy of our comprehensive guide.
Get the AWS PrimerWhat is Failure Flags? Build testable, reliable software—without touching infrastructure
Building provably reliable systems means building testable systems. Testing for failure conditions is the only way to...


Building provably reliable systems means building testable systems. Testing for failure conditions is the only way to...
Read moreIntroducing Custom Reliability Test Suites, Scoring and Dashboards
Last year, we released Reliability Management, a combination of pre-built reliability tests and scoring to give you a consistent way to define, test, and measure progress toward reliability standards across your organization.

Last year, we released Reliability Management, a combination of pre-built reliability tests and scoring to give you a consistent way to define, test, and measure progress toward reliability standards across your organization.
Read more