Dashboard
Platform

Webhooks

Overview

Webhooks let you call custom HTTP endpoints when running experiments. Using webhooks, you can easily send the state of an experiment to a third-party tool or service. This allows you to integrate tools such as monitoring services and incident management services. For example, using a webhook in combination with a monitoring tool lets you correlate experiments with changes in system behavior, helping you address issues observed during chaos experiments more quickly and easily.

To access webhooks, log into the Gremlin web app, and open the Team Settings page.

Usage

Webhooks are created at a Team level and can be triggered by 3 events:

Trigger Description
Experiment initialized The experiment has been triggered but is not yet running or is ramping up.
Experiment running The experiment has begun running.
Experiment finished The experiment has finished.

The output format of the webhook can be customized using tokens to match the required input format of the tool you are integrating with. The information supplied in the request includes:

Default Key Description Token
teamId The unique team identifier of the team that ran the experiment. ${TEAM_ID}
attackId The experiment unique identifier. ${ATTACK_ID}
attackType The Gremlin experiment type. ${ATTACK}
stage The furthest stage realized by the experiment. ${STAGE}
attackStatus The trigger event for the request (Initialized, Running, Finished). ${STATUS}
source The source of the experiment (API, Manual, Scheduled, Spinnaker, WebApp). ${SOURCE}
time The timestamp of the triggered event. ${TIME}

Results will be sent to the specified endpoint in JSON format. For example:

JSON

{
    "teamId": "${TEAM_ID}",
    "attackId": "${ATTACK_ID}",
    "attackType": "${ATTACK_TYPE}",
    "stage": "${STAGE}",
    "attackStatus": "${STATUS}",
    "source": "${SOURCE}",
    "time": "${TIME}"
}

Create a webhook

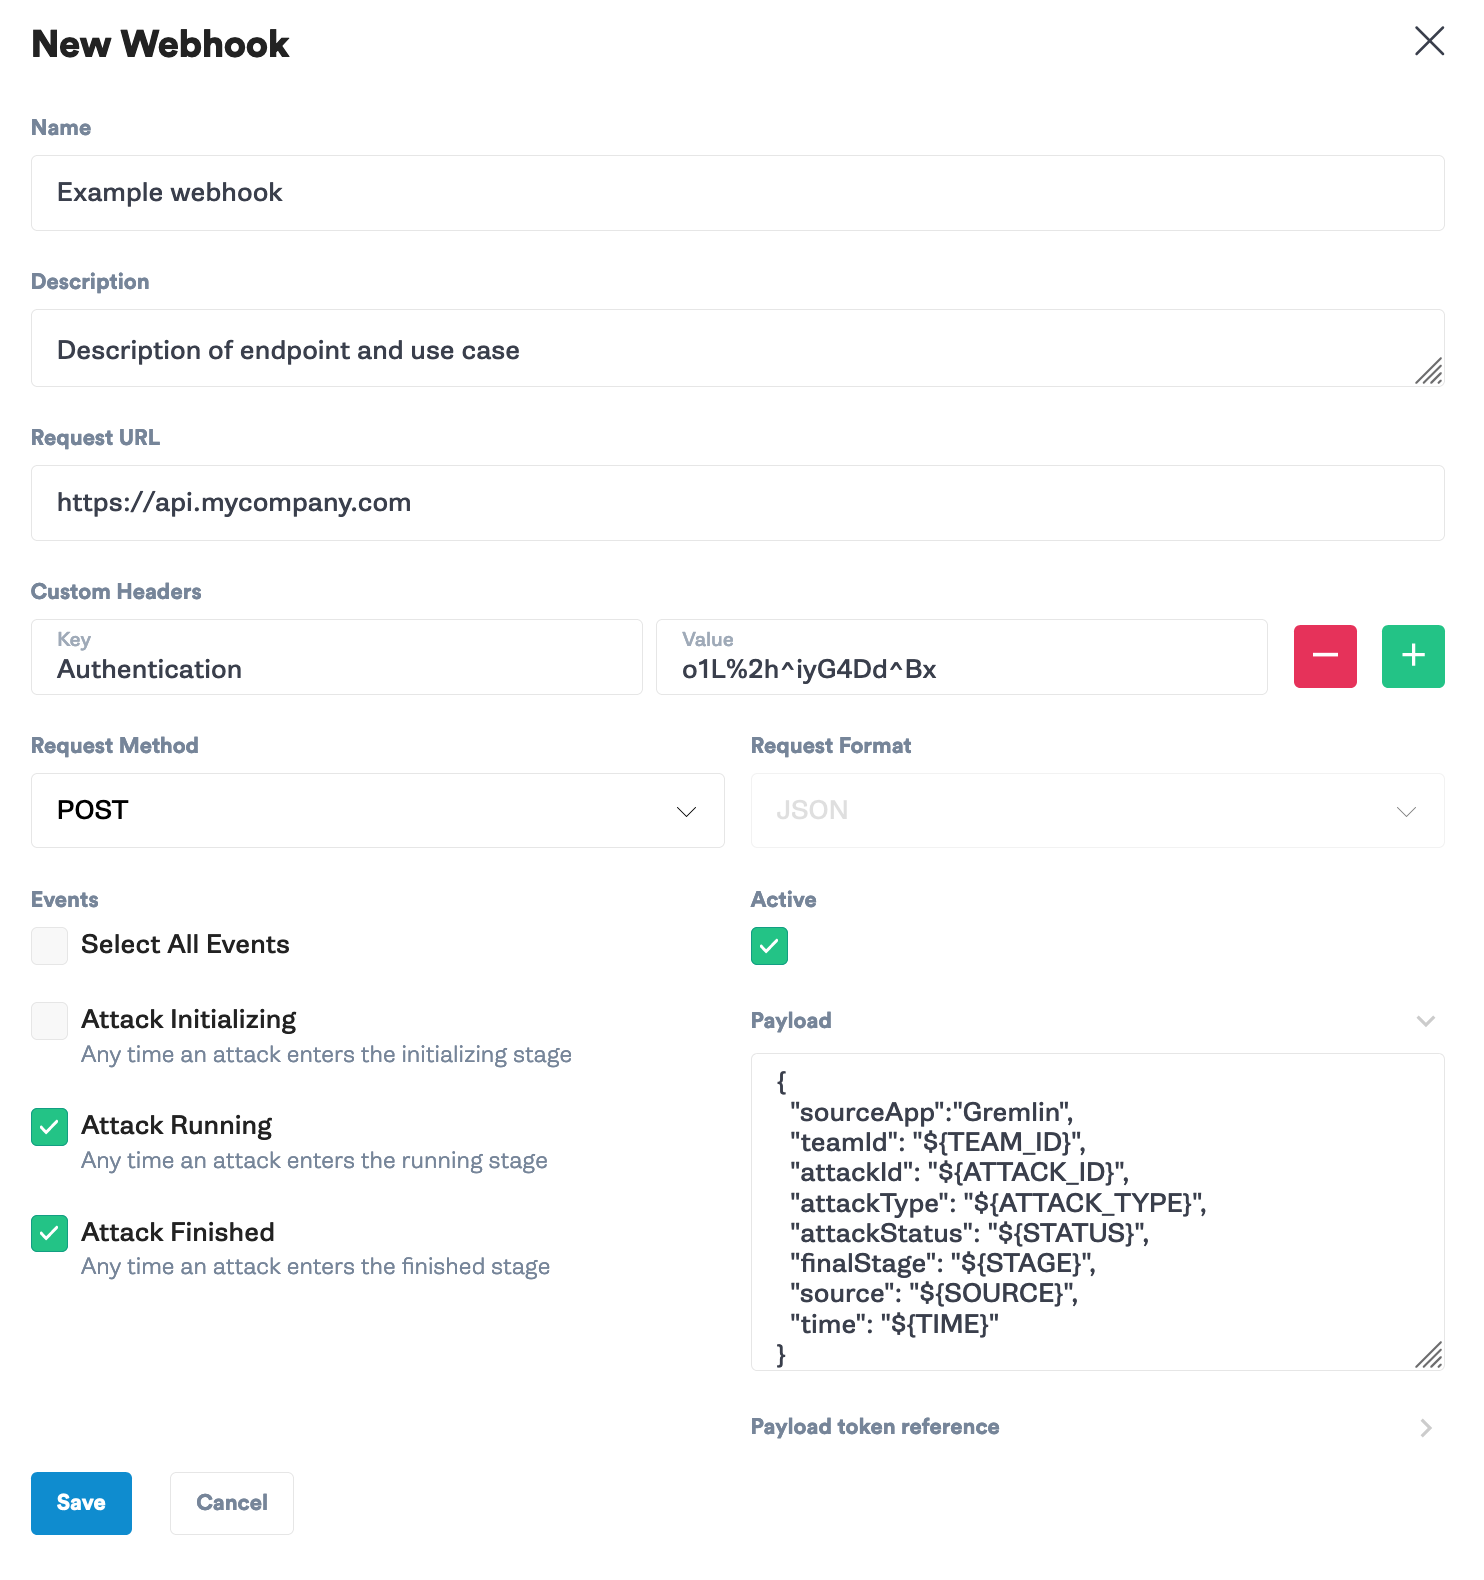
To create a webhook, click New Webhook and enter a name, description, endpoint URL, any custom headers to include in the request, trigger events, and modify the format of the payload. Provide a descriptive name and a detailed description that explains what the endpoint URL is and how it uses the webhook. The endpoint URL is where the webhook will send the request.

If you want to use webhooks with 3rd party tools that are privately hosted, or you have strict network security policies that prevent you from exposing your systems to the Internet, you can use our Integration Agent and Private Network Webhooks. The Integration Agent and Private Network Webhook feature is only available to Enterprise customers.

You can use the custom headers field to add HTTP headers to the request, such as unique identifiers or authentication credentials. Choose the request method (POST or PUT). Select which events you want to fire the webhook on. Lastly, if required, modify the payload to match the format requested by the receiving endpoint. Click Save to save and enable the webhook.

Delete, deactivate, or reactivate a webhook

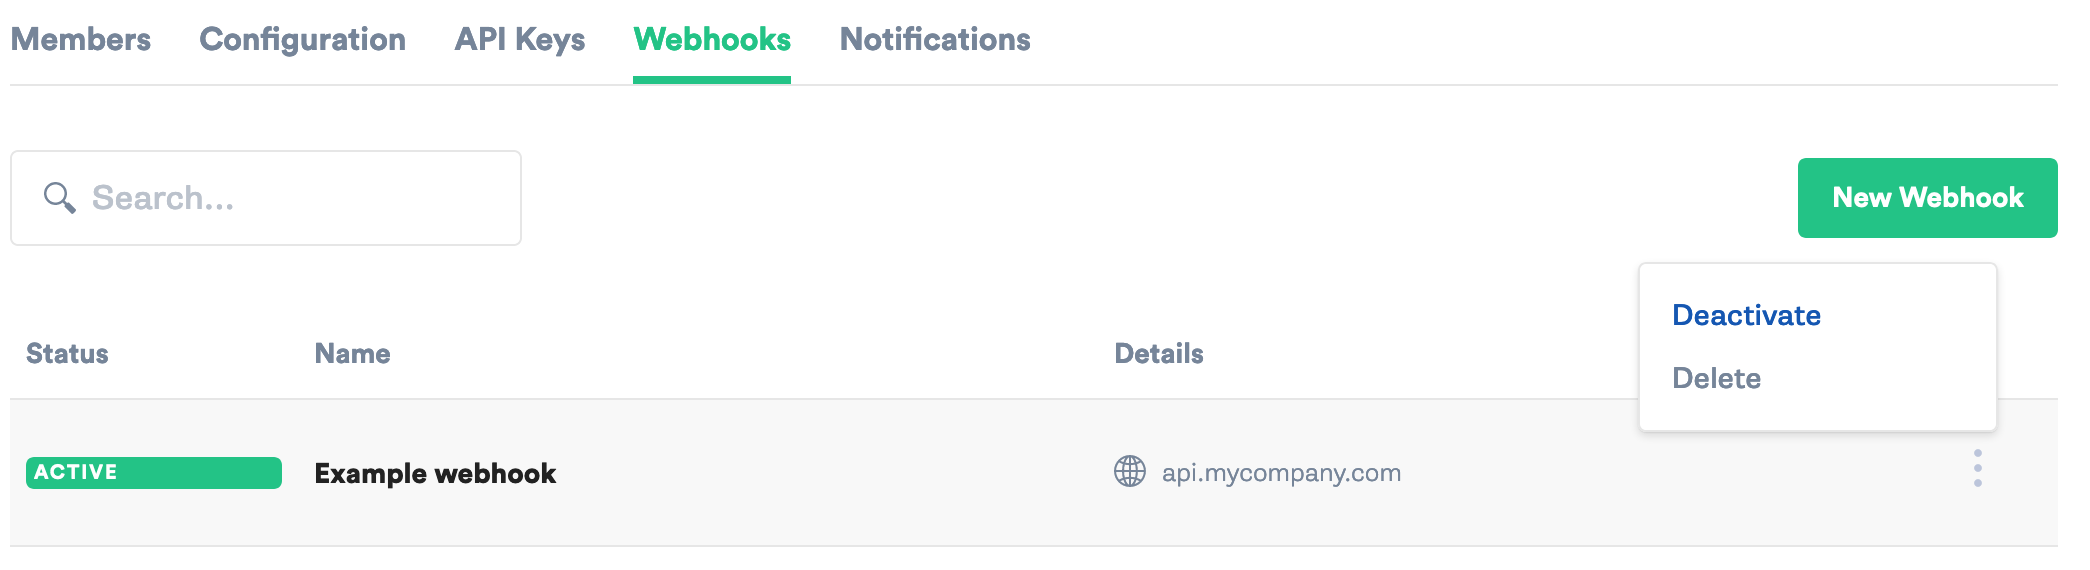
To delete a webhook, click on the dropdown next to the webhook and select Delete. Note that deleting a webhook is permanent and cannot be reversed. Once deleted, Gremlin will no longer send requests to the endpoint.

Deactivating a webhook prevents Gremlin from sending requests to the endpoint without having to delete the webhook. This is useful for temporarily stopping webhooks and making offline changes. To deactivate a webhook, click on the dropdown next to the webhook and select Deactivate. For a deactivated webhook, click Activate to reactivate it.

Webhook IP ranges

If your firewall is blocking the utilization of the webhook feature you will need to add the following IP address to your allow list.

SH

44.236.227.116
54.186.237.228
44.239.162.49
44.240.200.121


No items found.
Next
Previous
This is some text inside of a div block.
Compatibility
Installing the Gremlin Agent
Authenticating the Gremlin Agent
Configuring the Gremlin Agent
Managing the Gremlin Agent
User Management
Integrations
Health Checks
Notifications
Command Line Interface
Updating Gremlin
Quick Start Guide
Services and Dependencies
Detected Risks
Reliability Tests
Reliability Score
Targets
Experiments
Scenarios
GameDays
Overview
Deploying Failure Flags on AWS Lambda
Deploying Failure Flags on AWS ECS
Deploying Failure Flags on Kubernetes
Classes, methods, & attributes
API Keys
Examples
Container security
General
Linux
Windows
Chao
Helm
Glossary
Alfi
Additional Configuration for Helm
Amazon CloudWatch Health Check
AppDynamics Health Check
Application Level Fault Injection (ALFI)
Blackhole Experiment
CPU Experiment
Certificate Expiry
Custom Health Check
Custom Load Generator
DNS Experiment
Datadog Health Check
Disk Experiment
Dynatrace Health Check
Grafana Cloud Health Check
Grafana Cloud K6
IO Experiment
Install Gremlin on Kubernetes manually
Install Gremlin on OpenShift 4
Installing Gremlin on AWS - Configuring your VPC
Installing Gremlin on Kubernetes with Helm
Installing Gremlin on Windows
Installing Gremlin on a virtual machine
Installing the Failure Flags SDK
Jira
Latency Experiment
Memory Experiment
Network Tags
New Relic Health Check
Overview
Overview
Overview
Overview
Overview
Packet Loss Attack
PagerDuty Health Check
Preview: Gremlin in Kubernetes Restricted Networks
Private Network Integration Agent
Process Collection
Process Killer Experiment
Prometheus Health Check
Role Based Access Control
Running Failure Flags experiments
Scheduling Scenarios
Shared Scenarios
Shutdown Experiment
Slack
Teams
Time Travel Experiment
Troubleshooting Gremlin on OpenShift
User Authentication via SAML and Okta
Users
Webhooks
Integration Agent for Linux
Test Suites
Restricting Testing Times
Reports
Process Exhaustion Experiment
Enabling DNS collection