


Dynatrace Health Check
Supported platforms:
Adding a Dynatrace Health Check requires the following steps:
- Identify your Dynatrace instance ID
- Identify the entity in Dynatrace that you want to use for the Health Check
- Format the entity URL using the entity ID
- Set up the Health Check in Gremlin
Identifying your Dynatrace instance ID
First, you'll need your Dynatrace instance ID. This uniquely identifies your Dynatrace account.
Navigate to your Dynatrace instance in a web browser. The start of the URL will look similar to this: https://qpm46186.live.dynatrace.com/. The first part of the URL is your Dynatrace instance ID. In this example, the instance ID is qpm46186.
Keep this instance ID handy for later reference.
Identifying the Dynatrace entity you want to use for the Health Check
Next, you'll need the ID of the Dynatrace entity (the entity ID) you want to monitor. These instructions will vary depending on whether your service is a host or a Kubernetes resource.
Host-based Health Checks
- In the Dynatrace web app, click on the Hosts link in the sidebar, then click on the name of the host you want to monitor.
- Once the host details screen has loaded, copy the relevant entity ID from your browser’s URL bar. In the screenshot below, the entity ID is highlighted in red.

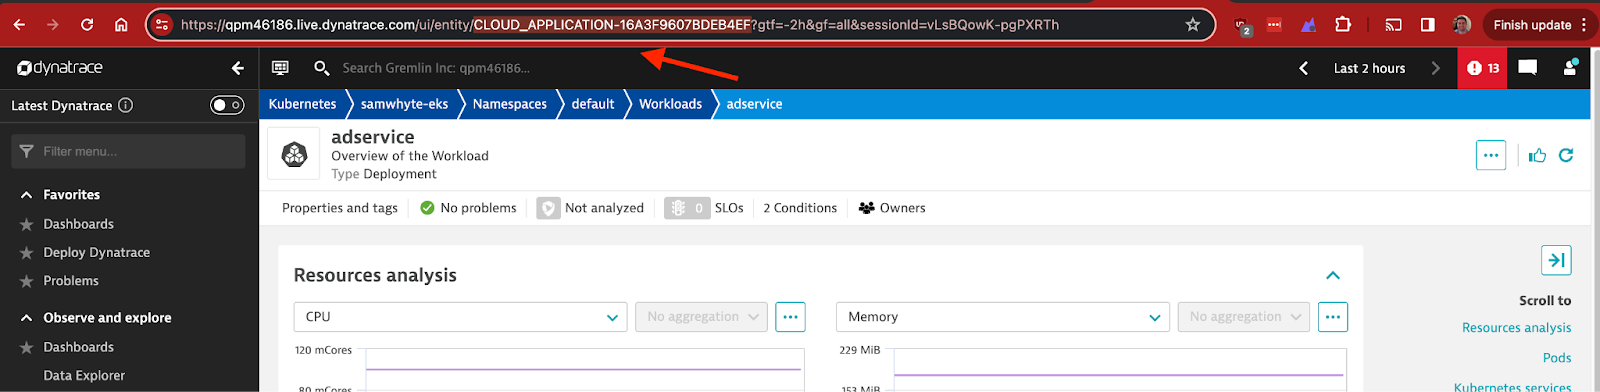
Kubernetes-based Health Checks
- In the Dynatrace web app, click on the Kubernetes link in the sidebar, then click on the Kubernetes cluster you want to monitor.
- On the cluster details screen, click on the namespace where your Kubernetes object is deployed.
- Click on the name of the Kubernetes object that you want to monitor.
- Once the object’s details screen has loaded, copy the relevant entity ID from your browser’s URL bar. In the screenshot below, the entity ID is highlighted in red.
Formatting the Dynatrace entity URL
Once you have your Dynatrace instance ID and entity ID, you can create the API call for the Gremlin Health Check. Use the following URL, replacing INSTANCE_ID with your Dynatrace instance ID, and ENTITY_ID with your Dynatrace entity ID:
https://INSTANCE_ID.live.dynatrace.com/api/v2/problems?problemSelector=status("open")&entitySelector=entityId("ENTITY_ID")
Creating the Health Check in Gremlin
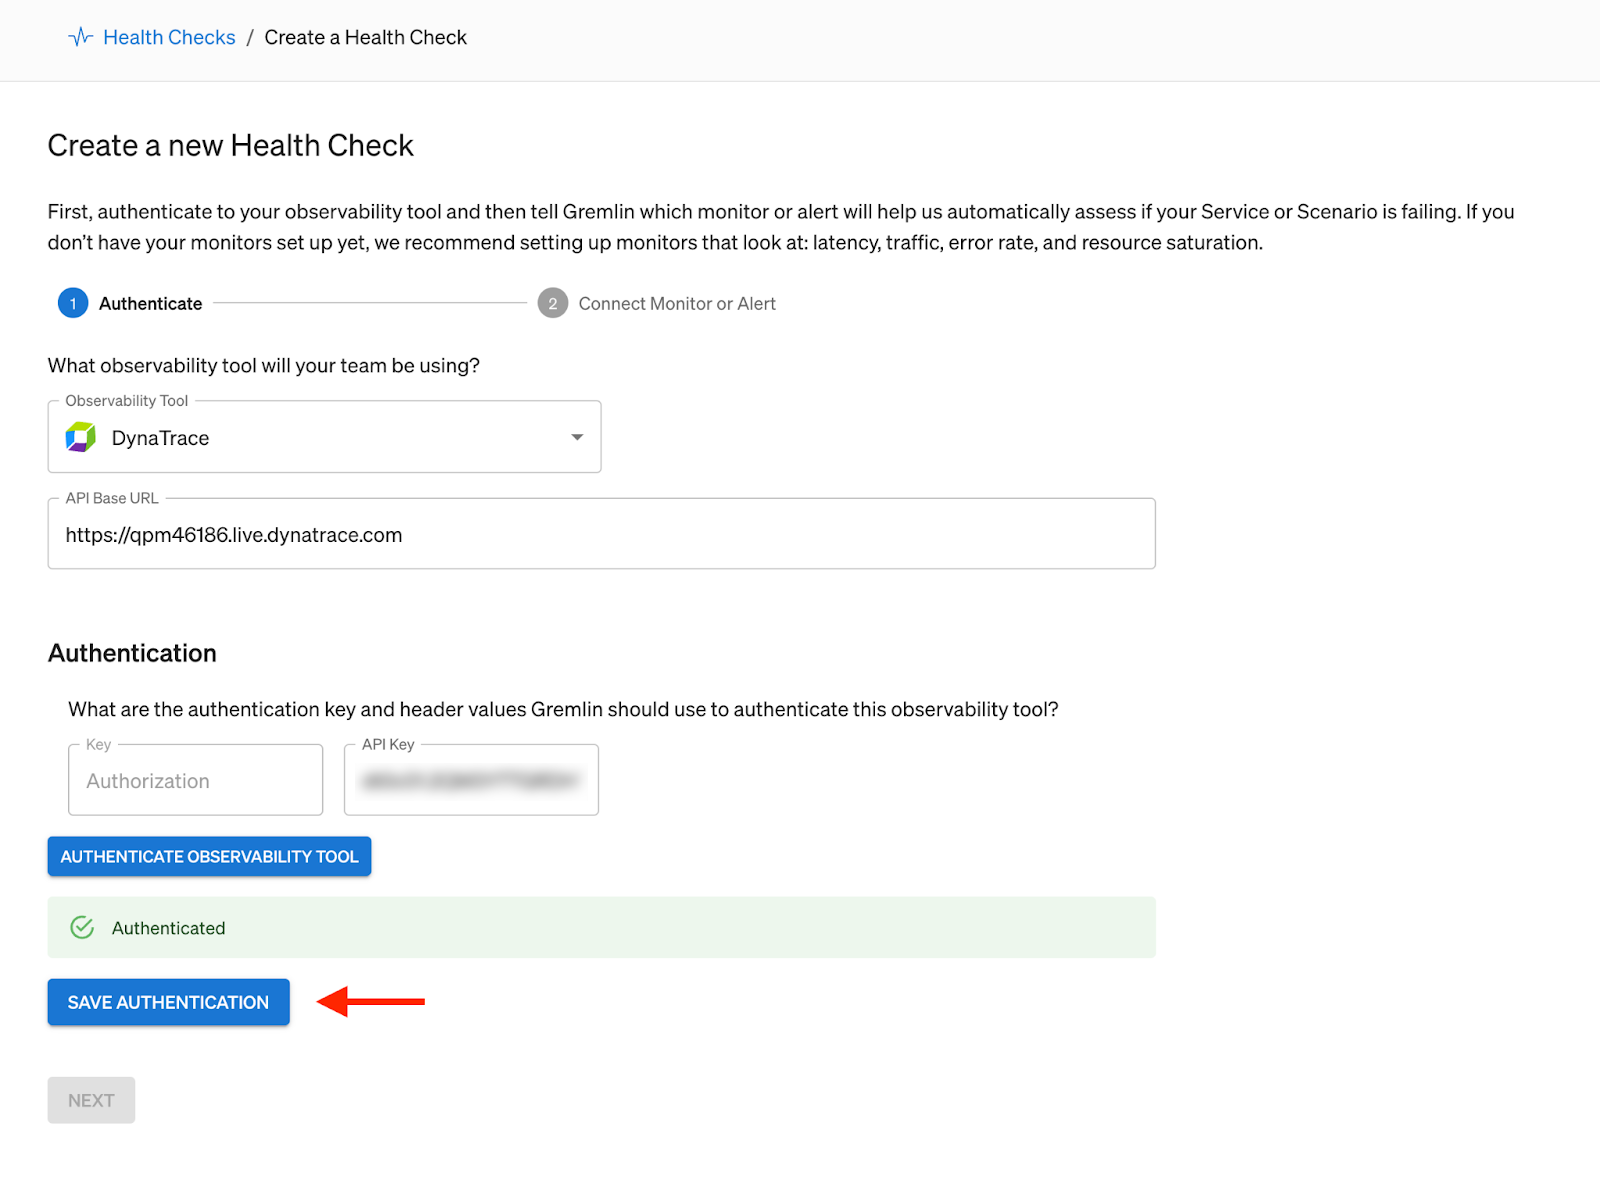
Before creating the Health Check, you'll need to authenticate your Gremlin account with Dynatrace. This is a one-time step per Gremlin team. Once the authentication is saved, it becomes available to your entire Gremlin team. If you or someone else in your Gremlin team has already authenticated with Dynatrace, you can skip this section and go directly to Creating a Dynatrace Health Check.
Authenticating with Dynatrace
To authenticate with Dynatrace in Gremlin:
- Open the Health Checks page in the Gremlin web app, click + Health Check, then select Dynatrace from the Integrations drop-down.
- Enter the API base URL for your Dynatrace account. Replace
INSTANCE_IDwith the actual ID of your Dynatrace instance:https://INSTANCE_ID.live.dynatrace.com/ - In the Dynatrace web app, copy or create an API key. This key will require read permissions for both the
problemsAPI and thesyntheticsAPI. - Back in the Gremlin web app, under Authentication, paste the API key into the API Key box.
- Click Authenticate Observability Tool to send a test request. If Gremlin successfully receives a response, click Save Authentication.
A successful authentication will look similar to the following screenshot:
Creating a Dynatrace Health Check
Now that you've authenticated, you can create your Health Check:
- Open the Health Checks page in the Gremlin web app, click + Health Check, then select Dynatrace from the Integrations drop-down and click Next.
- Enter a meaningful Name for the Health Check. As a best practice, the name should accurately indicate what the Health Check is monitoring.
- Retrieve the entity URL you created previously, and paste it into the Entity URL field. For example:
https://INSTANCE_ID.live.dynatrace.com/api/v2/problems?problemSelector=status("open")&entitySelector=entityId("ENTITY_ID") - Click Test Health Check. Gremlin will query Dynatrace using the instance ID, entity ID, and API key you provided.
- If Gremlin successfully connects to the monitor, you can save the Health Check by clicking Create Health Check. You can now add this Health Check to any Scenario or Service in your Gremlin team.
