Detected Risks
Detected Risks are high-priority reliability concerns that Gremlin automatically identified in your environment. These risks can include misconfigurations, bad default values, or reliability anti-patterns. Gremlin prioritizes these risks based on severity and impact for each of your services. This gives you near-instantaneous feedback on risks and action items to improve the reliability and stability of your services.
This guide is also available as a video:
Viewing Detected Risks in Gremlin
Gremlin provides a visual indicator of the number of Detected Risks on the Service Catalog view, as well as on the service details page. Detected Risks are shown in a separate indicator next to the reliability score.
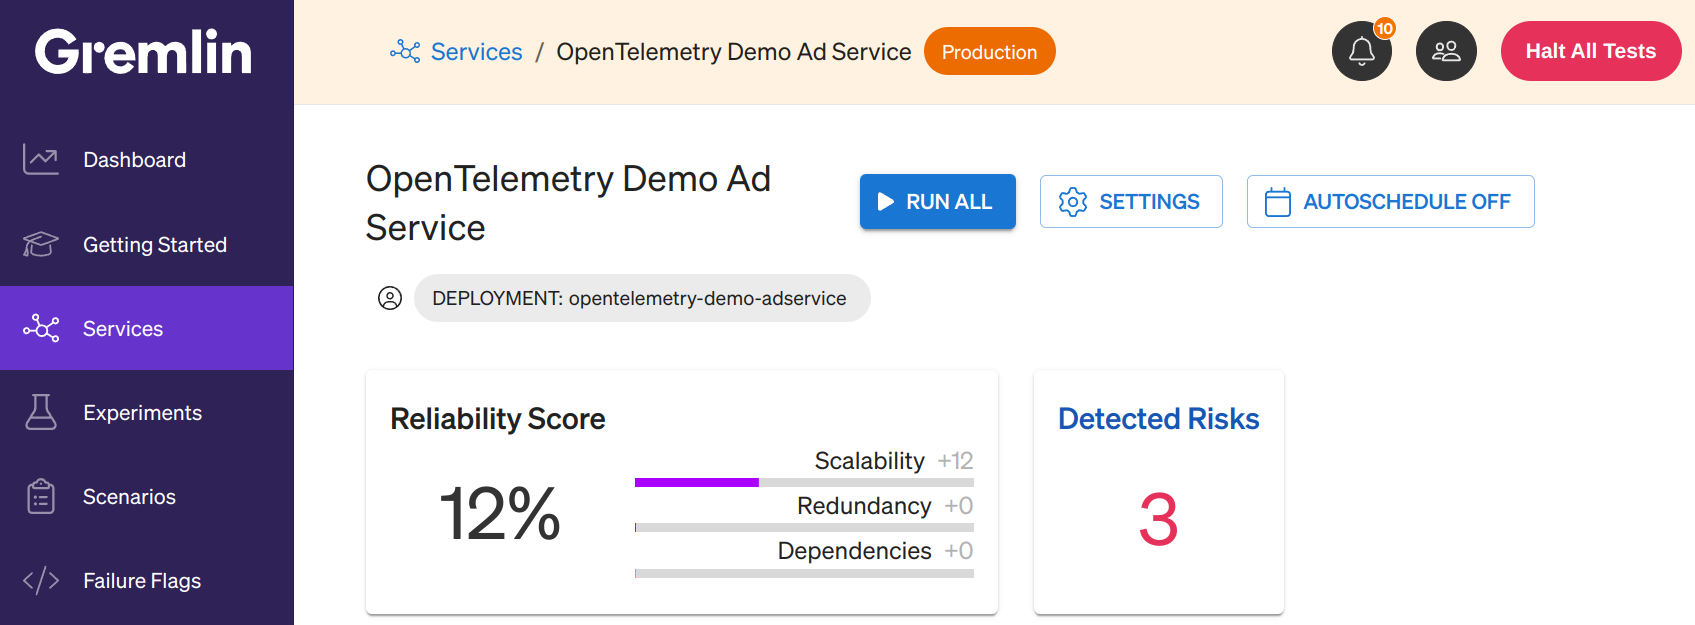
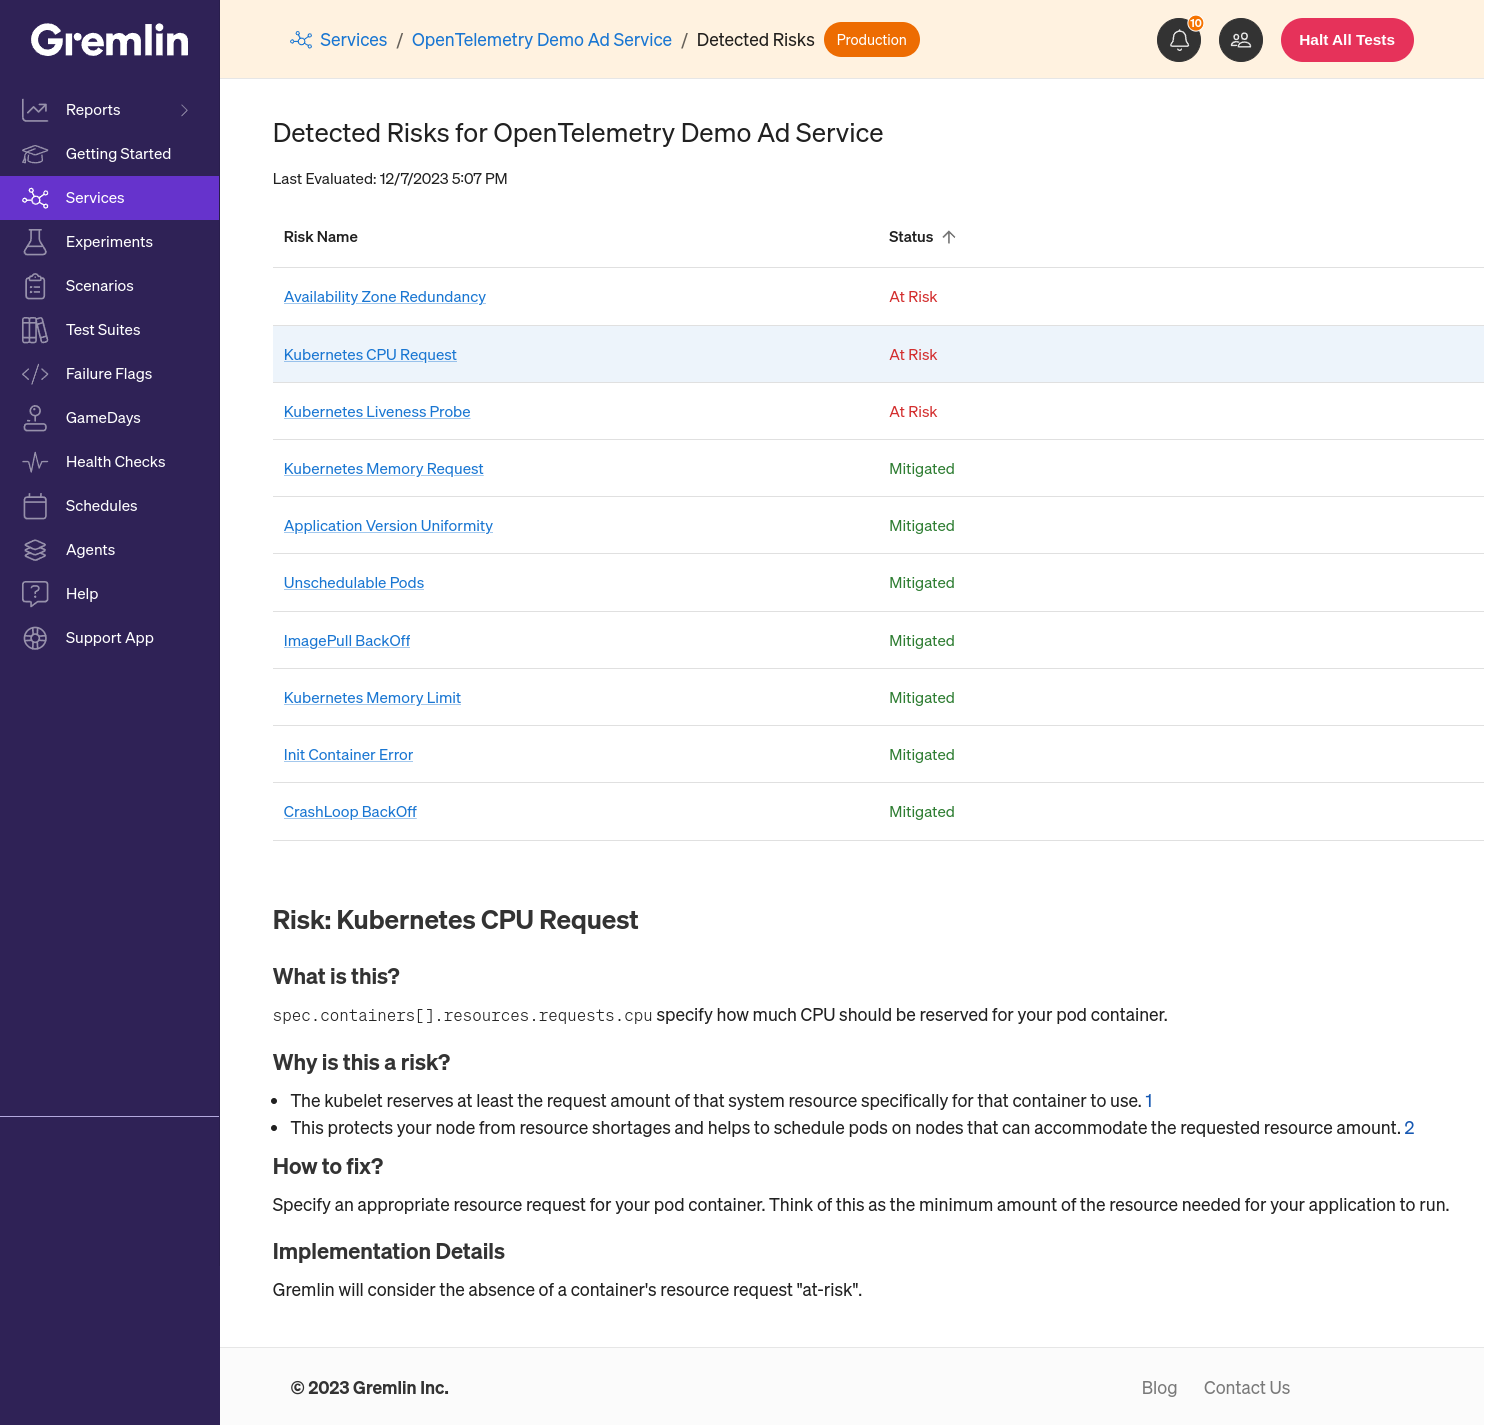
Click on this indicator to see a list of all potential Detected Risks for your service. Each risk will show one of three statuses:
- <span class="red-text">At Risk</span>: This risk is currently present in your systems and hasn't been addressed.
- <span class="green-text">Mitigated</span>: This risk has been fixed since it was last detected.
- N/A: This risk could not be evaluated. A warning tooltip will be shown next to the risk with more details.
Clicking on a risk name provides additional information about the risk, including guidance on how to fix it.
Once you've addressed a risk, refresh the page to confirm that it's been mitigated.
Kubernetes Detected Risks
In a Kubernetes environment, Gremlin will detect the following set of risks:
- CPU Requests
- Liveness Probes
- Availability Zone Redundancy
- Memory Requests
- Memory Limits
- Application Version Uniformity
- CrashLoopBackOff
- ImagePullBackOff
- Init Container Error
- Unschedulable Pods
CPU Requests
What is this?
<span class="code-class-custom">spec.containers[].resources.requests.cpu</span> specifies how much CPU should be reserved for your pod container.
Why is this a risk?
- The kubelet reserves at least the request amount of that system resource specifically for that container to use.
- This protects your node from resource shortages and helps to schedule pods on nodes that can accommodate the requested resource amount.
How can I fix this?
Specify an appropriate resource request for your pod container. Think of this as the minimum amount of the resource needed for your application to run.
How does this work?
Gremlin will consider the absence of a container's resource request "at-risk".
Liveness Probe
What is this?
<span class="code-class-custom">spec.containers[].livenessProbe</span> specifies how the kubelet will decide when to restart your pod container.
Why is this a risk?
The kubelet uses liveness probes to know when to restart a container. For example, liveness probes could catch a deadlock, where an application is running, but unable to make progress. Restarting a container in such a state can help to make the application more available despite bugs.
How can I fix this?
Implement a <span class="code-class-custom">livenessProbe</span> for your pod container, such that it fails when your container needs restarting.
How does this work?
Gremlin will consider the absence of a container's livenessProbe "at-risk".
Availability Zone Redundancy
What is this?
Major cloud providers define a region as a set of failure zones (also called availability zones) that provide a consistent set of features: within a region, each zone offers the same APIs and services.
Why is this a risk?
- Availability zone redundancy ensures your applications continue running, even in the event of critical failure within a single zone.
- Typical cloud architectures aim to minimize the chance that a failure in one zone also impairs services in another zone.
How can I fix this?
- If you are running in a single availability zone now, you should deploy your service to at least one other zone.
- For a Kubernetes service, once your cluster spans multiple zones or regions, you can use node labels in conjunction with Pod topology spread constraints to control how Pods are spread across your cluster among fault domains: regions, zones, and even specific nodes. These hints enable the scheduler to place Pods for better expected availability, reducing the risk that a correlated failure affects your whole workload.
- For a Kubernetes service, you can apply node selector constraints to Pods that you create, as well as to Pod templates in workload resources such as Deployment, StatefulSet, or Job.
How does this work?
- Gremlin will perform zone redundancy analysis similar to how it generates targeting for a zone failure test: Identify all unique zone tags among the Gremlin agents that are co-located with the given service.
- A service with one or no values for <span class="code-class-custom">zone</span> are considered "at-risk".
Memory Request
What is this?
<span class="code-class-custom">spec.containers[].resources.requests.memory</span> specifies how much Memory should be reserved for your Pod container.
Why is this a risk?
The kubelet reserves at least the request amount of that system resource specifically for that container to use. This protects your node from resource shortages and helps to schedule pods on nodes that can accommodate the requested resource amount.
How can I fix this?
Specify an appropriate resource request for your pod container. Think of this as the minimum amount of the resource needed for your application to run.
How does this work?
Gremlin will consider the absence of a container's resource request "at-risk".
Memory Limit
What is this?
<span class="code-class-custom">spec.containers[].resources.limits.memory</span> specifies a maximum amount of memory your Pod container can use.
Why is this a risk?
- Specifying a memory limit for your pod containers protects the underlying nodes from applications consuming all available memory.
- The memory limit defines a memory limit for that cgroup. If the container tries to allocate more memory than this limit, the Linux kernel out-of-memory subsystem activates and, typically, intervenes by stopping one of the processes in the container that tried to allocate memory. If that process is the container's PID 1, and the container is marked as restartable, Kubernetes restarts the container.
How can I fix this?
Specify an appropriate memory limit for your Pod container.
How does this work?
Gremlin will consider the absence of a container's memory limit "at-risk".
Application Version Uniformity
What is this?
Whether your application is configured to ensure all of its replicas are running the exact same version.
Why is this a risk?
- Version uniformity ensures your application behaves consistently across all instances.
- Image tags such as <span class="code-class-custom">latest</span> can be easily modified in a registry. As application pods redeploy over time, this can produce a situation where the application is running unexpected code.
How can I fix this?
Specify an image tag other than <span class="code-class-custom">latest</span>, ideally using the complete <span class="code-class-custom">sha256</span> digest which is unique to the image manifest.
How does this work?
Gremlin will consider the presence of more than one image version running within your service as "at-risk".
CrashLoopBackOff
What is this?
<span class="code-class-custom">CrashLoopBackOff</span> is a Kubernetes state that indicates a restart loop is happening in a pod. It’s a common error message that occurs when a Kubernetes container fails to start up properly for some reason, then repeatedly crashes.
Why is this a risk?
<span class="code-class-custom">CrashLoopBackOff</span> is not an error in itself—it indicates there’s an error happening that causes the application to crash. A <span class="code-class-custom">CrashLoopBackoff</span> error also indicates that a portion of your application fleet is not running and usually means your application fleet is in a degraded state.
How can I fix this?
Fixing this issue will depend on identifying and fixing the underlying problem(s).
- Examine the output or log file for the application to identify any errors that lead to crashes.
- Use <span class="code-class-custom">kubectl describe</span> to identify any relevant events or configuration that contributed to crashes.
How does this work?
Gremlin considers a service as "at-risk" when it finds at least one <span class="code-class-custom">containerStatus</span> in a state of <span class="code-class-custom">waiting</span> with <span class="code-class-custom">reason=CrashLoopBackoff</span>.
ImagePullBackOff
What is this?
Kubernetes pods sometimes experience issues when trying to pull container images from a container registry. If an error occurs, the pod goes into the <span class="code-class-custom">ImagePullBackOff</span> state. The <span class="code-class-custom">ImagePullBackOff</span> error occurs when the image path is incorrect, the network fails, or the kubelet does not succeed in authenticating with the container registry. Kubernetes initially throws the <span class="code-class-custom">ErrImagePull</span> error, and then after retrying a few times, "pulls back" and schedules another download attempt. For each unsuccessful attempt, the delay increases exponentially, up to a maximum of 5 minutes.
Why is this a risk?
An <span class="code-class-custom">ImagePullBackOff</span> error means a portion of your application fleet is not running, and cannot download the image required to start running. This usually means your application fleet is in a degraded state.
How can I fix this?
In most cases, restarting the pod and deploying a new version will resolve the problem and keep the application online. Otherwise:
- Check that your pod specification is using correct values for image’s registry, repository, and tag.
- Check for network connection issues with the image registry. You can also forcibly recreate the pod to retry an image pull.
- Verify your pod specification can properly authenticate to the targeted container registry.
How does this work?
Gremlin considers a service as "at-risk" when it finds at least one containerStatus in a state of waiting with reason=ImagePullBackoff.
Init Container Error
What is this?
An init container is a type of container that has a few modified operational behavior and rules. One of the most dominant features is that init containers are started and terminated before application containers, and they must run to completion with success. They specifically exist for initializing the workload environment.
Why is this a risk?
If a Pod's init container fails, the kubelet repeatedly restarts that init container until it succeeds. However, if the Pod has a <span class="code-class-custom">restartPolicy</span> of <span class="code-class-custom">Never</span>, and an init container fails during startup of that Pod, Kubernetes treats the overall Pod as failed.
How can I fix this?
Init containers are defined in the pod.spec.initContainers array, whereas regular containers are defined under the pod.spec.containers array. Both hold Container objects. pod.spec is defined in the Kubernetes source code below; we can see that InitContainers and Containers are arrays of Container type.
How does this work?
Gremlin will consider one or more containerStatuses in a state of <span class="code-class-custom">waiting</span> with a <span class="code-class-custom">reason=Init Container Error</span> as "at-risk".
Unschedulable Pods
What is this?
A pod may be unschedulable for several reasons:
- Resource Requests: If the pod is requesting more resources than any node can provide, it will not be scheduled. This can be solved by adding nodes, increasing node size, or reducing the resource requests of pods.
- Persistent Volumes: If the pod requests persistent volumes that are not available, it may not be able to schedule. This can happen when using dynamic volumes, or referring to a persistent volume claim that cannot be completed e.g. requesting an EBS volume without permissions to create it.
In rare cases, it is possible for a pod to get stuck in the terminating state. This is detected by finding any pods where every container has been terminated, but the pod is still running. Usually, this is caused when a node in the cluster gets taken out of service abruptly, and the cluster scheduler and controller-manager do not clean up all of the pods on that node.
Why is this a risk?
When the node that the pod is running on doesn't have enough resources, the pod can be evicted and moved to a different node. If none of the nodes have sufficient resources, the pod can go into a CrashLoopBackOff state.
How can I fix this?
If your Pod resource requests exceed that of a single node from any eligible node pools, GKE does not schedule the Pod and also does not trigger scale up to add a new node. For GKE to schedule the Pod, you must either request fewer resources for the Pod, or create a new node pool with sufficient resources. You can also enable node auto-provisioning so that GKE can automatically create node pools with nodes where the unscheduled Pods can run.
The default CPU request is 100m or 10% of a CPU (or one core). If you want to request more or fewer resources, specify the value in the Pod specification under <span class="code-class-custom">spec: containers: resources: requests</span>.
How does this work?
Gremlin will consider one or more containerStatuses in a state of waiting with a reason=Unschedulable Pods as "at-risk".