Visualize Chaos Experiments in Grafana with Gremlin webhooks

.svg)
.svg)

Gremlin is a safe, simple, and secure way to run Chaos Engineering on your systems to improve their reliability and tune your monitoring. Grafana is an open source, highly flexible analytics and visualization platform that can ingest data from many data sources and provide powerful dashboards, reports, and alerts. Combined, these two tools can be an effective combination to ensure the dashboards and alerts provided are actionable and useful to reduce mean time to detection (MTTD).
The list of options for a data source to hold Gremlin events is long, but this tutorial provides an example of writing directly to the Grafana API in Graphite format. Writing directly to Grafana’s database can impact performance if you are running hundreds of attacks per day across many applications, but for most use cases, this won’t have an impact.
If you're curious to see demo of running chaos experiments using Gremlin and Grafana, watch our on-demand webinar.
Prerequisites
- Grafana installed or a Grafana cloud account
- CloudWatch added as a data source in Grafana
- Gremlin account and at least one agent installed
Step 1: Create a Grafana API key
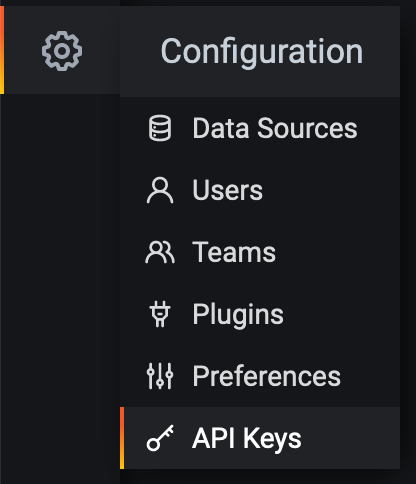
You first need to generate an API key that will allow you to securely send data to Grafana. In your Grafana UI, head over to “Configuration” (gear icon) -> “API Keys.”
Then, click “Add API Key” -> add a “Key name” such as <span class="code-class-custom">Gremlin Key</span> and set the “Role” to <span class="code-class-custom">Editor</span> and click “Add”.
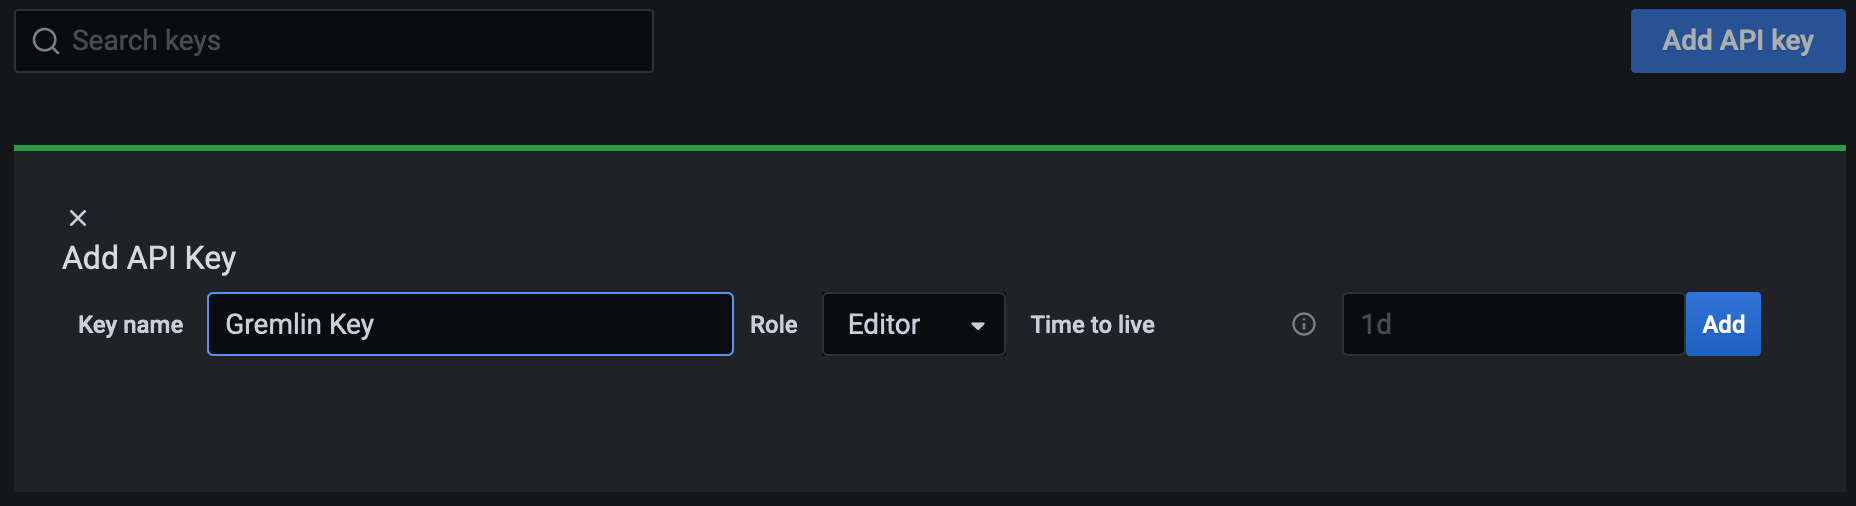
Keep your API key handy, you'll need to reference this API key in Step 3.
Step 2: Log in to your Gremlin account
Next, log into Gremlin where you can add the Grafana webhook to our account. If you don’t have an account, you can request a free trial.
Step 3: Add a Gremlin webhook
Once logged in, you need to add a webhook to send attack data over to Grafana. In Gremlin, go to “Settings” (people icon next to the “Halt All Attacks” button) -> “Team Settings” -> “Webhooks”. Click “New Webhook”.

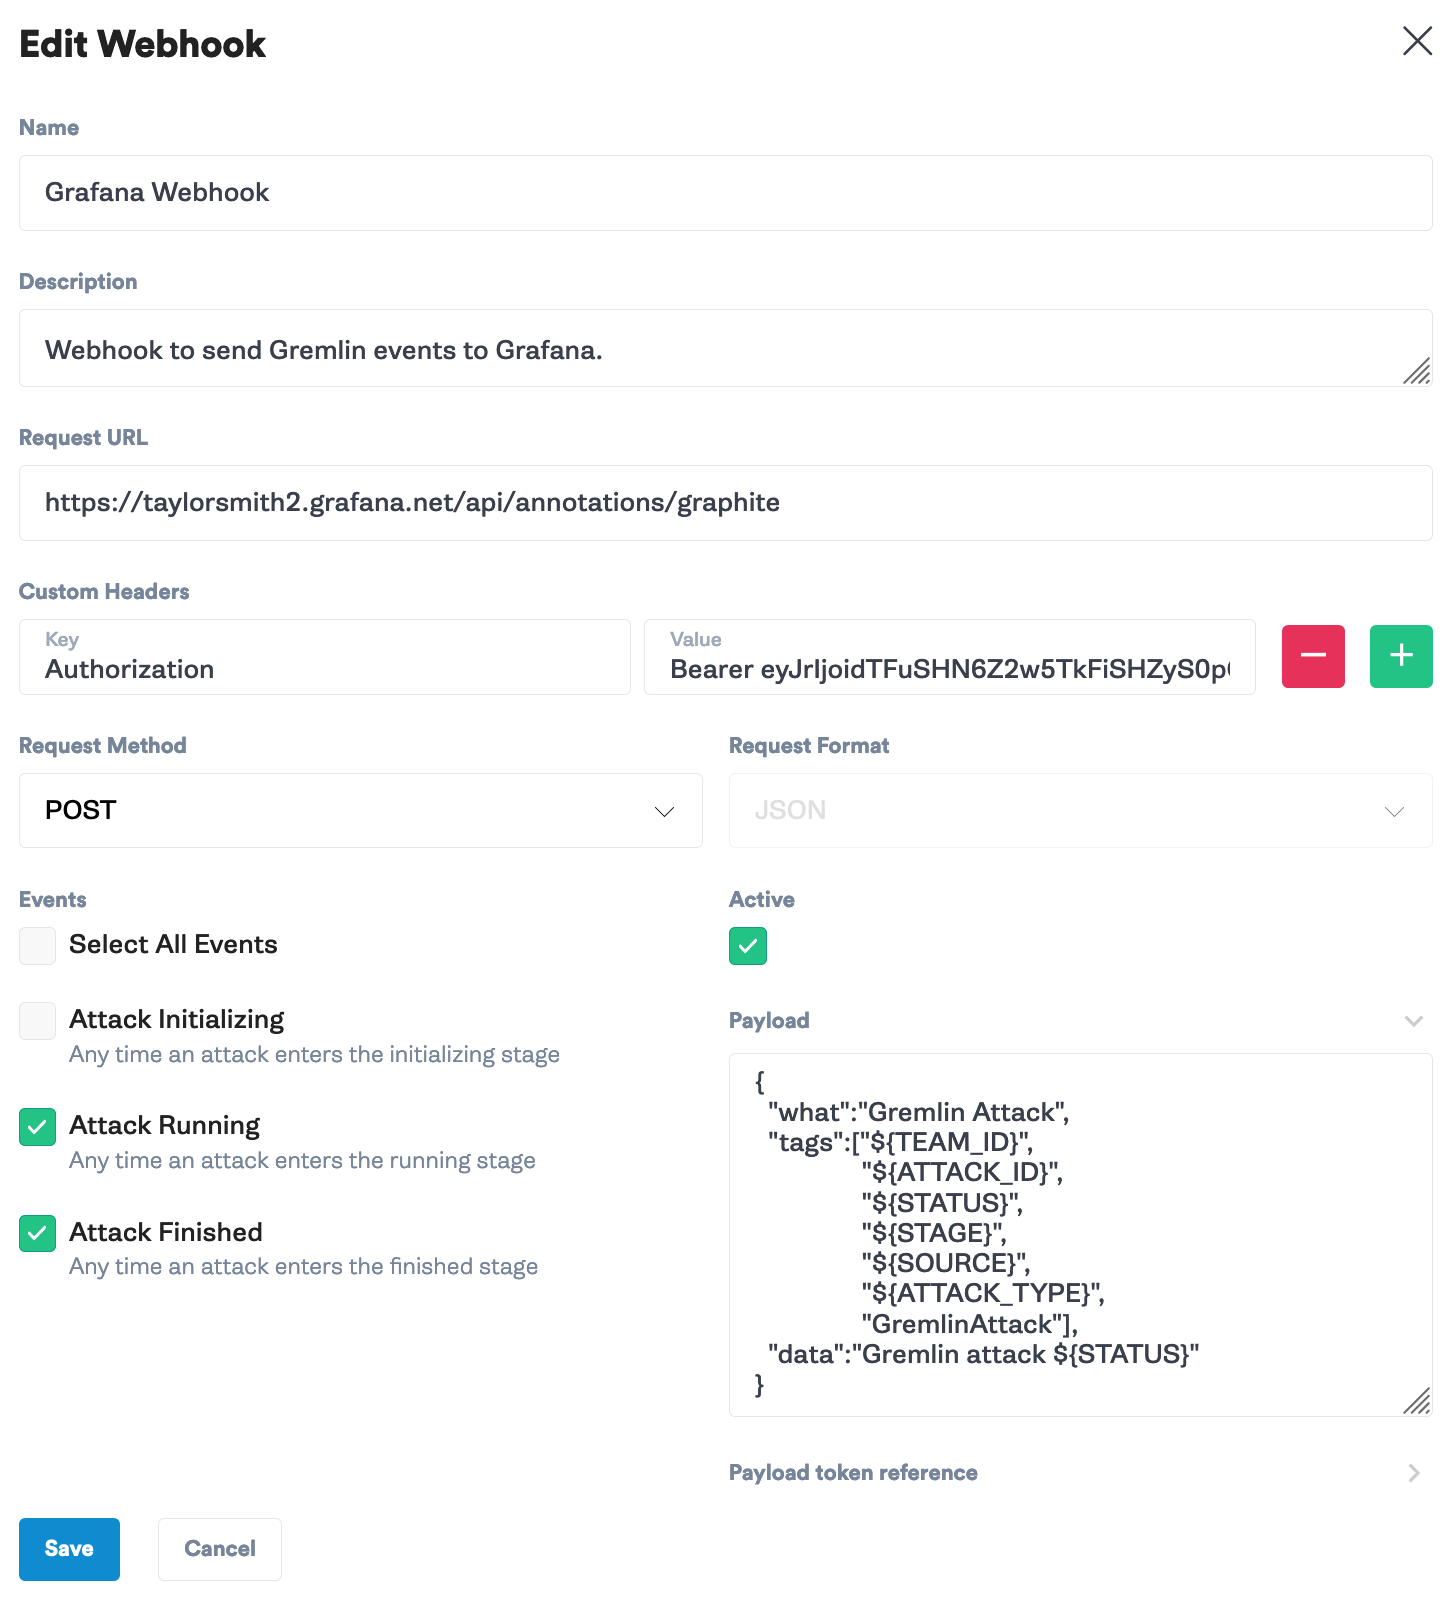
Enter the Name and Description of your webhook. In the “Request URL” field add your Grafana endpoint.
- Grafana Cloud:
- Personal Grafana deployment:
Replace {grafana_URL} with the link to your cloud instance or your own local Grafana instance with the port (port 3000 is the default, but your implementation may be different).
Add a header with <span class="code-class-custom">Authorization:Bearer {Grafana_API_Key}</span> using the API Key you generated in Step 1. In the “Payload” section, update the format to include a “what” key-value pair (required) and tags. Leave off the “when” key-value so that Grafana adds its own time tag. Below is the JSON template:
Step 4: Add a Grafana Dashboard
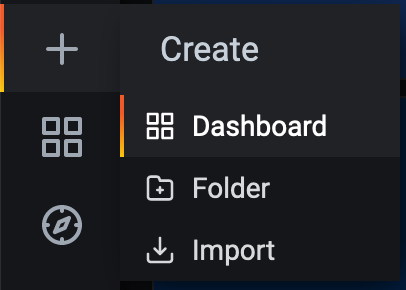
Now you need a way to visualize the Chaos Experiments. This tutorial uses CloudWatch Metrics, but you can use any metrics tool and data source you want, such as Prometheus or InfluxDB. If you don’t have CloudWatch setup as a data source, check out the Grafana docs to add CloudWatch. In your Grafana instance, go to “Create” (plus sign) -> “Dashboard”
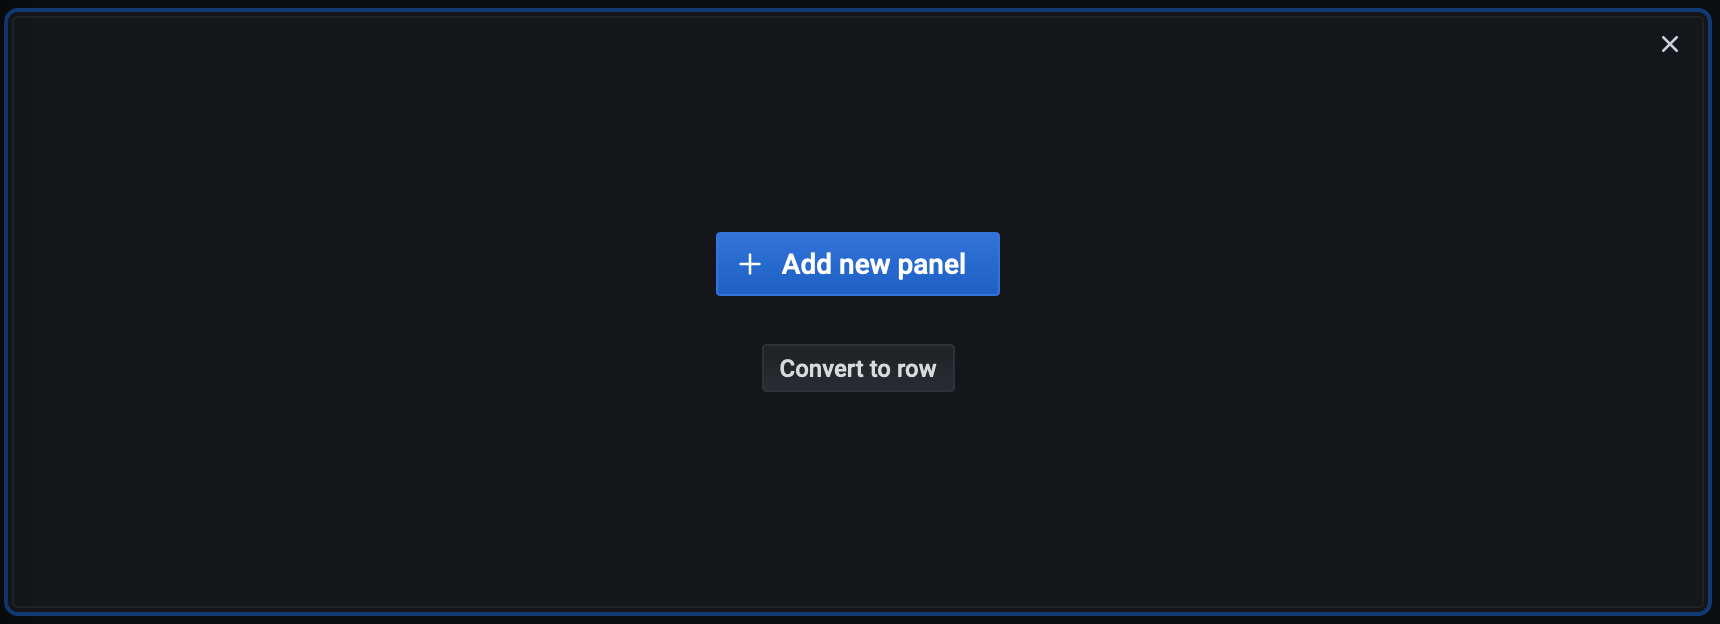
Click “Add new panel”
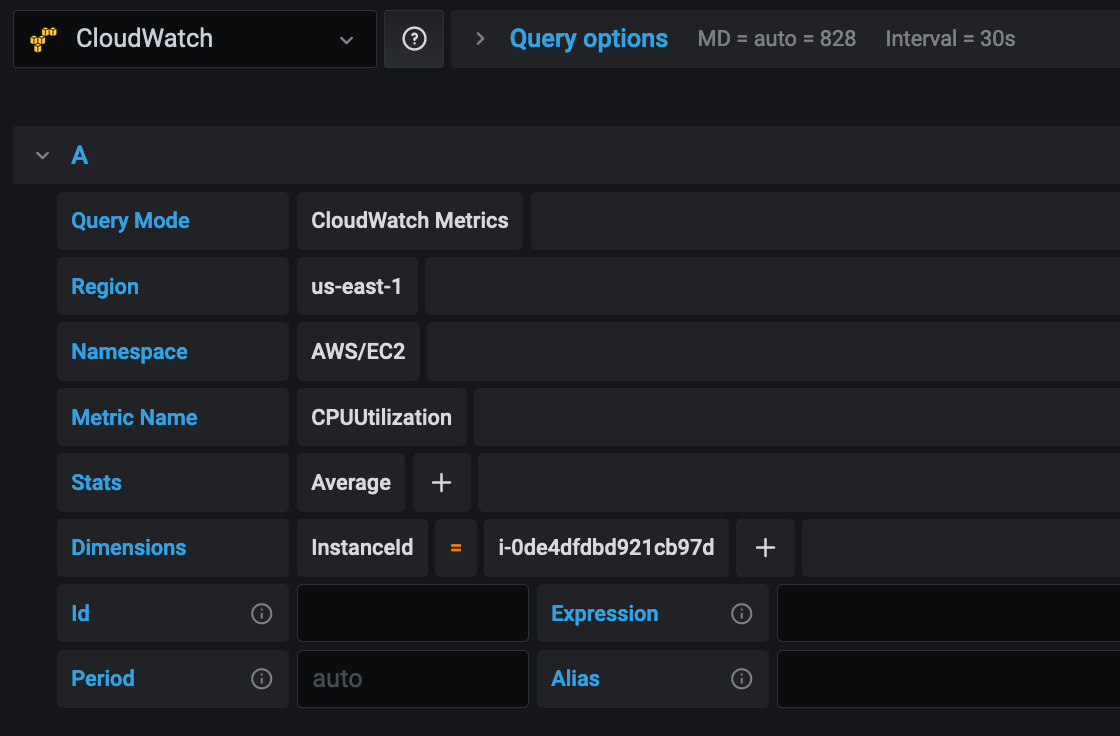
Select <span class="code-class-custom">CloudWatch</span> as the source, the “Region” your EC2 instance is in, set “Namespace” to <span class="code-class-custom">AWS/EC2</span>, “Metric Name” to <span class="code-class-custom">CPUUtilization</span>, “Stats” to <span class="code-class-custom">Average</span>, “Dimensions” to <span class="code-class-custom">InsanceId = {your_EC2_insanceId}</span>. On the right hand side, change the "Panel title" to <span class="code-class-custom">CPU Utilization</span> and under “Axis” -> “Left Y” change “Unit” -> “Misc” -> <span class="code-class-custom">percent (0-100)</span>. Click “Apply.”
Step 5: Add annotations in Grafana
Annotations allow you to visualize with vertical bars when events, like attacks, started and stopped. You’ll create 2 annotations, one for when attacks begin running and another for when attacks finish. You can filter on any of the tags you included in the webhook, including TeamID, source, etc., but for this tutorial, add all GremlinAttack annotations in this example.
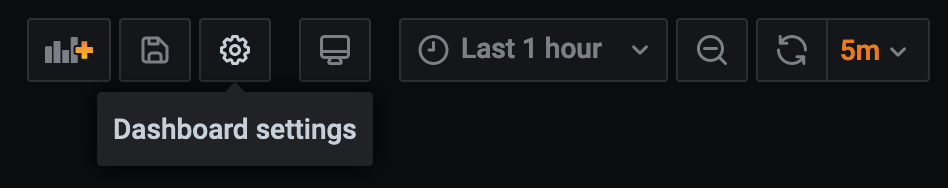
In your dashboard, click “Dashboard settings” (gear icon) and select “Annotations.”
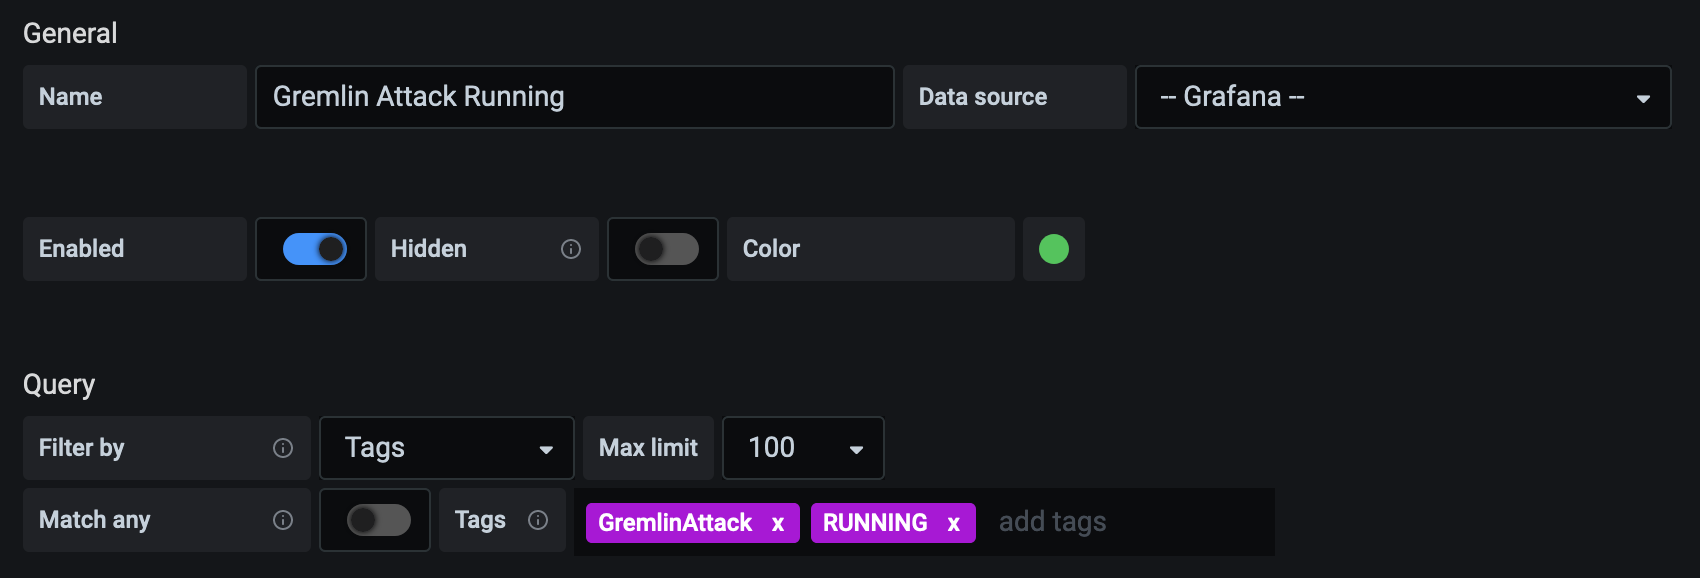
Click on “New.” Fill in the “Name” with <span class="code-class-custom">Gremlin Attack Running</span>, leave the “Data source” as <span class="code-class-custom">Grafana</span> and change the “Tags” to <span class="code-class-custom">GremlinAttack</span> and <span class="code-class-custom">Running</span>, then click “Add.”
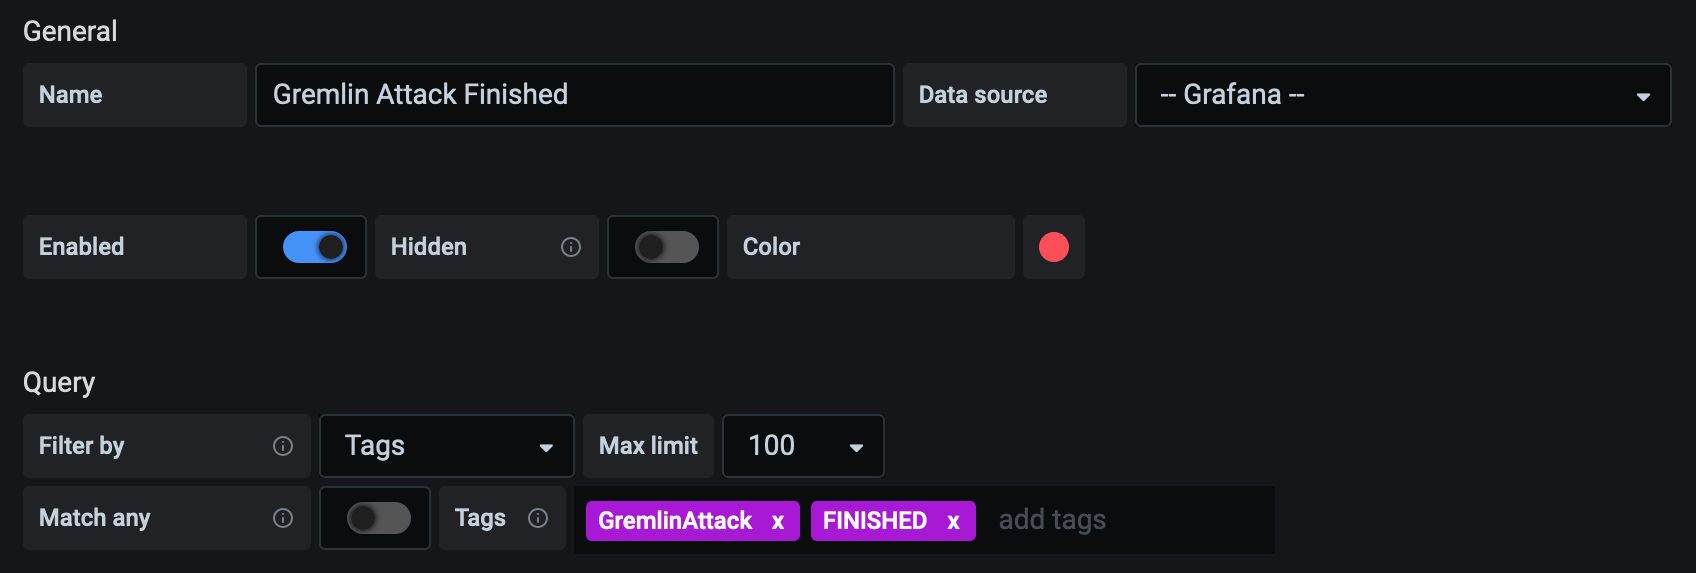
Then click New again and fill in the "Name" with <span class="code-class-custom">Gremlin Attack Finished</span> and the Tags fill in with <span class="code-class-custom">GremlinAttack</span> and <span class="code-class-custom">Finished</span> and click “Add.”
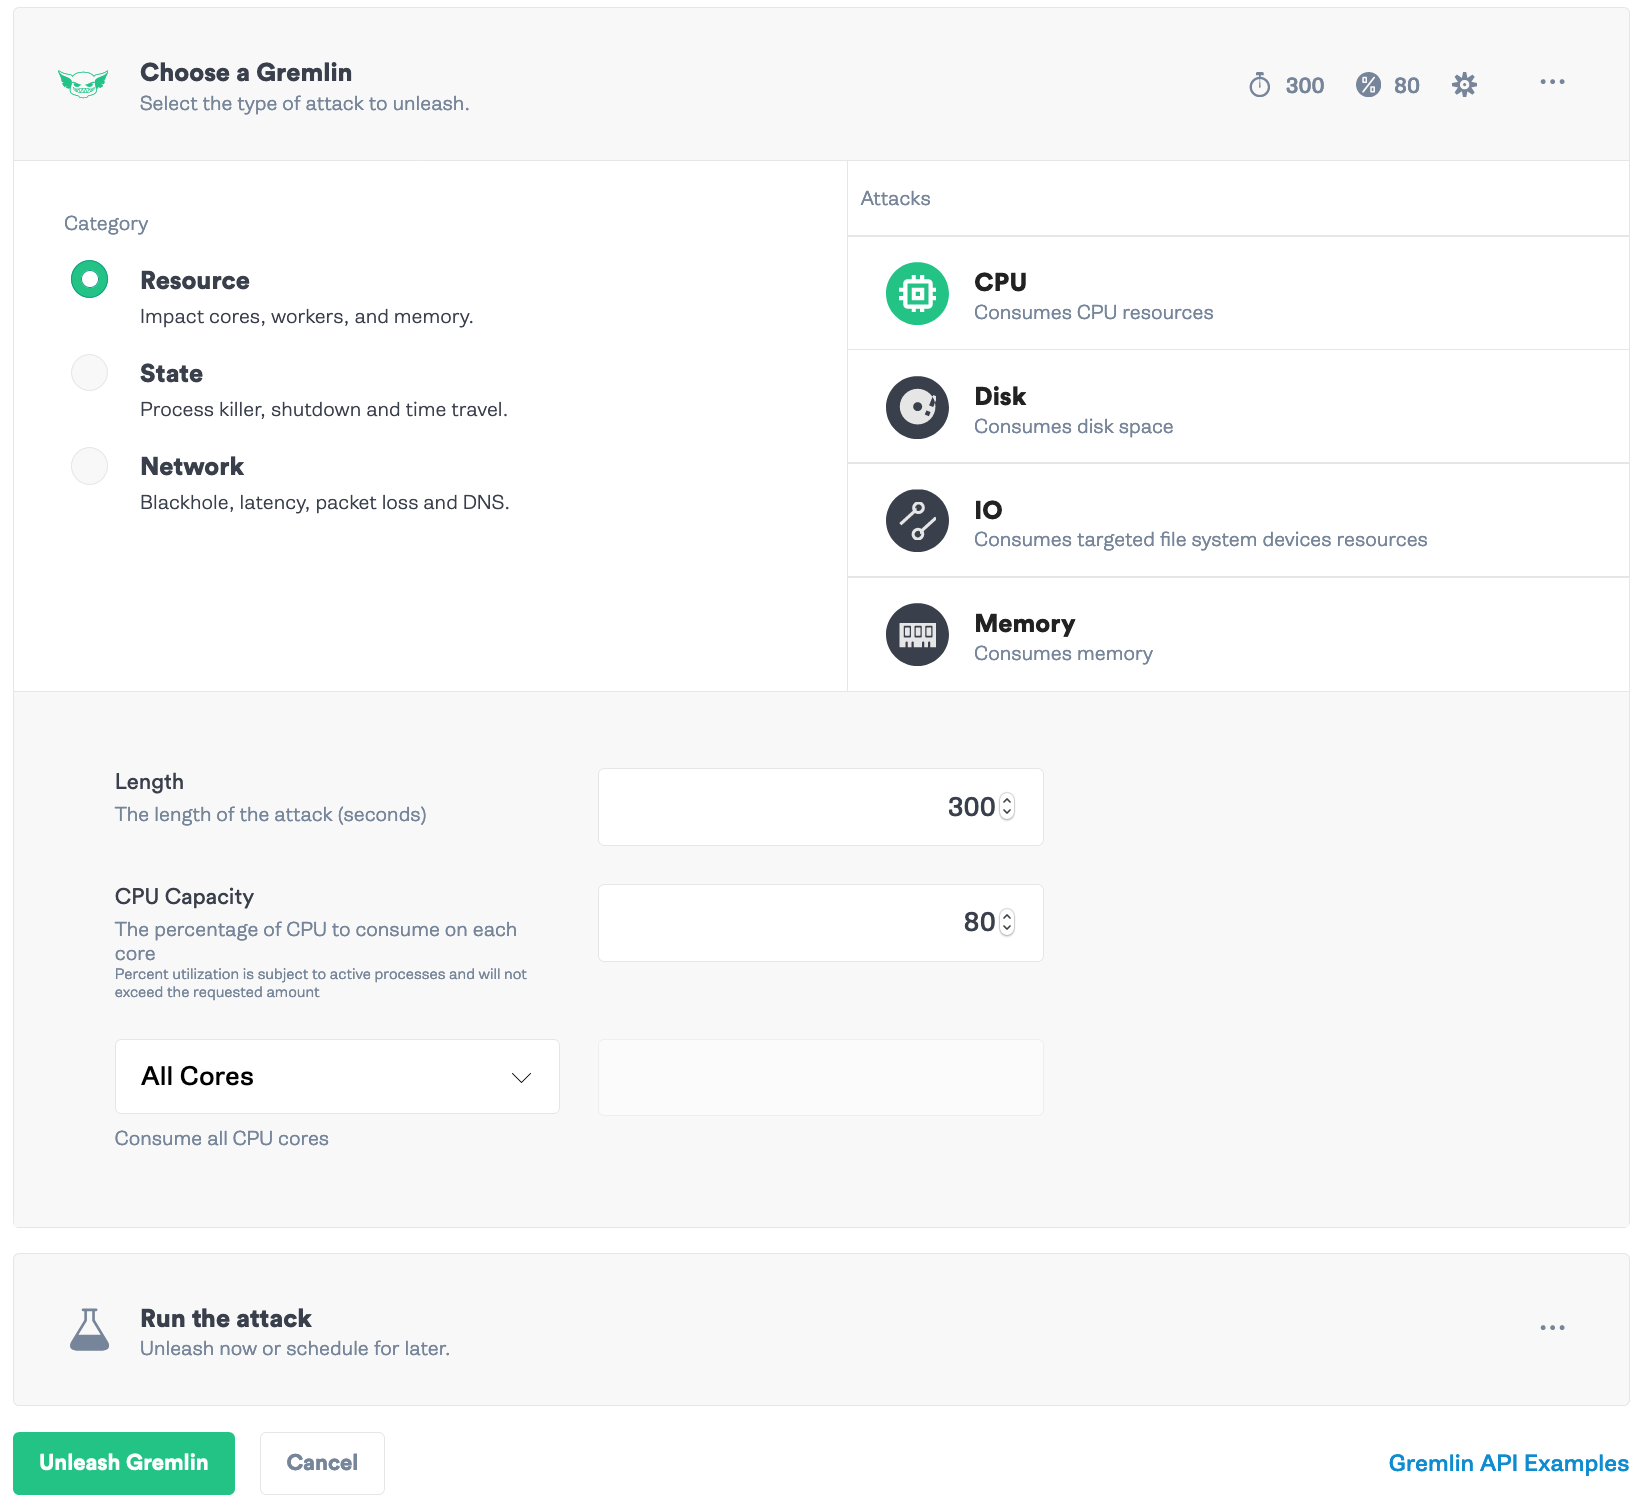
Step 6: Run a CPU attack
Finally, you need to test out the new integration. CPU attacks are a great first attack to run to ensure that your monitoring tools are picking up the increased load and to check your autoscaling policies. Go to the Gremlin app. Click “Create Attack”. Select a target host that has metrics being sent to Grafana. Click “Choose a Gremlin.” Go to “Resources” -> “CPU.” Set the Length to <span class="code-class-custom">300</span> minutes, CPU Capacity to <span class="code-class-custom">80</span>% and <span class="code-class-custom">All Cores</span>, and then click “Unleash Gremlin.”
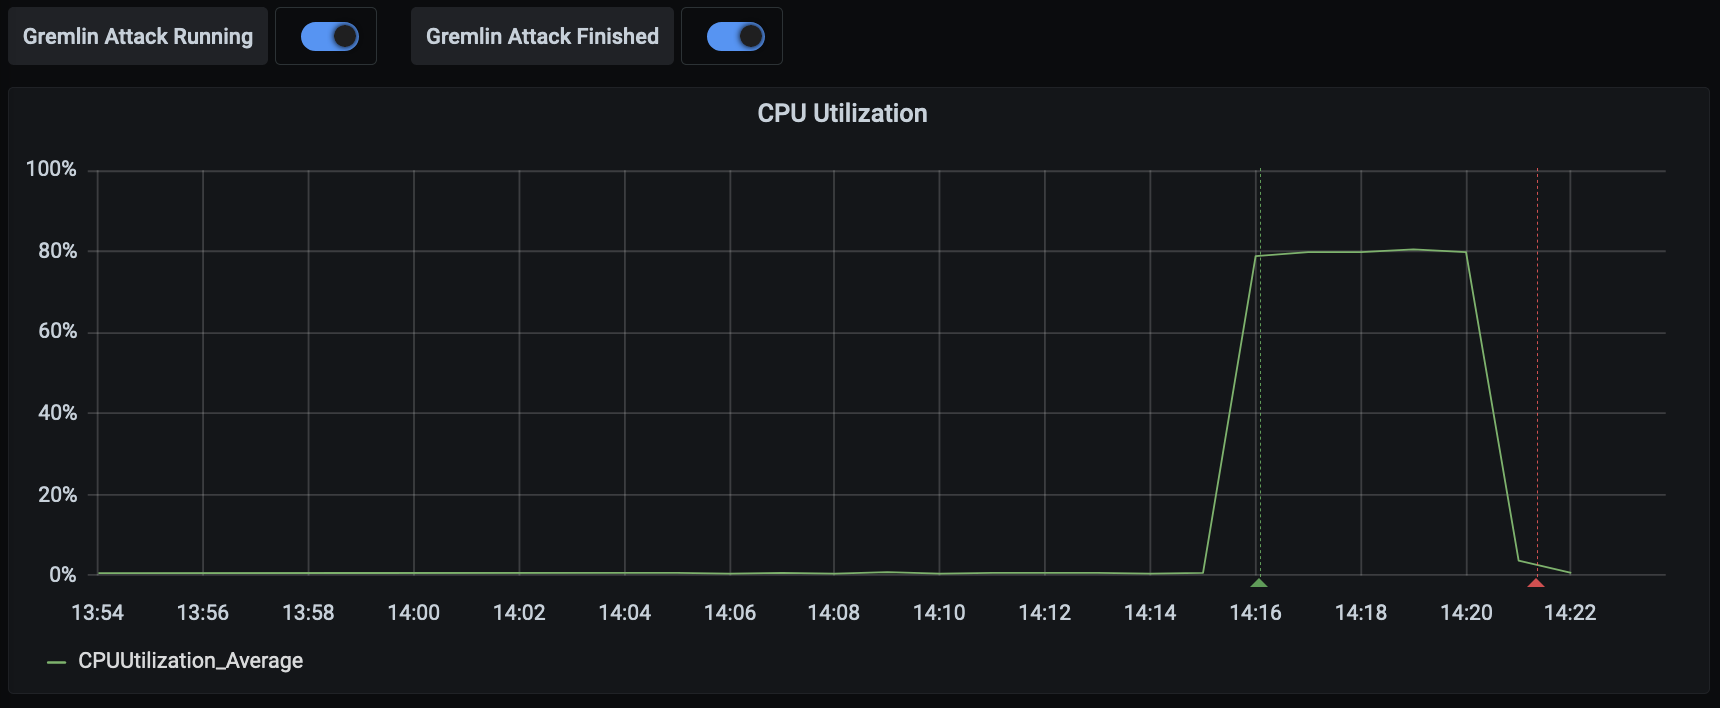
The chart in Grafana will show the increase and decrease in CPU load over time, along with the annotations for the attack running and finishing.
Conclusion
This was just one example of using the Gremlin attack to correlate Chaos Engineering experiments with their impact inside Grafana. You can expand from here to other attacks and see how resilient your system is according to the charts that you follow in your monitoring tool. A great place to start is recreating a previous incident and checking how your updated systems handle the attack, as well as if your team can track the impact inside Grafana, and improve their recovery time compared to the previous incident.
If you're curious to see demo of running chaos experiments using Gremlin and Grafana, watch our on-demand webinar.
Related


Avoid downtime. Use Gremlin to turn failure into resilience.
Gremlin empowers you to proactively root out failure before it causes downtime. See how you can harness chaos to build resilient systems by requesting a demo of Gremlin.GET STARTED
.svg)